

Introduction
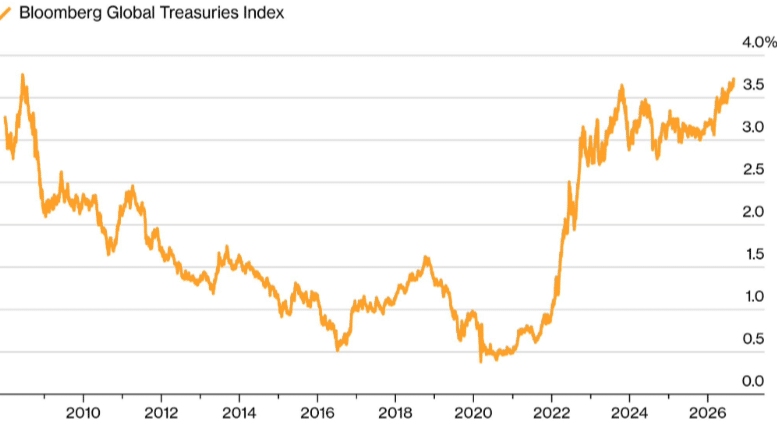
Bond yields are tracking higher. That is the story of August 2026. Depending on which bonds and which data sets you are looking at, yields are now at their highest level in two decades. This is real, and it matters. Higher yields affect everything from government debt-service costs and corporate borrowing to equity valuations and household finances. I have perhaps, rightly or wrongly, been relatively sanguine about these moves. A few investors have reached out asking whether we should be more concerned. For now, my answer remains fairly simple: keep on keeping on. That does not mean ignoring what is happening. It means trying to distinguish between the headlines and the underlying economics.
Figure 1: Global bond yields rise to highest since 2008
Source: Bloomberg
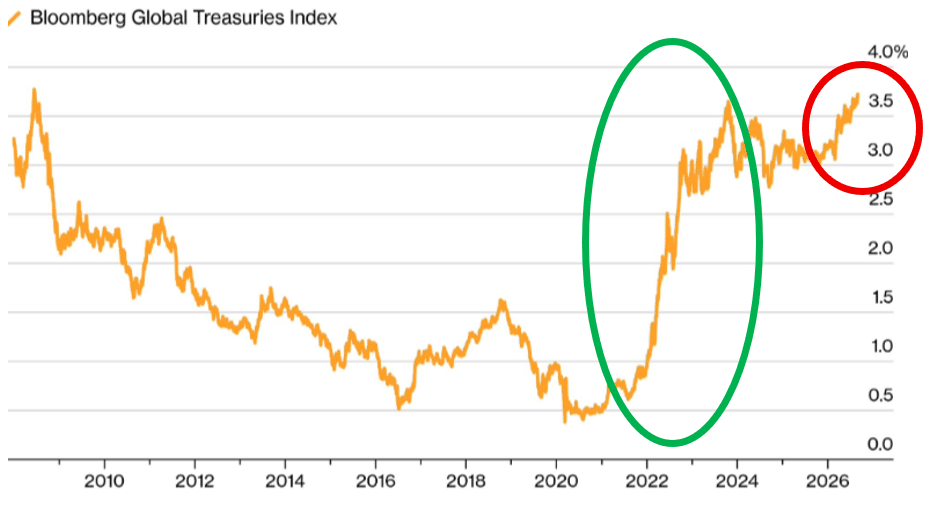
The chart above landed in my inbox this morning and prompted me to put some thoughts on paper. These are exactly that: my musings and a discussion document, rather than a definitive forecast. There is a much richer debate beneath the headlines currently dominating the bond market, and I would encourage the debate. First, however, some context. The chart is set out again below. We are not talking about the rising yields in the green circle. Those moves were broadly digested by markets as central banks aggressively tightened monetary policy in response to the inflation shock that got out of hand following the COVID-19 pandemic. We are instead discussing that small red circle on the top right. That is what is happening right now.
Figure 2: Global bond yields rise to highest since 2008
Source: Bloomberg
Beware of headlines
I take managing investments very seriously, but now and then we are allowed to be a little frivolous. On 9 May 2025, a journalist asked me to comment on why the rand had moved by 0.02% over the preceding 24 hours. I recall thinking that commenting on a ZAc5 move in the rand was rather silly. In a moment of human frivolity, I suggested that perhaps it was because the Cardinals had elected Pope Leo XIV the previous day. I thought nothing of it. I assumed the journalist would recognise that this was a deliberately silly response to a rather silly question. I was wrong. The resulting article carried the headline “Rand steadies as markets shrug off Fed hold and Vatican smoke signals.”
Yes, not my finest moment. There were, however, two important lessons in that. First, do not joke with the media; they do not always get it. Second, be wary of headlines. They can create a very different impression from the underlying facts.
My blunder fortunately did not live very long. Though I understand that, Investec Chief Economist Anabelle Bishop did subsequently find herself being called upon to disagree with my assertion that the Papal Conclave could ever be relevant to the rand.
This episode is relevant because headlines can become investment narratives very quickly.
Fiscal deficits
For a misleading headline to gain traction, it needs to be somewhat more believable than my faux pas, and it helps if it has a few supporters. We are repeatedly being told that so-called “bond vigilantes” are pushing yields higher because of concerns about the US fiscal deficit. This seems to resonate better than my headline, so let us do some basic analysis.
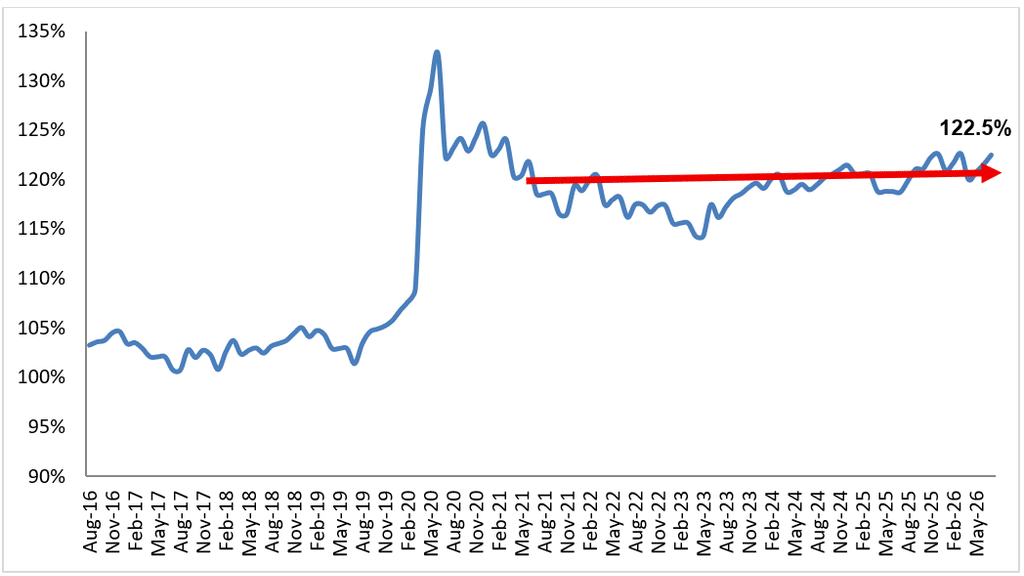
Figure 3: US total debt as a percentage of GDP
Source: US Fiscal Data (Treasury), Bureau of Economic Analysis.
The first observation is that US government debt as a percentage of GDP has been relatively stable since 2021. Yes, the deficit remains substantial, but the higher inflation of late has largely inflated away the debt levels. If you consider Japan, you will see a similar situation where its debt burden relative to GDP has also been declining. So, why is this suddenly a problem? Why now rather than five years ago? Bear in mind there have been two instances in the past hundred years when developed-market government debt has been substantially higher than it is today. The UK, for example, has had periods when government debt exceeded 200% of GDP, and it managed to work it down. If anything, one might argue that the US is moving from the green all-good zone toward the amber keep-an-eye-on-this zone.
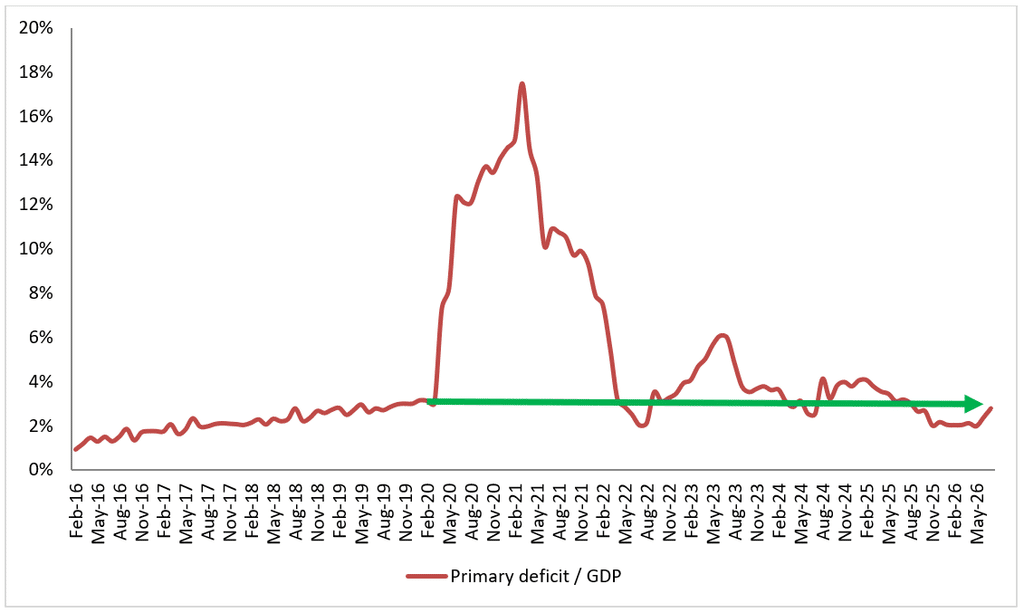
In the chart below, we turn our attention toward the US deficits, which have increased this year as a result of the One Big Beautiful Bill.
Figure 4: US Fiscal deficit and primary deficit, % of GDP
Source: US Fiscal Data (Treasury), Bureau of Economic Analysis.
Our focus here is on the primary deficit in the US, which excludes interest expense. As a rough analogy, one could think of this as EBITDA for a government. The point is that the deficit we are talking about is in line with that of 2018. Again, why is this a problem now? A primary deficit of 2% should be manageable.
A further concern is demographics. There is a discussion that an ageing US population is likely to place increasing pressure on government spending over time. I am sympathetic to this argument. But it is hardly a new development. Demographic pressures have been visible for decades. So why has the bond market suddenly decided that this is a defining issue today?
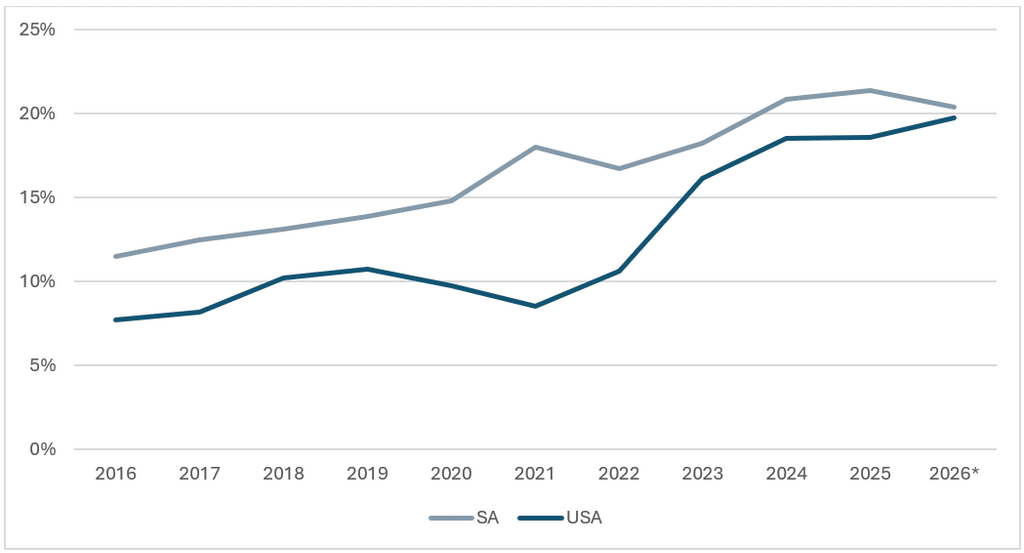
Perhaps the more immediate concern is the cost of financing debt. Rising interest rates have an impact on debt affordability. In the chart below, we look at the interest payments by the South African (SA) and the US governments as a percentage of total government revenue. Rising interest rates mean that US debt service costs have increased meaningfully since COVID-19. As of today, SA and US debt service obligations are converging toward 20% of revenue. Ironically, SA’s obligations are declining, whilst the US obligations are climbing. Clearly, this is worrisome for both countries. But it is important to retain perspective. With nominal US GDP growth of c. 5.5% and a budget deficit of around 5.9% of GDP, we do not believe that the US fiscal position represents an imminent crisis. It needs to come down over time, but we do not see evidence of an unavoidable cliff event.
Figure 5: Interest expense, % of revenue
Source: US Fiscal Data (Treasury), Bureau of Economic Analysis, SARB, Stats SA, National Treasury.
Finally, we note that there is a problem with the simple “US fiscal crisis” explanation. Global yields in general are rising, and they are not limited to the US. If the current move were primarily a US fiscal story, then yields in destinations like Germany should be unaffected. They are not. This suggests that something broader is happening.
In summary, we really struggle to subscribe to the headlines that this is a fiscal deficit story. The GameStop saga taught us an important lesson about markets: if enough people read the headlines and act on them, then, even though it is irrational, the narrative can become a market-moving event.
We need to recognise that the same dynamic can operate in bond markets. There is clearly a bearish sentiment towards bonds at present, fuelled in part by headlines around deficits, inflation and government borrowing. That sentiment can persist for considerably longer than fundamental investors might expect. Fixed income’s approach toward irrational markets is not to compete with stupidity. We would rather make fundamental investments in measured size and accept that, for periods, the market may not reward us. In time it will. In that context, we have been cautious buyers of bonds, knowing that we might be on the wrong side of the market for a while. We are comfortable with that.
Yield normalisation argument
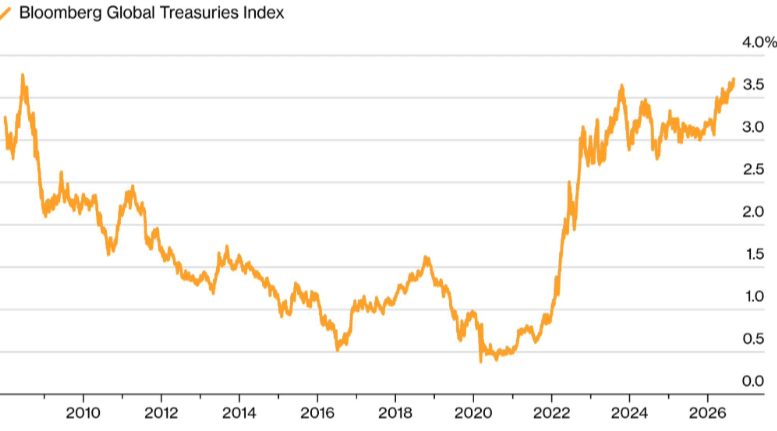
Let us return to the chart that initially sparked this discussion and consider the longer-term history of bond yields.
Figure 6: Global bond yields rise to highest since 2008
Source: Bloomberg
In our view, it is normal for bonds to pay interest to their investors. That statement sounds obvious. Yet, around 2020, approximately 50% of non-US government debt was issued at negative yields. This amounts to about 27% of total global government debt being issued with a negative yield. As an investor, you could effectively lock in a guaranteed loss by lending money to the government. Historians may one day look back on that and wonder, “What were they thinking?”
Assuming that we do not want to lock in perpetual losses by lending money at negative interest rates, then rates need to rise. There is a reasonable argument that perhaps what we are seeing today is not the beginning of a bond-market crisis, but an overdue normalisation in yields. Leading up to the COVID-19 pandemic, global rates at 1% for a decade did not make sense with growing economies.
If this is the case, then it is a massively bullish indicator for global markets. For the first time since the 2008 global financial crisis, the global economy appears able to withstand normal interest rates, while continuing to grow at 2% to 2.5%. This is quite a remarkable and positive development.
The downside to this argument is that we need to decide what the new normal is for interest rates. Based on nominal US growth rates and a stubborn inflation rate, one could make a reasonable case for the US 30-year bonds to have a fair yield anywhere between 5.5% and 6.5%. If that is the case, we may well have quite a bit of adjustment to go. This is not ideal for interest rate-sensitive equities or home builders that might come under further pressure in the short term. It is also the reason why we are cautiously buying bonds but not filling our boots yet.
Economists’ view
Economists often argue that the yield on the 10-year government bond should be the real economic growth rate plus the inflation rate. Therefore, if yields are moving higher, the bond market is signalling either higher economic growth or higher long-term inflation. Our fixed income team remains resolute that inflation is more likely to decline than go up. We have base effects from tariffs that are leaving the system; we have low-wage growth, while a technical correction in housing data should eventually pull shelter inflation lower. Will US inflation ultimately return to 2%? Eventually we believe it will, although the US Federal Reserve (Fed) may choose to hasten this process along with a rate hike.
In a world where inflation is likely to gradually drift lower, economists will be arguing that the bond market is signalling that a growth impulse is coming, either as household finances recover or as the economy reaps dividends from the gargantuan AI investment.
We think that there is some element of truth to this. At the macro level, the US economy remains reasonably healthy. We are very cautious, however, because it is only certain sectors that are holding up, and the strength is not particularly broad-based. Health Care is propping up the employment numbers, while AI investment is supporting economic growth. We would much prefer to see a broader-based expansion. When growth is concentrated in one or two key sectors, the system becomes more vulnerable. If one of those sectors sneezes, the rest of the economy can catch a cold.
We are also watching market behaviour closely. There is a definite positive correlation between oil prices and bond yields. Each oil price jump has a corresponding bond reaction, as we saw on 1 September. Perhaps that means we are pricing in the risk of oil inflation in the future, notwithstanding the Anchor Fixed Income team’s views. However, there is an important counterpoint: markets are currently pricing in a 70% chance of a rate hike at the next Fed meeting, which is hardly runaway inflation.
Again, if the market is pricing an accelerating economic growth rate, then this is a positive investment environment. Just take measured bets as this could play out over a long timeframe.
Market signals
The bond market is often described as “the smartest market in the room.” The classic example is the yield curve. An inverted yield curve (when 10-year bond yields fall below 2-year bond yields) has historically been the most reliable indicator of an impending recession. Right now, the curve is going the other way. The gap between the 10-year and the 2-year bond is increasing. It is moving in the opposite direction to the traditional recession indicator. Perhaps the bond market is telling us that everything is going to work out.
My only word of caution is that we have a new US Fed chair, Kevin Warsh, who appears willing to experiment with a different policy style. It is certainly plausible that he will make a policy mistake and that we will see both a technical recession and a market correction. Combine that possibility with the narrowness of what has been working and the stretched US consumer balance sheets, and the consequences could be meaningful and painful.
We also know that rising rates (which may well have further to run) will have a negative impact on interest rate-sensitive assets. In fact, US yields approaching 6% are competing with the long-run return on US equities, and stocks might need to adjust a little. Still, in the long run, we find this to be an attractive time to be cautiously invested in bonds and equities.