

ECONOMICS
Global overview
Geopolitics remained the dominant driver of global macroeconomic developments in 3Q26. A 60-day US–Iran ceasefire framework, announced late in 2Q26, initially eased energy-supply concerns, with Brent crude briefly falling towards US$70/bbl. Renewed tensions subsequently pushed oil back above US$100/bbl, bringing energy prices firmly back into focus as the main source of upside inflation risk.
Oil: A volatile, event-driven market
Brent crude has traded in an unusually wide range since mid-year, moving from around US$70/bbl to more than US$100/bbl. Prices spiked to c. US$107/bbl on 15 September after drone strikes forced Saudi Arabia to shut its East-West pipeline, the main export route bypassing the Strait of Hormuz. Brent subsequently retreated at the end of 3Q26 as Saudi Arabia restored some export flows and signs of progress emerged in US–Iran discussions.
However, the outlook remains unusually uncertain. A durable diplomatic settlement could see the geopolitical premium unwind quickly, while renewed escalation in the Gulf or further disruption to Red Sea shipping could push oil prices higher.
Global inflation: Energy is feeding through
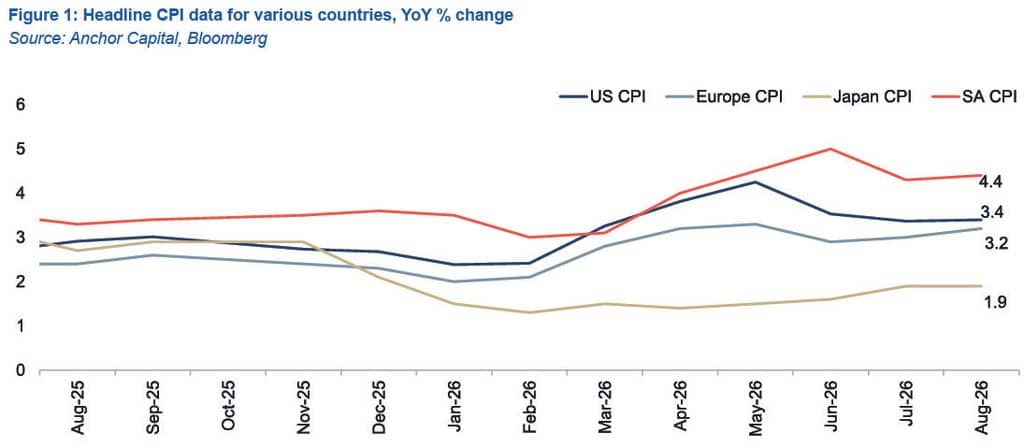
In the euro area, headline inflation rose to 3.2% YoY in August, matching May’s two-and-a-half-year high. Energy inflation jumped to 14.3%, the highest level since January 2023. US headline CPI held at 3.4% YoY in August, driven by elevated gasoline and fuel prices. Gasoline inflation rose 27.4% YoY (July: 24.6%), while fuel-oil inflation increased to 52% (July: 39.1%).
Japan’s annual inflation remained steady at 1.9% in August, up from 1.4% in April, as transport costs increased. The key risk is that a temporary energy shock develops into broader second-round effects through wages, services and inflation expectations.
Central banks: From looking through to tightening
In September, the European Central Bank (ECB) raised its key interest rate by 25 bps to 2.65%, while the Bank of Japan (BoJ) increased its key short-term rate by 25 bps to 1.25%.
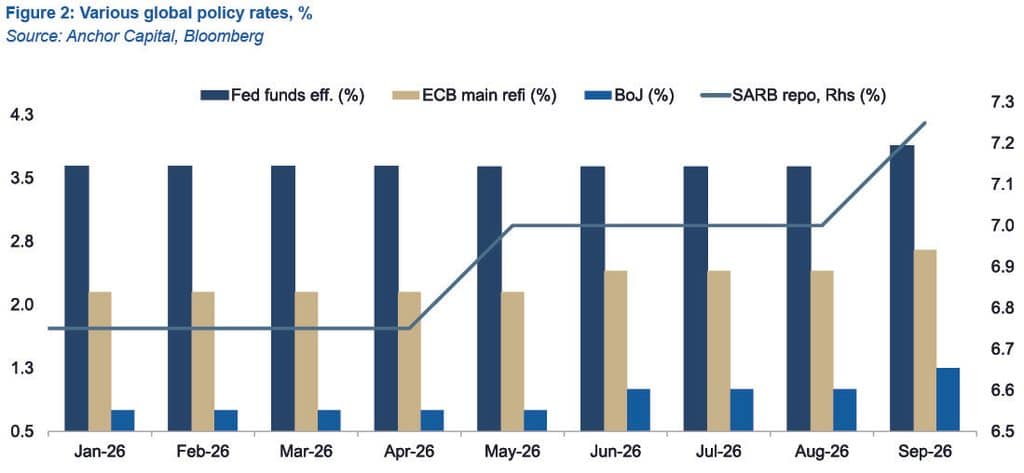
The US Federal Reserve (Fed) also delivered a widely anticipated 25-bpt hike at its September meeting, lifting the federal funds target range to 3.75%–4.00%. It was the first increase since July 2023 and the first policy move under newly appointed Fed Chair Kevin Warsh. The Fed no longer views the energy shock as something it can look through and is now concerned about second-round effects on underlying inflation. Markets currently assign an 81% probability to the Fed holding rates at 3.75%–4.00% on 28 October, following softer-than-expected labour market and PCE inflation data. However, expectations of a further 25-bpt hike in December and additional increases in 2027 remain.
The key issue for markets is the direction of rates. Higher energy prices, renewed inflation pressure and increased government borrowing have pushed global bond yields higher, making the path towards monetary easing more uncertain.
SA: Weaker growth, higher rates
SA real GDP contracted 0.2% QoQ in 2Q26, against a consensus forecast of a 0.1% decline. It was the first quarterly contraction since 3Q24. Several sectors still expanded, but weakness in some of the largest sectors, including mining, manufacturing, and trade, catering and accommodation, drove the decline. The oil shock has raised input and transport costs across the domestic economy, and the longer prices remain elevated, the harder it will become for firms to absorb them.
Inflation is contained for now, but above target.
SA August headline CPI eased to 4.4% YoY from 5% in June, while core inflation has remained sticky at 4.1% YoY in August, unchanged from June. However, the outlook has deteriorated as higher oil prices and fuel pass-through are projected to lift inflation in coming prints.
Against this backdrop, the South African Reserve Bank’s (SARB) Monetary Policy Committee (MPC) unanimously raised the repo rate by 25 bps to 7.25% on 23 September. The MPC statement retained its reference to persistent oil price pressure, reflecting the view that the oil shock poses a more durable risk to inflation.
The SARB now expects headline inflation to peak at 5.4% in 4Q26, compared with 4.3% in its July forecast, and to remain at 5.3% in 1Q27. Fuel CPI is expected to rise by 40.0% YoY in 4Q26, compared with the previous forecast of 10.3%. Inflation is then expected to decline relatively quickly as the fuel shock unwinds, easing to 3.9% by 2Q27 and 3.1% by 4Q27, when base effects take fuel inflation to -18.1% YoY.
The key risk is that elevated oil prices generate second-round effects, particularly through higher transport, logistics and food costs. If these pressures become embedded in broader inflation dynamics, core inflation could remain sticky or accelerate further, reducing the scope for the SARB to remain on hold.
External pressures on the rand
The US dollar strengthened towards the end of 3Q26, with the US Dollar Index (DXY) moving above 100, while gold retreated sharply as higher US Treasury yields and a stronger US dollar weighed on non-yielding assets.
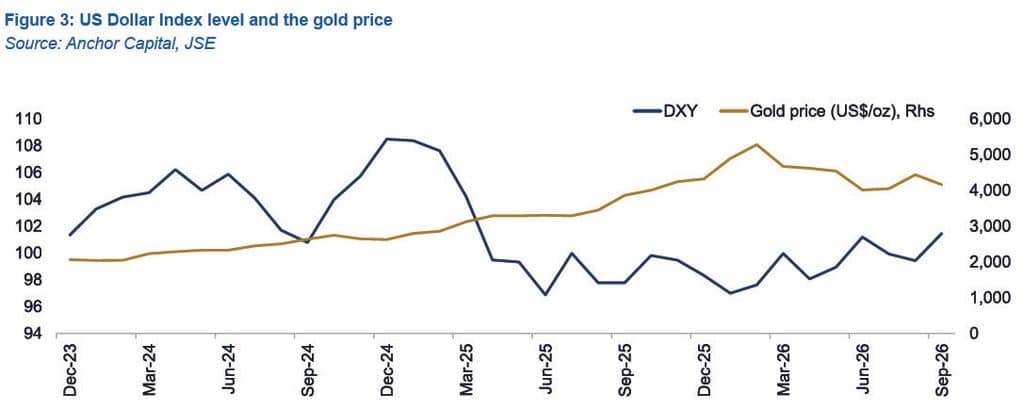
Towards the end of 3Q26, the rand weakened to around R16.39/US$1 from about R15.9/US$1 a month earlier. A more hawkish Fed is supportive of the US dollar, leaving the rand vulnerable and raising the risk of imported inflation. With the repo rate at 7.25% and the upper bound of the Fed funds target range at 4.00%, the nominal policy-rate differential is 325 bps.
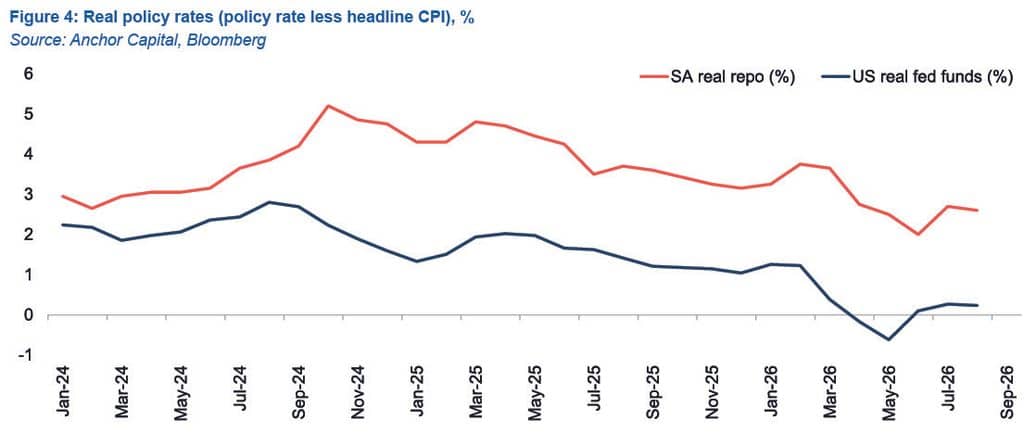
In real terms, however, SA’s interest rate cushion remains relatively strong. The real repo rate is around 2.9% on headline CPI, compared with roughly 0.6% in the US. This remains supportive of carry demand for rand-denominated assets. However, the combination of a stronger US dollar, elevated oil prices, softer precious-metal prices and persistent domestic inflation increases the risk of sustained rand weakness.
SA EQUITIES
SA equities were broadly flat in 3Q26, with the FTSE/JSE Capped All Share Index declining 0.3%, taking its YTD total return to -3.1%. The relatively benign headline number, however, masked significant dispersion beneath the surface. In 3Q26, basic materials gained 15.6%, supported by precious metals (+16.7%) and diversified miners (+6.7%), while telecoms (-17.9%), general retailers (-16.7%), technology (-12.0%) and financials (-3.7%) came under pressure. The FTSE/JSE SA Banks Index (FTJS3011) declined 4.3%, giving back some of its strong 2Q26 gains, while Naspers fell 14.7%. Consumer-facing businesses were particularly weak, with Woolworths, Truworths, The Foschini Group (TFG) and Pepkor all declining by around 20% or more during the quarter.
These moves occurred against an increasingly challenging global backdrop. Oil prices rose sharply as the Middle East conflict continued, global interest-rate expectations moved higher, and pressure spread beyond crude oil into refined products such as diesel. Despite these headwinds, we believe the recent weakness is creating an attractive 12-month opportunity. We remain overweight SA equities and expect a total return of approximately 15% over the next 12 months. Importantly, this is not a call for a broad-based recovery in the domestic consumer. Rather, valuations have become increasingly attractive, pockets of strong earnings growth remain, and we believe JSE-listed equities are among the markets most geared to a positive resolution of the Middle East conflict.
The domestic consumer is the area where we remain most cautious. The combination of higher interest rates, elevated fuel prices and a still-weak economic environment is increasingly evident in the operating performance of several larger consumer-facing businesses. Real GDP contracted by 0.2% in 2Q26, ending six consecutive quarters of expansion, while the SARB raised rates by 25 bps in September as higher energy prices increased inflation risks.
More importantly, the energy problem has evolved beyond simply the price of crude oil. Global refining capacity remains constrained, meaning diesel prices may remain elevated even if crude prices moderate from current levels. For SA households and businesses, this is particularly significant: diesel is embedded throughout the economy, from transport and logistics to agriculture and food production. Sustained higher diesel prices ultimately reduce disposable income and place pressure on corporate margins. We therefore remain cautious about extrapolating a broad-based consumer recovery over the next year.
The opportunity within consumer-facing shares is instead becoming increasingly stock-specific. Shoprite and Boxer remain the operational standouts, while we continue to see attractive opportunities in businesses such as Premier Foods, Advtech, and Southern Sun. The extraordinary dispersion in retail share-price performance also reflects a market that is becoming less forgiving of weak execution and poor capital allocation. Over time, we would not be surprised to see further consolidation in parts of the local retail industry, particularly within discretionary retail.
Resources provide an important counterweight to this cautious view on the domestic consumer. The sector rebounded strongly during 3Q26 after a very difficult 2Q, although our preference remains to differentiate between individual commodities rather than making a broad call on the mining sector.
Gold remains particularly difficult to forecast using its traditional relationships with real interest rates and the US dollar. One explanation for its continued resilience has been ongoing diversification by global central banks into gold. We view this as a structural source of demand that is likely to persist and therefore retain modest exposure to SA gold producers.
From a fundamental perspective, however, copper remains our preferred commodity exposure. The combination of accelerating AI-related capital expenditure, rising electricity demand and the global energy transition is likely to require substantial investment in electricity generation and transmission infrastructure over many years. We continue to favour Anglo American and Glencore as our preferred diversified mining exposures.
Elsewhere, one of the biggest frustrations for local investors this year has been the performance of Tencent and, more acutely, Naspers and Prosus. The local technology sector declined a further 12% during 3Q26 and is now down 34.5% YTD.
We have been disappointed by some of Prosus management’s capital-allocation decisions, but valuation is increasingly becoming an important consideration. With Naspers trading at a discount of around 50% to its underlying assets and Tencent trading at what we believe to be close to a trough valuation multiple, we see an increasingly asymmetric opportunity for patient investors. The timing of the recovery is uncertain, but Tencent’s investment in AI provides an important potential source of future value creation that we believe is receiving relatively little recognition at current prices.
Looking ahead, our 15% expected total return needs to be considered against a wide range of possible outcomes. The JSE is not expensive: the FTSE JSE Capped All Share currently trades on approximately 10.2x forward earnings, while earnings expectations point to meaningful growth over the coming year. Valuation alone, however, is never sufficient reason to own equities. The more important consideration is what could cause earnings and market expectations to change.
Here we believe the risk/reward has become increasingly attractive. A resolution or meaningful de-escalation in the Middle East conflict could reduce energy prices and global inflation concerns, ease pressure on interest rates and provide welcome support to the local consumer. Given the sensitivity of both the local economy and the JSE to energy prices and global interest rates, SA equities could benefit materially from such an outcome. Conversely, a prolonged conflict, persistently elevated diesel prices and further monetary tightening would place additional pressure on domestic earnings and represent the key risks to our view.
Against this uncertain backdrop, portfolio construction is more important than making a single call on “South Africa”. The universe of high-quality, dependable earnings compounders on the JSE continues to narrow, a phenomenon that is increasingly evident across global markets as index concentration rises. We believe investors should therefore focus on companies where earnings visibility, management quality and capital allocation support a strong investment case, while remaining selective elsewhere. We remain overweight SA equities but expect stock selection rather than simply owning the index to be the primary determinant of returns over the next 12 months.
DOMESTIC BONDS
The sharp rise in global bond yields was a defining feature of fixed-income markets during 3Q26. US 10-year Treasury yields rose by c. 90 bps, while French OATs and German Bunds sold off by around 110 bps and 70 bps, respectively. Against this backdrop, SA government bonds (SAGBs) proved resilient, with the 10-year yield rising by only around 40 bps over the quarter, as the FTSE/JSE All Bond Index (ALBI) total return declined by 66 bps. Elevated commodity prices, a resilient rand and an improving domestic macroeconomic backdrop helped insulate the local bond market from the full extent of the global bond rout.
The Iran war has undoubtedly interrupted the rally in SAGBs seen through 2025 and early 2026 and is likely to keep volatility elevated in the near term. However, we do not believe it has fundamentally altered the bull case for local bonds. The resilience of SAGBs through an exceptionally challenging global rates environment reinforces our constructive view. SA’s fiscal and external position continues to improve, while nominal yields remain attractive. We therefore continue to see value in SAGBs, particularly at the long end of the curve.
The improvement in SA’s macroeconomic backdrop remains a key driver of local bond yields. National Treasury’s latest budget data point to a growing primary surplus, while a broader tax base, improved tax collection, and continued fiscal consolidation are supporting the government’s debt trajectory. Elevated commodity prices are also benefitting SA’s external position through stronger trade and current-account balances, providing an additional buffer against global market volatility.
On the growth side, long-standing structural constraints related to electricity and logistics have also eased. These improvements are increasingly being recognised by credit rating agencies. S&P Global upgraded SA’s sovereign rating in November 2025, while Moody’s revised its outlook to positive in May 2026, citing improvements in fiscal management and structural reforms. The prospect of further upgrades in 2027 remains. Collectively, these developments strengthen the fundamental case for a gradual reduction in the risk premium embedded in SAGBs. However, low economic growth and the still-high government debt burden remain important constraints.
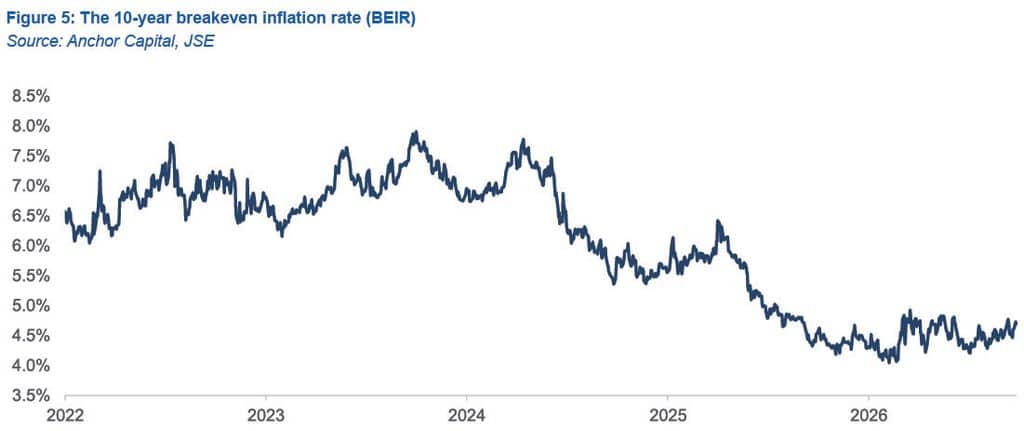
Despite these improving fundamentals, market pricing continues to reflect a significant degree of caution. Figure 5 shows that the 10-year breakeven inflation rate is currently around 4.7%, back near levels reached at the peak of the Iran war and about 70 bps above pre-conflict levels. At the same time, the SARB policy rate is expected to peak at 7.75%. With the SARB currently expecting inflation to return to around 3% in late 2027, we believe a meaningful risk premium remains embedded in the local nominal yield curve. The SARB has, however, highlighted upside risks to inflation, particularly from higher fuel prices and elevated services inflation, and market-based inflation expectations have recently increased.
The global rates environment has been a major headwind for SAGBs, but it could also become an important source of upside. Markets continue to price a relatively hawkish path for US monetary policy, which we believe overstates the persistence of US inflation and the extent of further tightening ultimately required. In our view, recent firmness in US inflation has largely reflected temporary supply-side shocks rather than a renewed acceleration in underlying demand. US wage growth is moderating, services inflation is cooling, tariff effects are fading, and broader demand-driven inflationary pressures continue to ease. Importantly, we see limited evidence that recent supply shocks are generating meaningful second-round inflationary effects that would require a materially more restrictive monetary policy response.
As these temporary pressures fade, we expect US disinflation to re-emerge more clearly. This should progressively remove some of the rate hikes currently embedded in the US yield curve and place downward pressure on Treasury yields. Given the sensitivity of EM duration to global risk-free rates, lower US Treasury yields would provide an important capital-gain catalyst for SAGBs. A moderation in oil prices would reinforce this through both the inflation and external-balance channels.
Against this backdrop, we continue to favour the 10-25-year segment of the SAGB curve. The pronounced hump in the zero-coupon curve means this area offers an attractive combination of carry and rolldown. In our view, investors are being well compensated for taking duration risk, particularly given the improvement in local macroeconomic fundamentals.
The war has disrupted, rather than derailed, our constructive views on SAGBs. Domestic fundamentals continue to improve, while current yields retain a meaningful risk premium and the long end of the curve offers attractive carry and rolldown. With scope for global rate expectations to become less hawkish, we believe SAGBs offer an attractive combination of income and capital-appreciation potential.
We therefore continue to favour the 10-25-year segment of the curve and expect a 12-month total return of around 10%, translating into a real return of about 6%.
THE RAND
The rand started 2026 at R16.54/US$1, and on 1 October 2026 the local unit was trading at the same level. Given the cascade of geopolitical shocks seen across developed markets (DMs), particularly in the US, the rand’s resilience is notable. A decade ago, events as we have witnessed in 2026 could have easily resulted in the local currency depreciating by 10% or more. We believe that the rand’s resilience bears testament to the improvement in SA’s domestic fundamentals. No doubt higher gold, platinum and export commodity prices have provided meaningful support to both the currency and the fiscus. Overall, this has been a remarkably resilient year for the rand.
At Anchor Capital, we subscribe to a purchasing power parity (PPP) model to assess the long-term value of the rand. Over the past three years, the rand has been on a gradual recovery path from significantly oversold levels. This has been supported by a combination of a gradually weaker US dollar vs other currencies, improved terms of trade as the value of domestic exports increased globally, and a steady improvement in SA’s political and economic fundamentals. While this overall positive trend remains intact, the near-term environment is considerably more challenging due to heightened global geopolitical uncertainty, as can be seen in Figure 6. We also note that rising US interest rates, a stronger US dollar and weaker prices for some of our key export commodities could put further pressure on the currency. The gradual deterioration in SA’s terms of trade is an important risk to the rand’s near-term outlook.
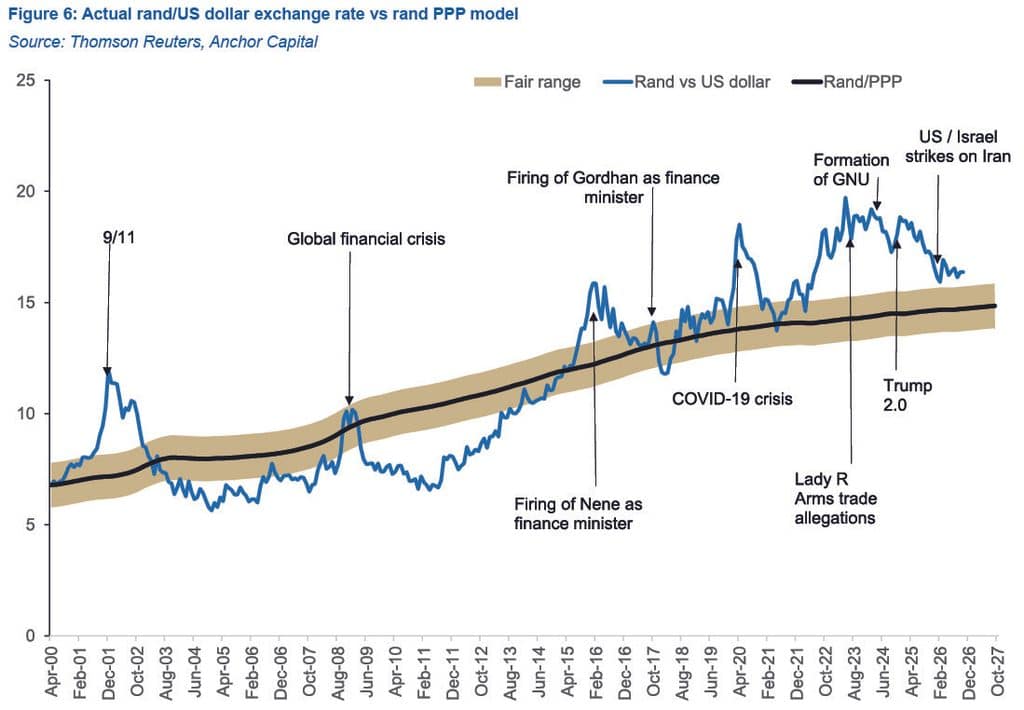
Forecasting the value of the rand in a year is a fool’s errand, as the local unit usually trades within a R2.00 range against the US dollar over 12 months. The risk of negative surprises to one’s view is particularly high in the current environment, and the rand could quite easily be weaker than R18.00/US$1 this time next year.
That said, if we look at this rationally and consider a scenario where the Iran war will probably end within the next year and some recovery is likely, we think that a level of around R16.00/US$1 appears reasonable. This scenario reflects a combination of continued improving domestic fundamentals, a potential rally as inflation declines and the likely higher risk premium applied to emerging markets (EMs) for some time after the eventual cessation of hostilities in the Middle East.
GLOBAL EQUITIES
We remain positive on global equities, although the investment case has become more nuanced over recent weeks as the range of potentially negative macro factors has amassed. Geopolitical instability, US domestic political questions, trade tensions, inflation, higher interest rates, elevated energy prices and the highest DM bond yields in 20 years have created a significantly more challenging macroeconomic backdrop. More than countering this, however, is that the AI growth story remains intact, US earnings growth expectations continue to rise, and the US economy is experiencing a once-in-a-generation economic boom.
The market has also remained resilient. With global equities having trended broadly sideways for several months, valuations have become cheaper. We expect global equities to deliver a 10% return over the next 12 months, as the bull market that began in 2023 continues.
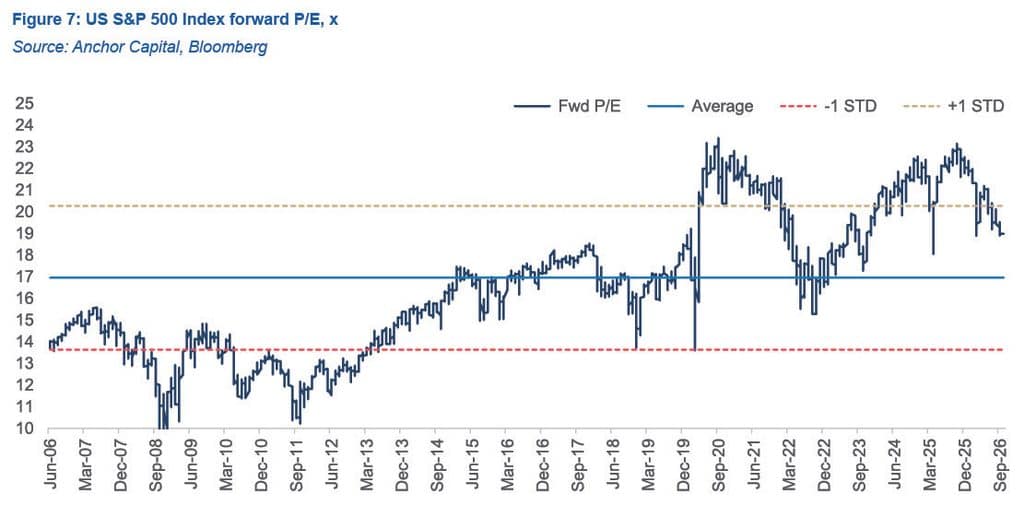
While the US S&P 500 return was positive in 3Q26, underlying share prices were under pressure in September, and the average share price was down a few percent. Shares driven by strong AI spend have done the heavy lifting this year, with a top 10 share like Meta, for example, up 27% in September as the market has become increasingly confident in the earnings potential of its AI investments. Perhaps more importantly, however, earnings growth and consumer spending remain supportive, while earnings expectations have continued to rise following a strong 2Q26 earnings season. At the beginning of 2026, earnings per share expectations for the S&P 500 for 2027 were USc350. These have since risen to USc420; a phenomenal increase giving rise to a 2027 forward P/E multiple of 18.5x (7750/420).
The graph below illustrates how the one-year forward P/E of the S&P 500 has declined from 23x to 19x, as earnings have grown by over 25% while the market has risen by just over 10%. The market remains expensive relative to its historical averages, but the earnings outlook remains powerful.
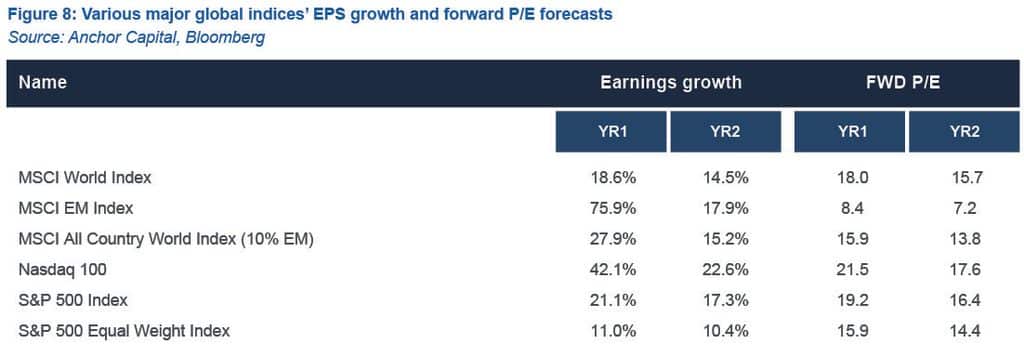
This is shown in tabular format below. Year-2 earnings growth prospects look strong across the board, while the equal-weighted forward P/E of 15.9x is now below the 20-year mean (this basically excludes the impact of the higher P/E, bigger-cap, largely AI shares).
The principal risk to this outlook is the continuation and escalation of the Middle East war and its impact on oil prices and inflation. The rise in energy prices has not flowed through materially into core inflation (still around 2.5% in the US), but the longer the disruption continues, the greater the risk that secondary inflationary effects emerge. This has started to reflect in surging bond yields, which have been exacerbated by the demand for credit from governments and companies (particularly AI financing) and growing concerns about the balance sheets of developed countries. Sustained higher interest rates and inflation make future cash flows worth less, and the risk of this starting to suppress equity valuations is increasing.
We think it is significant that when the US Fed announced a 25-bpt hike in interest rates at its September meeting, it also upgraded GDP forecasts to 2.4% for this year and next. This expressed confidence that the US economy could stomach interest rate rises and higher input costs and still thrive. It is worth reflecting on the potential bull case for a moment. If somehow the Iran war subsides, oil prices normalise towards US$60/bbl, inflation moderates, and interest rates peak and eventually decline towards 3.5%, the combination of macroeconomic stabilisation and AI-driven productivity gains materialising from the mammoth spend could provide renewed support for equity markets. Importantly, the current oil shock is primarily a logistical and geopolitical disruption rather than an underlying supply/demand imbalance.
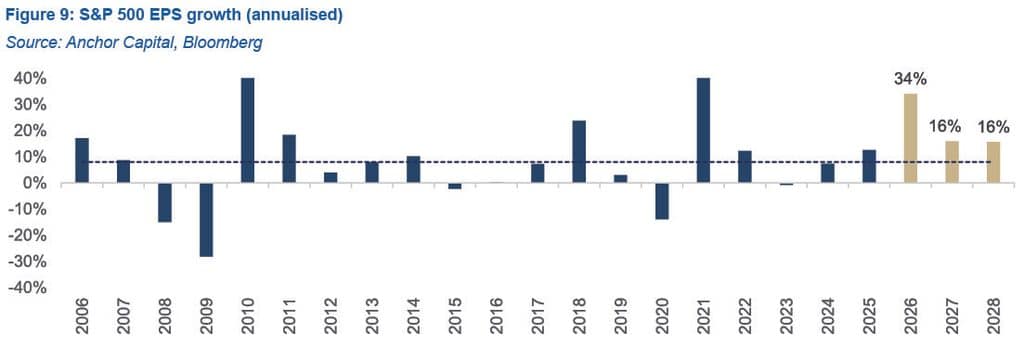
The graph below shows why the market is looking through the dark clouds – 16% earnings growth in 2027 and 2028 following this year’s massive 32% rise. On these forecasts, the average US company will have doubled its earnings from 2023 to 2028, and the resultant equity market performance and dividend flows have added further fuel to the sustained rally. Some scepticism has started to creep into markets in recent months, and consequently we are able to compile a portfolio of shares which offer excellent value relative to their earnings.
We are therefore diversifying our exposure beyond the popular AI drivers into companies that benefit from the positive climate or are being overlooked. It is worth noting that the AI-related capital expenditure in the US (now projected to exceed US$1trn in 2027) is mostly impacting the builders and related industries (chips, energy, infrastructure, etc.). The second-order effects of AI (productivity, technological advances and medical discoveries) will only be materially felt 12 months out and beyond.
A critical scenario to monitor over the next six months is whether the buyers of AI capacity (dominated by Anthropic and OpenAI) will be able to afford to pay the builders of AI capacity (dominated by Microsoft, Amazon, Alphabet and SpaceX). AI data centres have been built on the back of long-term contracts, and to deliver on these, the revenues of Anthropic and OpenAI have to continue to rise on their current explosive trajectory. This will enable them to list and access further funding from capital markets (debt and equity). If this pans out, there is still plenty of upside in the AI complex whose valuations are far from crazy.
Next up is the anticipated Anthropic US$2trn listing in November. Second-quarter earnings announcements also showed positive indications for the return on investment for the hyperscalers. Computing capacity is lagging increasing demand, and clearly they can charge prices which translate into attractive incremental returns.
EMs remain where some of the most compelling valuations can be found. Still, these markets have flattered to deceive for the past two decades, and we prefer to take our exposures through compelling individual company stories, of which there are many we have identified. EM indices are also increasingly concentrated in a small number of AI builders (TSMC, SK Hynix, Samsung, etc.).
The graph below shows the steady pace of world economic growth, which is the stage on which equity markets perform.
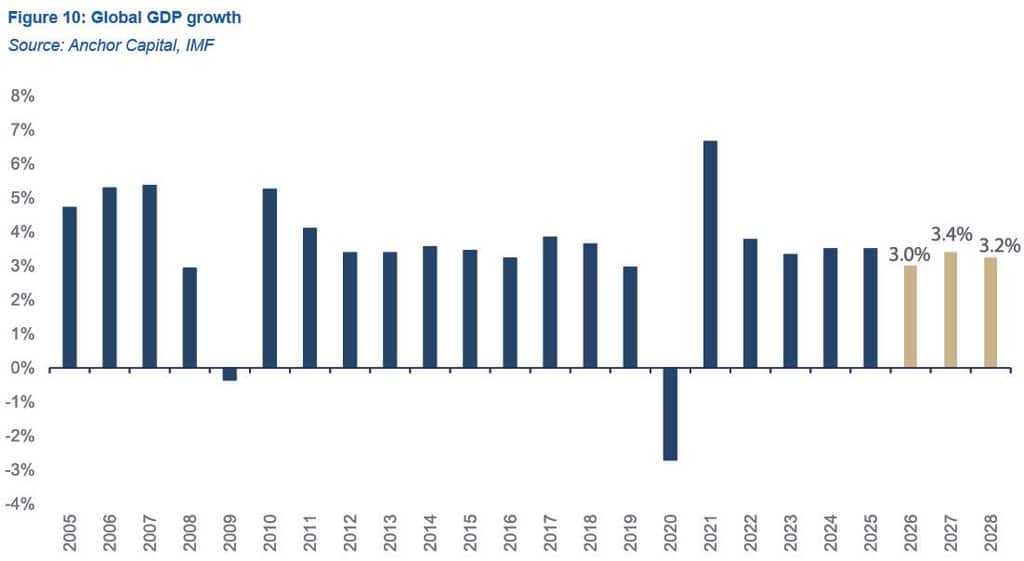
Growth outside of the US is more challenging. The euro region appears particularly vulnerable, given its reliance on imported energy and the potential for persistently higher energy prices to weigh on both inflation and economic activity. EMs were gaining favour in the more supportive pre-war, risk-on global mood before the escalation of the Middle East conflict, but this is likely to be somewhat moderated, and a higher risk premium demanded.
GLOBAL BONDS
Equity investors rarely pay close attention to bond markets, but occasionally large movements in bond yields have caught their attention. The most notable examples of the past two decades include announcements from then-Fed Chair Ben Bernanke between 2008 and 2011 around quantitative easing (QE) that saw the Fed buy US$2trn of US government debt. This helped cut the US government’s 10-year borrowing rate in half (from 4% p.a. to 2% p.a.) and made equity investors pay attention. Then there was the “Taper Tantrum” in May 2013, when Bernanke signalled that the Fed was considering selling some of the trillions of dollars of US government bonds it bought. That spiked the US 10-year borrowing rate from 2% to 3% (albeit that it did not stay there long, falling back to c. 2% over the months that followed).
The bond market again became a key focus for equity investors in 2022, when US inflation, which had been hovering around 2% for the better part of the previous two or three decades, sparked to life, climbing above 6%. COVID-19-induced supply chain bottlenecks, together with spiking energy and food prices caused by Russia’s war on Ukraine, drove a rapid repricing of interest-rate expectations. The US government’s 10-year borrowing rate had started that year at 1.5% p.a. and ended the year close to 4% p.a., resulting in the worst bond market performance in at least 40 years.
Since then, the US 10-year yield has generally traded within a relatively narrow range of 4% to 4.5% p.a. This changed in recent months, however, with the yield rising from around 4% p.a. to 5.3%. This is the highest level since 2002 and has once again brought the bond market firmly into focus for equity investors.
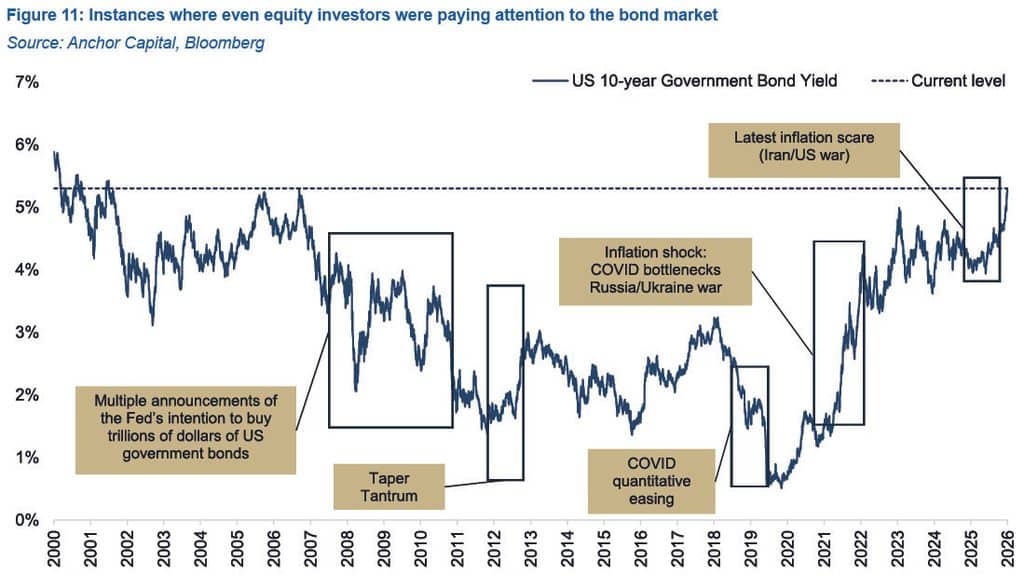
We believe that most of the recent spike higher in bond yields can be traced back to higher oil prices and investors’ expectations that the Fed will need to step in with multiple rate hikes.
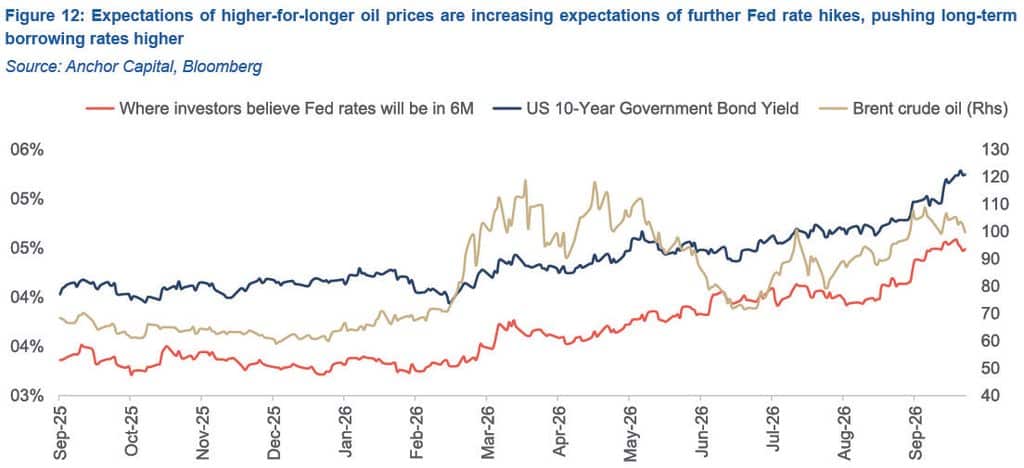
In fact, as it stands, investors are pricing in that the Fed will need to hike cash rates to 4.6% p.a. by the middle of next year.
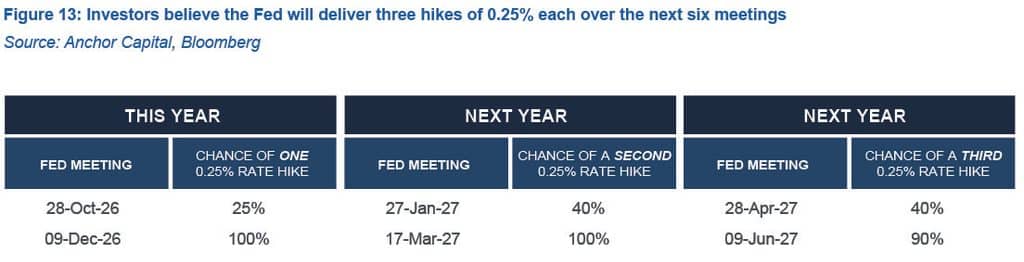
We believe that energy prices will remain elevated (and probably volatile) over the next few months. However, there is every chance we will get a meaningful resumption of oil flows through the Strait of Hormuz, or at the very least some material workarounds within our twelve-month forecast horizon. Even if this proves overly optimistic, for energy prices to remain an inflationary force beyond March next year (the one-year anniversary of the start of the war), oil prices would need to continue climbing from current levels, which we believe is unlikely.
Consequently, even if the three currently anticipated Fed rate hikes materialise by the middle of next year, it is likely that a year from now investors will begin pricing in some rate cuts. This would relieve some of the pressure on bond yields.
With current bond yields already elevated, the math behind bond returns sets investors up for an asymmetrical return outcome over the next twelve months (skewed towards positive outcomes). In fact, even in an almost inconceivably bearish scenario where the US government’s 10-year borrowing rate is 7% p.a. a year from now, an investor holding that 10-year US government bond over the 12-month period would only experience a loss of slightly more than 5% on their investment. If US government bond yields are back at 2.5% p.a. twelve months hence (where they spent most of their time hovering around for the decade before 2022), investors in that bond would earn a total return of over 30% over the next year.
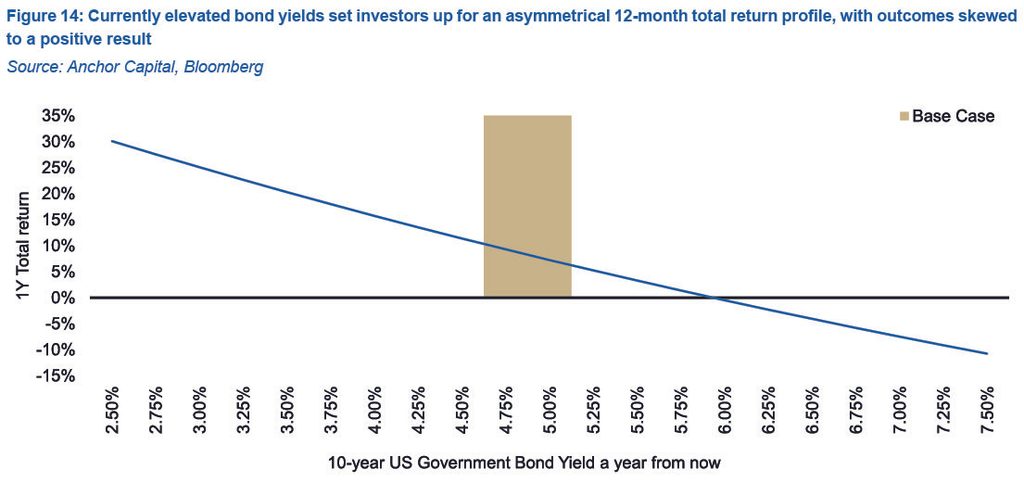
Our base case outcome is that the US government’s 10-year borrowing rate will be around 5% p.a. a year from now, delivering investors a 7% total return over the next twelve months.
Investors in US investment-grade corporate bonds are starting with an even more compelling yield of c. 6% p.a., though the premium they earn for the additional credit risk is still at very depressed levels.
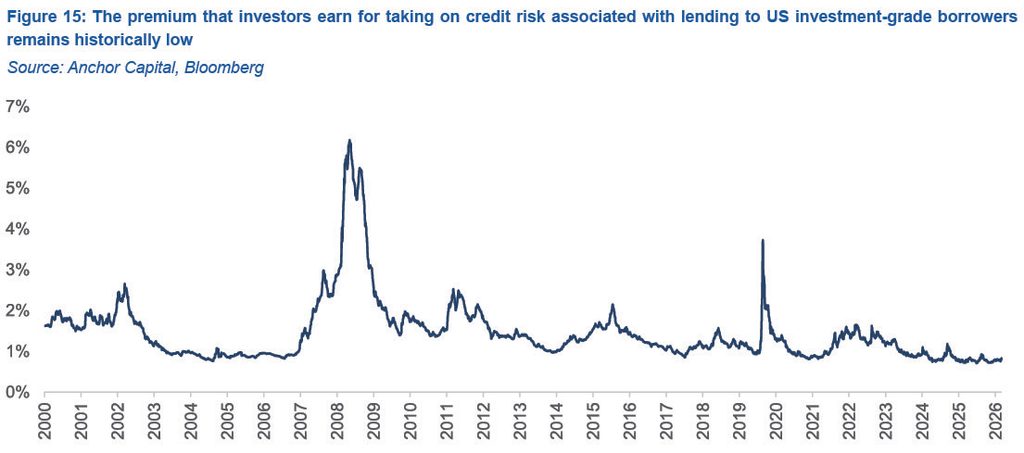
We expect credit spreads to drift higher as lenders demand greater compensation for the increased risk of defaults as borrowing rates rise. That widening credit spread is likely to offset the impact of falling government bond yields to leave investors in high-grade corporate bonds with a similar outcome to that of US government bond investors (a 7% total return over the next twelve months).
GLOBAL PROPERTY
DM real estate investment trusts (REITs) have delivered a lacklustre performance in 2026, with the FTSE/EPRA/NARIET DM Property Index up 3.8% YTD, following a particularly tough 3Q26, when the index declined 6% QoQ. Rising bond yields ushered in the prospect of increased finance costs, while simultaneously making the asset class’s dividend yields appear relatively less attractive.
The recent mediocre performance of REITs is part of a much longer period of underperformance, extending back well before 2026. Over the past 15 years, covering most of the post-global financial crisis (GFC) period, global REITs have delivered only half the annualised return of global equities (MSCI World +13.1% p.a. compared with the FTSE/EPRA/NARIET DM Property Index return of 6.6% p.a.). Equity markets have been boosted by material growth tailwinds, many from technological innovation, which have created structural headwinds for some of the major commercial property sectors. Importantly, over that extended period of relative underperformance, investors have not been rewarded with lower volatility. In fact, for the past 15 years, REIT volatility exceeded that of global equities (MSCI World +14.2% p.a., FTSE/EPRA/NARIET DM Property Index +15.1%p.a.).
REIT bulls had perhaps hoped that the step change in rates in 2022, when bond yields more than doubled, was perhaps the last stage of the de-rating for the sector, which has been battling various structural headwinds from shifts in shopping behaviour to trend towards work-from-home. Unfortunately, the latest spike higher in rates has catalysed another period of tough performance for listed property. Despite this most recent underperformance, REITs have not yet become sufficiently attractive on a yield basis relative to other asset classes.
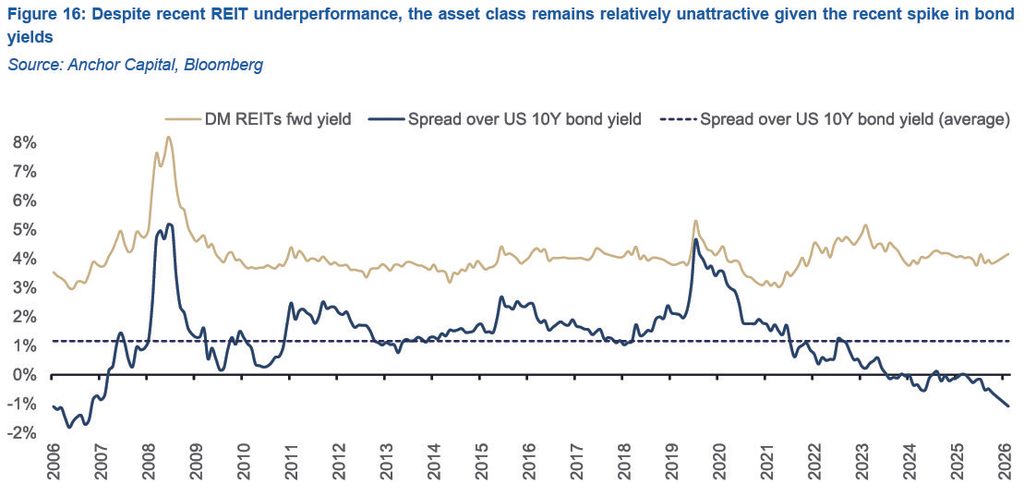
Two factors are skewing the aggregate yield of the asset class at the index level. The first is index heavyweight Welltower, the healthcare REIT that now represents 10% of the US REIT index. It is trading on a depressed forward dividend yield of only 1.5% p.a., reflecting the phenomenal growth achieved by management following investments made at the height of COVID-19 pessimism, when everyone else was dumping assets in the sector.
The second is the data-centre sector, which now accounts for around one-eighth of US REIT market cap and is trading on a 2.4% forward yield based on expectations for exceptional growth related to AI.
Together, these two factors are shaving around 0.6% p.a. off the overall index yield. However, even after adjusting for that, REIT forward yields are still trading comfortably below bond yields.
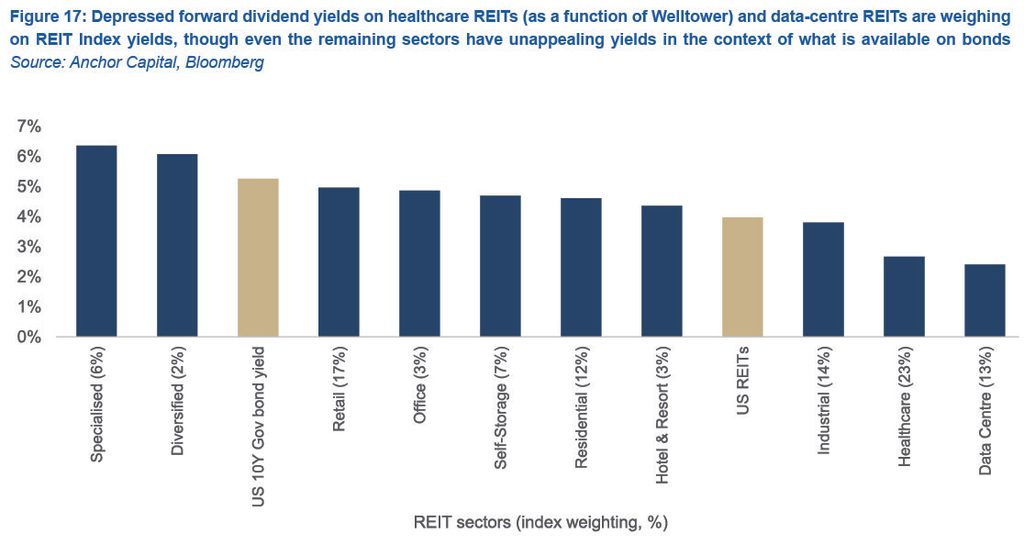
Considering our expectation that US 10-year bond yields are likely to find a new level of around 5% p.a., we think there is scope for further de-rating in the asset class to make the forward dividend yields more attractive on a relative basis. Nevertheless, combining that de-rating with the current dividend yield and growth expectations, we anticipate the combination should deliver a 7% p.a. total return over the next twelve months.