The US/Israel alliance’s 28 February strikes on Iran, interpreted by some observers as being influenced by political considerations rather than purely strategic necessity, triggered what the International Energy Agency (IEA) has described as the largest supply disruption in the history of the global oil market. The consequences were swift and severe. In the aftermath of the initial strikes, the military conflict escalated rapidly with retaliatory attacks, and Iran declared that the Strait of Hormuz was effectively closed. This development, alongside the ongoing risk of disruption to Gulf energy infrastructure, materially altered investor expectations. Global equity markets responded accordingly, selling off sharply and ending a challenging March in negative territory (MSCI World -6.3% MoM/-3.5% YTD/+19.4% YoY) as geopolitical risk premia rose and the macroeconomic outlook became far more uncertain.
Before the escalation, Brent crude had been trading at c. US$67/bbl, reflecting relatively balanced supply conditions and subdued global demand. Within hours of the strikes, investors started to price in the risk of disruption to the Strait of Hormuz through which c. one-fifth of global oil supply passes daily. A slew of tit-for-tat actions and statements followed, including US President Donald Trump issuing Iran an ultimatum to reopen the Strait within 48 hours or risk having its power plants bombed (Trump later backpedalled), with Iran threatening to ‘completely’ close the corridor if attacked. The shock has seen global growth forecasts dragged lower, inflation fears and central banks rethinking rate-cut timelines just as economies were beginning to stabilise (while, of course, recognising the high humanitarian cost of the crisis, including thousands of civilian casualties).
Major US indices slid into correction territory, closing March meaningfully lower despite a sharp rally on 31 March. The catalyst: reports that the war could soon come to an end after Trump told reporters that he expects the US military to leave Iran in “two or three weeks” and a statement from Iranian President Masoud Pezeshkian signalling Iran’s willingness to end the war but seeking guarantees. Still, the S&P 500 ended March down 5.1% (-4.6% YTD/1Q26; +17.8% YoY), its worst monthly performance since 2022, while the Nasdaq fell 4.8% MoM (-7.1% YTD/1Q26; +24.0% YoY) and the Dow snapped its 10-month winning streak, dropping by 5.4% (-3.6% YTD/1Q26; +10.3% YoY).
At its March meeting, the US Federal Reserve (Fed) kept rates on hold (as expected), noting the “uncertain” impact on the US economy from the US-Israel war with Iran. US macroeconomic data were mixed. February headline inflation was unchanged from January at 2.4% YoY (+0.3% MoM), while core inflation, which strips out volatile food and energy prices, remained at 2.5% YoY (+0.2% MoM). US 4Q25 GDP growth was revised lower in March to a seasonally and inflation-adjusted annual rate of just 0.7%. This first GDP revision was a sharp step down from the previous estimate of 1.4%. January’s core personal consumption expenditure (PCE), excluding food and energy, the Fed’s preferred inflation gauge, climbed 3.1% YoY, up from December’s 3.0%.
Europe’s energy vulnerability saw European equity markets recording a brutal month (their worst monthly performance in six years) as the outbreak of the crisis sparked heavy selling pressure across the continent’s markets. The Euro Stoxx 50 Index fell 9.1% MoM (-3.5% YTD/1Q26; +9.5% YoY), ending eight consecutive months of advances. France’s CAC plummeted 8.9% MoM (-4.1% YTD/1Q26; +3.7% YoY), and Germany’s DAX fell10.3% MoM (-7.4% YTD/1Q26; +2.3% YoY). On the data front, eurozone inflation rose unexpectedly, printing at 1.9% in February from 1.7% in January.
UK equity markets were relatively resilient considering the carnage in Europe, with the FTSE 100 down 6.2% MoM (+3.4% YTD/1Q26; +22.6% YoY). The FTSE 100 has a commodity-leaning structure, deriving around 15% of its total market cap from energy companies and effectively benefitting from an energy shock inflicting damage elsewhere. The UK economy barely expanded in 4Q25, with the second GDP estimate confirming growth of only 0.1%, unchanged from 3Q25. February inflation remained at 3.0% YoY, in line with expectations and unchanged from January’s print, but still above the Bank of England’s (BoE) 2% target. Core inflation stood at 3.2% YoY from January’s 3.1%.
China’s equity markets also proved more defensive as the country has been aggressively building domestic renewable energy capacity, reducing dependence on oil from the Middle East. It also sources much of its oil from Russia via pipelines and is thus not subject to Strait of Hormuz disruption. Still, the major indices ended in the red with the Shanghai Composite down 6.5% MoM (-1.9% YTD/1Q26; +19.7% YoY), while Hong Kong’s Hang Seng declined by 6.9% MoM (-3.3% YTD/1Q26; +10.7% YoY). China’s March manufacturing activity expanded at its fastest rate in 12 months following two months of declines. The official manufacturing PMI rose to 50.4 vs February’s 49.0. Non-manufacturing PMI, which includes services and construction, rose to 50.1 from 49.5 in February. The 50-point mark separates expansion from contraction.
Being one of the world’s most oil-import-dependent major economies, Japan’s benchmark Nikkei was hard hit, falling 13.2% in March (+1.4% YTD/1Q26; +45.8% YoY). At its March meeting, the Bank of Japan (BoJ) left rates unchanged but kept the door open for a hike in April. Japan headline inflation fell to 1.3% in February vs January’s 1.5% – weaker than expected and remaining below the BoJ’s target.
By far the most dramatic single-commodity story of March was the oil price. In early March, Brent crude (+63.3% MoM; +94.5% YTD/1Q26; +58.3% YoY) had soared above US$100/bbl, the first time at that level since Russia invaded Ukraine in February 2022. At one point in March, it reached an intraday spike of c. US$129/bbl before ending the month at US$118.35/bbl. Other commodities came under pressure amid heightened geopolitical tension as investors became increasingly risk-averse over the US/Israel/Iran war. The oil shock, which resulted in inflation fears and markets pricing in higher-for-longer rates, saw gold, a non-yielding asset, becoming less attractive as a firmer US dollar and rising bond yields proved more alluring to investors than the traditional safe-haven assets. After its spectacular run the gold price fell 11.6% MoM (+8.1% YTD/1Q26; +49.4% YoY), while platinum group metals (PGMs) also recorded big MoM drops – platinum was down 17.5% MoM (-5.2% YTD/1Q26; +95.8% YoY), palladium -17.2% (-8.6% YTD/1Q26; +49.4% YoY), and rhodium -14.8% MoM (+10.1% YTD/1Q26; +77.2% YoY). The PGMs came under structural pressure from EV adoption, eating into autocatalyst demand in light of soaring oil prices.
Against this backdrop, the JSE delivered its worst monthly performance in c. 18 years, driven by the confluence of a falling gold price, a weak rand, the possibility of rate hikes and a global energy shock that buoyed coal stocks but hammered everything else. The FTSE JSE All Share Index (ALSI) plummeted c. 11.2% MoM (-1.5% YTD/1Q26; +28.7% YoY), ending twelve consecutive months of gains. The rand weakened 5.9% MoM (-2.2% YTD/1Q26; +8.2% YoY) against the greenback. It was red across the board with resources the worst performers, Resi-10 -17.8% MoM (+5.5% YTD/1Q26; +90.1% YoY), followed by the SA Listed Property Index, which was down 11.8% MoM (-5.4% YTD/1Q26; +21.2% YoY). Financials also declined (Fini-15 -10.3% MoM;-0.9% YTD/1Q26; +21.8% YoY), as did industrials (Indi-25 -5.4% MoM; -9.3% YTD/1Q26; +2.1% YoY).
SA headline inflation slowed for a second consecutive month, easing to 3.0% in February vs January’s 3.5% print. MoM, headline inflation rose 0.4%. Core inflation, excluding the volatile food and non-alcoholic beverages, fuel and energy categories, moderated to 3.0% YoY (+0.7% MoM) from 3.4% in January, marking its lowest point since 2021, and a broad-based easing in underlying price pressures. The latest print aligns with the South African Reserve Bank’s (SARB) newly adopted inflation target of 3%. Still, February data represents a “before” snapshot, captured prior to the escalation in global geopolitical tensions.
The military action in the Middle East has introduced significant upside risk should disruptions persist, prompting a more cautious, “higher-for-longer” stance from the Monetary Policy Committee (MPC) at its meeting in March. In this environment, the MPC opted to hold the repo rate at 6.75% (prime at 10.25%).
Figure 1: The 20 best-performing shares in March 2026, MoM % change
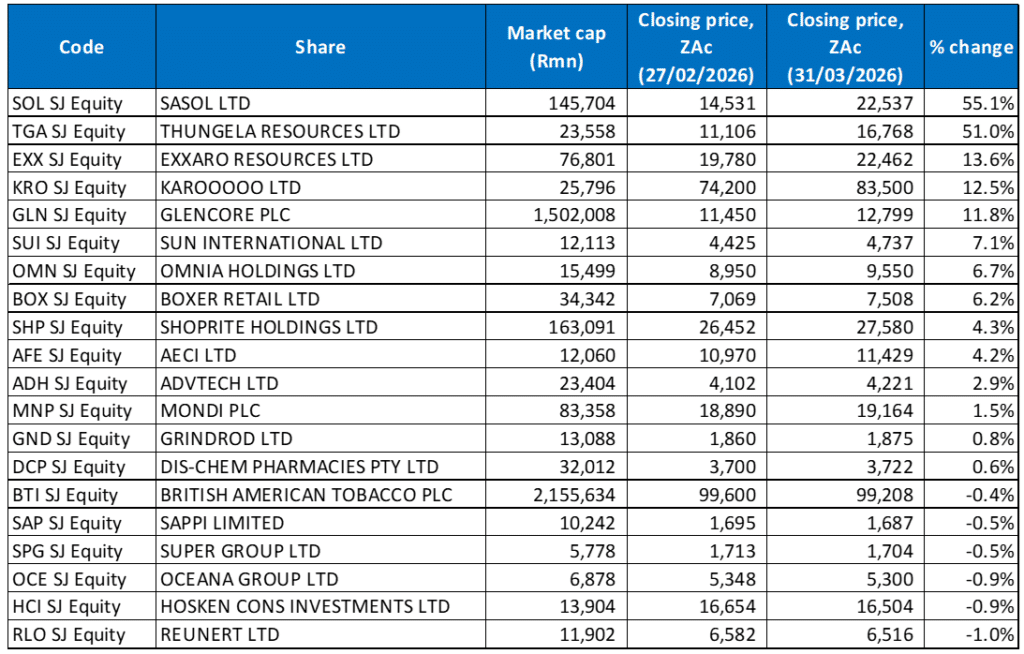
Source: Bloomberg, Anchor Capital
The best performers last month were those companies that either produced what suddenly became more expensive (energy – oil) or which sold essential items, such as food retailers. Sasol was the leading beneficiary of the geopolitical shock and soaring oil prices, with its share price surging by 55.1% MoM; it was March’s best-performing share. The higher global fuel prices directly benefitted the Group’s synthetic fuels and chemicals margins.
Despite reporting a full-year loss of R7.1bn (resulting in an R8.8bn asset impairment) and its headline earnings per share (HEPS) falling by 125% YoY to R6.47, coal miner Thungela Resources was the month’s second-best performer (+51.0% MoM). Europe stepped up its use of coal for power as gas prices soared and supply became erratic following Iran’s closure of the Strait, resulting in a sharp rise in coal prices (up c. 20% vs pre-war), and strengthening demand. Ironically, Thungela was punished for most of 2025 as the world moved away from coal, only to be rescued by Europe’s scramble back to coal in the wake of the Middle East standoff.
At a distant third was Exxaro Resources with a 13.6% MoM advance. Like Thungela, the coal price tailwind boosted Exxaro’s share price while the company reported solid results with a 3% YoY rise in revenue to R41.8bn and an 8% YoY increase in HEPS to R32.47. The Group also guided to coal exports of up to 8mn tonnes this year vs 7.1mn tonnes in 2025. Thungela CEO Ben Magara said that its next growth phase is anchored in a diversified portfolio combining a strong coal base with expansion into manganese (it completed its acquisition of a majority stake in Tshipi é Ntle Manganese Mining in late February), renewable energy and select exploration projects.
Exxaro was followed by Karooooo Ltd, Glencore Plc and Sun International with MoM gains of 12.5%, 11.8%, and 7.1%, respectively. Cartrack, which Karooooo owns, said last month that it had surpassed 2mn active subscribers in SA, a significant milestone after 20 years in operation. Meanwhile, Glencore had two tailwinds – higher coal prices from Iran-related tensions and reports that a merger with Rio Tinto could still be on the cards. Sun International’s share price soared after it reported solid FY25 results with revenue up 3% YoY to c. R13bn and HEPS rising by 38.7% YoY. It also declared a special dividend of ZAc100/share, resulting in its total dividend increasing by 6.5% YoY.
Chemicals and fertilisers Group, Omnia Holdings (+6.7% MoM), released disappointing interim results in March with a 12% YoY decline in HEPS to ZAc452, reflecting lower mining explosives volumes and softer fertiliser pricing. However, from the start of the conflict to 20 March, fertiliser prices have increased by c. 40% with the Strait’s blockage disrupting around 50% of global urea and sulphur exports and 20% of global liquefied natural gas (LNG), a key feedstock for nitrogen fertilisers. This, together with the commodity boom, has resulted in a simultaneous boost for Omnia’s core product lines.
Rounding out March’s best performing shares were Boxer Retail, Shoprite Holdings and AECI Ltd with MoM gains of 6.2%, 4.3%, and 4.2%, respectively. Boxer released its 48-week trading update last month, which showed turnover increasing by 11.9% while it continued to gain market share over the period. The retailer’s deep-value positioning seems to fit nicely with SA’s constrained consumer environment. Shoprite reported strong 1H26 results, continuing its consistent track record of market share gains within the local food retail sector. Group revenue rose by c. 7% YoY to R139bn, while HEPS advanced by 8% YoY. The retailer continues to dominate the domestic retail market, reporting that its sales growth is 2.3 times faster than the “rest of the market”. It has now delivered six consecutive years of market share gains, reinforcing its leadership position in the SA food retail market.
Finally, AECI’s share price rise was driven almost entirely by its impressive FY25 results released in late February. The mining and chemicals multinational reported revenue of R32.1bn, which was down 4% YoY; however, it achieved record earnings before interest, taxes, depreciation and amortisation (EBITDA) of R3.4bn and improved its EBITDA margin to 11% from 9% in FY24. HEPS soared by 53% YoY to ZAc1,098. Much like Omnia, it also had an indirect energy crisis tailwind through its mining explosives segment, as coal, gold and other commodity producers ramp up activity.
Figure 2: The 20 worst-performing shares in March 2026, MoM % change
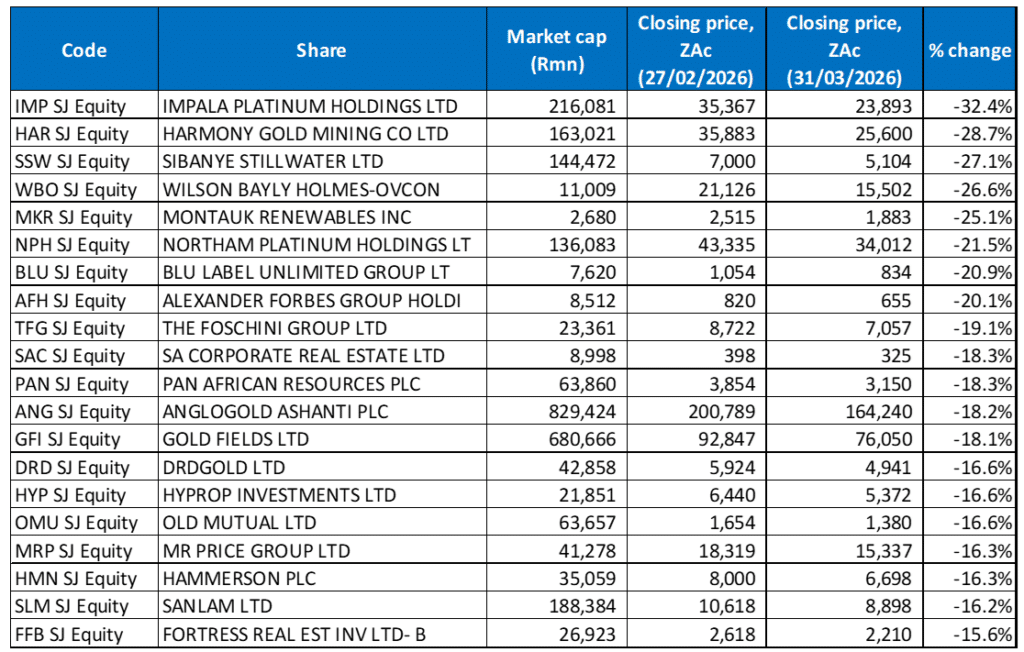
Source: Bloomberg, Anchor Capital
On the downside, nearly half of the twenty worst-performing shares came from the mining sector as gold and platinum stocks fell sharply because of what the Middle East conflict means for inflation expectations and interest rate pricing, which has, in turn, weighed heavily on gold and PGM prices. Impala Platinum (Implats; -32.4% MoM) was March’s worst performer, hammered by platinum’s c. US$1,000/oz collapse, after having peaked at c. US$2,925/oz in January 2026 before retreating sharply to end last month at US$1,953.65/oz (-17.5% MoM). The Implats CEO has also expressed caution regarding new mining projects, citing long-term demand uncertainties linked to electric vehicles (EVs), which have amplified investor anxiety around the outlook for PGMs. Still, the business itself is delivering, but the commodity market and broader environment have weighed on sentiment.
Implats was followed by Harmony Gold and Sibanye Stillwater with MoM losses of 28.7% and 27.1%, respectively. Harmony is a pure gold mining play, and its exposure to the gold price has resulted in a severe drawdown in price – gold is down c. 25% from its January all-time high of US$5,595. Unlike some gold miners that have commodity diversification, Harmony has none. Sibanye, meanwhile, is unique in its exposure to gold and PGMs, both assets which recorded significant selloffs in March.
Wilson Bayly Holmes Ovcon (WBHO) was down 26.6% MoM due to a combination of company-specific earnings disappointment and macro headwinds. The share price plunged 16% on 3 March after WBHO reported flat FY25 earnings, as its building operations suffered from a big drop in activity in Gauteng and lower mining-related civil engineering work. Revenue fell by 4% YoY to R14bn, and HEPS came in at ZAc1,086 from ZAc1,072 in FY24. Added to that, structural headwinds that the energy shock made worse, and a weaker rand, which will increase the cost of imported materials and equipment, also weighed on the share price.
WBHO was followed by Montauk Renewables, Northam Platinum, Blu Label Unlimited Group and Alexander Forbes with MoM losses of 25.1%, 21.5%, 20.9%, and 20.1%, respectively. Montauk, which specialises in the management, recovery and conversion of biogas into renewable natural gas, reported disappointing FY25 results, showing revenue coming in essentially flat at US$176.4mn. At the same time, EBITDA declined by 21% YoY and headline earnings fell 60.4% YoY. A 25% drop in average realised Renewable Identification Numbers (RIN) pricing to US$2.33 hit its profitability despite stronger natural gas index pricing and higher RIN volumes sold. Like Sibanye and Implats, Northam was impacted by weak PGM prices and a difficult external backdrop in addition to rising costs despite strong operational results.
Blu Label seems to be a victim of headline confusion more than operational failure. In its results for the six months ended 30 November 2025, the company reported a net loss of R5.2bn, which was largely due to accounting treatments following the listing of Cell C on 27 November 2025, which triggered a non-cash disposal loss on Blu Label’s books. When stripped out, the underlying business delivered R389mn net profit, R535mn EBITDA, and ZAc44 core HEPS. Alexander Forbes fell on the back of a broad and indiscriminate financial sector selling in March and was also in the crossfire of the macro forces that defined the JSE last month, including a hawkish rate shift.
The Foschini Group (TFG; -19.1% MoM) and SA Corporate Real Estate (-18.3% MoM) rounded out March’s worst-performing shares. TFG widened its FY26 profit warning (released in February) in March, telling shareholders that both EPS and HEPS are now expected to drop by 20%-plus as weak consumer conditions in the UK, Australia and SA continue to weigh on results.
Figure 3: The 20 best-performing shares YTD, % change
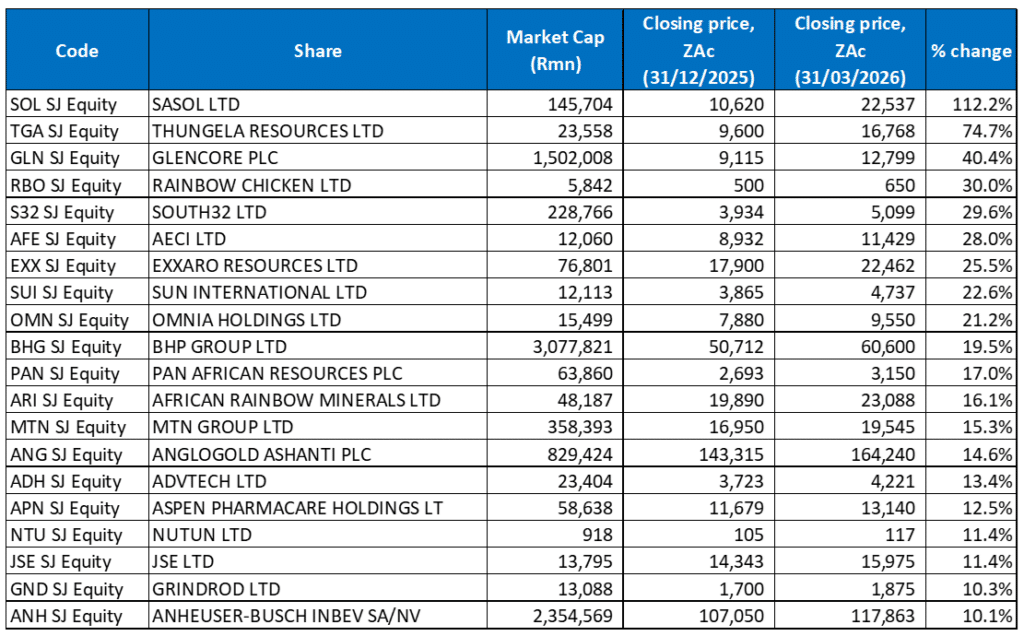
Source: Bloomberg, Anchor Capital
YTD/1Q26, JSE-listed equities’ performances were quite different from the year to end February, as gold and PGM shares were pushed out for the most part following a turbulent March. Twelve of the 20 best-performing shares YTD were unchanged from last month, with a significant overlap with March’s best-performing shares. While global markets reeled from the Middle East conflict energy shock, a select group of JSE-listed shares turned the geopolitical chaos into impressive shareholder returns. The common thread across the top performers: energy, commodities, and companies that sell things people cannot stop buying, regardless of geopolitics.
Leading the charge was Sasol (discussed earlier), surging 112.2% YTD, and the standout beneficiary of Brent crude’s historic 64% March gain. The higher oil prices flow almost directly into Sasol’s synthetic fuels margins, making it the purest JSE-listed energy play.
Sasol was followed by Thungela Resources (+74.7% YTD) with a remarkable reversal for a coal miner that entered 2026 carrying a full-year loss. The Strait of Hormuz blockade has forced Europe to pivot back to coal as LNG supply comes under pressure, sending thermal coal prices soaring to a seventeen-month high and rescuing Thungela’s fortunes.
In third place, Glencore (+40.4% YTD) benefitted from the same coal tailwind through its commodity trading and mining operations.
Rainbow Chicken, South32 Ltd, AECI and Exxaro Resources are up 30.0%, 29.6%, 28.0% and 25.5% YTD, respectively. South 32, AECI and Exxaro all captured different facets of the commodity and energy price surge. Exxaro’s diversified coal and manganese portfolio, combined with improving Transnet rail performance and strong full-year results, has made it one of the more compelling earnings stories YTD.
Sun International (+22.6% YTD), Omnia Holdings (+21.2% YTD) and BHP Group (+19.5% YTD) rounded out the YTD ten best-performing shares. Sun International’s gains have been as a result of a strong earnings surprise powered by SunBet’s explosive digital growth. Meanwhile, Omnia has benefitted from a 40% global fertiliser price surge on the back of the Hormuz supply route blockade.
Figure 4: The 20 worst-performing shares YTD, % change
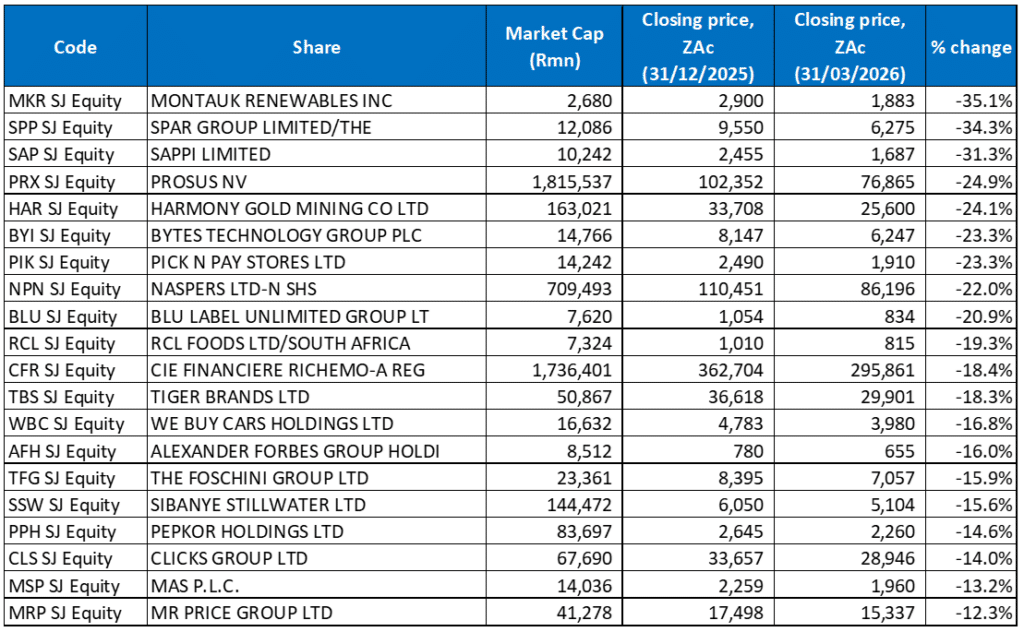
Source: Bloomberg, Anchor Capital
While coal miners and energy stocks celebrated, other cohorts of JSE-listed shares were down significantly YTD, caught between falling commodity prices, a weak consumer environment, and a geopolitical shock from which they were structurally unable to benefit. This diverse cross-section of companies is united by their exposure to either falling precious metals prices, weakening consumers, rising costs, or global growth fears.
Montauk led the losers YTD – down 35.1%. It was followed by SPAR (-34.3% YTD) and Sappi (-31.3% YTD). Spar has been weighed down by ongoing operational challenges following its troubled SAP system implementation and continued weakness in its European business. Consumer pressure across multiple geographies has compounded an already difficult turnaround story. Sappi has been under pressure for a while as its financial performance has deteriorated, with losses and margin pressure reflecting weaker global demand for its products and an oversupply in European paper markets.
Investment conglomerates Prosus (-24.9% YTD) and Naspers (-22.0% YTD) have suffered from a global technology reset, with their largest investment, Chinese tech giant Tencent, down 19% YTD.
Harmony Gold, Bytes Technology and Pick n Pay Stores are down 24.1%, 23.3% and 23.3% YTD. Harmony was hammered by the gold price’s near-25% pullback from its January all-time high, while Bytes has been caught in the broader technology sector de-rating as the possibility of rising rates reduced the appeal of growth stocks globally. Pick n Pay’s decline is more of a company-specific earnings issue, as it reported losses wider than previously guided, weak festive season trading, and fierce competition from Shoprite and Boxer, which has been eroding its market share at a time when the Group can least afford it.
Rounding out the YTD worst-performing shares were Blu Label Unlimited (discussed earlier; -20.9%) and RCL Foods (-19.3% YTD). RCL released disappointing interim results in March, largely due to a 49% YoY collapse in its sugar unit’s earnings. Revenue slipped 1.9% YoY to R13.3bn while HEPS from continuing operations fell 30.6% YoY to ZAc75.9. The poor interim results in a macro environment of rising input costs and weak consumer spending, as well as surging oil prices in the consumer staples bucket, where RCL falls, weighed on the share price.