ECONOMICS
The dominant theme for 1Q26 has been the US-led military campaign against Iran and its impact on global equity markets. The US/Israel alliance’s 28 February strikes on Iran triggered what the International Energy Agency (IEA) has described as the largest supply disruption in the history of the global oil market. The conflict escalated rapidly with retaliatory attacks, and Iran declared the Strait of Hormuz, through which c. one-fifth of global oil supply passes daily, effectively closed. Elsewhere, Russian President Vladimir Putin’s war on Ukraine is ongoing. Russian bombardment of military and civilian infrastructure has continued unabated for over 1,500 days. In both cases, the human cost has been severe.
From a geopolitical perspective, these developments highlight the complexity of achieving rapid strategic outcomes through limited military engagement. Even with the Russian army on the ground in Ukraine, Putin has failed to come anywhere close to achieving his objective of overturning Ukraine’s pro-Western government and bringing the nation back into Moscow’s sphere of influence.
Our point is that it was hubris to believe that the US and Israel could effect regime change with a week of bombing and no ground forces to support it. Iran’s decentralised command structures, low-cost weaponry (it costs the US US$2mn to shoot down every drone that Iran produces for US$30,000) and the fact that its military assets have been hidden over decades have made it a strong adversary. So, in our view, Trump is looking for a face-saving offramp as the clock ticks down to the midterm elections in November. Conversely, Iran’s regime had been crumbling under internal pressures and is looking to show a form of victory to bolster and reenergize a government that would otherwise likely have slid into eventual collapse.
While the objectives of the war are questionable and the outcome is likely a reinvigorated seedbed of terrorism, our focus is to consider the economic implications. Despite significant volatility, market behaviour suggests that investors are pricing in a contained conflict instead of a prolonged escalation, and key indicators point to resilience rather than capitulation. Brent crude oil prices have spiked to around US$119/bbl, the rand has weakened towards R17/US$1, and US equities are now broadly flat YTD, indicating adjustment rather than systemic stress. Global markets also seem to be pricing in an end to the war, and while economic damage is clearly being done, this is expected to recover once the war is over.
Current market pricing also implies an expectation that inflationary pressures will moderate over time, with oil prices potentially normalising towards long-term averages. At the time of writing, a ceasefire is in place, and there appears to be limited appetite for a return to sustained large-scale military engagement. Admittedly, the risk of a miscalculation or error from either side is high, and it will not take much to reignite the war.
In the US, markets have adjusted expectations for monetary policy, with anticipated rate cuts largely priced out for 2026. The US Federal Reserve (Fed) is likely to remain cautious, particularly in the face of energy-driven inflation pressure, while continuing to monitor broader inflation dynamics. We see expectations that inflation will come down again, that oil will revert towards US$70/bbl and that life will go on. There are very smart minds working on a solution, and Anchor Capital (along with financial markets) is hopeful that one will be found.
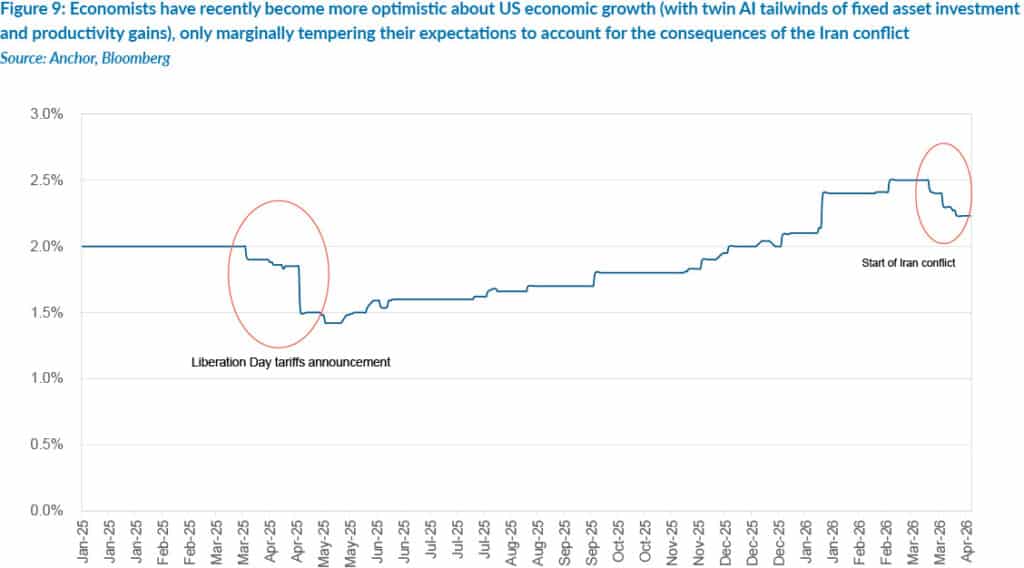
Expecting that this will end, we think Trump may find his power curtailed for the remainder of his second term. US inflation has quickened in response to higher energy prices, but the Fed is likely to look through these should the war continue to subside. AI-driven capital expenditure is expected to remain robust. This is a powerful tailwind for corporate earnings growth rates (well above historic averages), concentrated though it is across a narrow set of sectors. Policy uncertainty remains an ever-present backdrop, but the US economy will go on and is likely to hold up for the foreseeable future.
Domestically, South Africa (SA) entered this period on a relatively firm footing. Elevated commodity prices, especially gold trading around US$4,700/oz (lower than its peak but well above its 2025 starting point of US$2,600/oz), continue to support export revenues and fiscal dynamics. Inflation had been ticking lower, and while the two anticipated South African Reserve Bank (SARB) interest rate cuts are now likely off the table for 2026 due to geopolitics, we still believe the next move is a cut, albeit deferred.
We have been positively surprised by local political developments, including the stance our government has taken towards the US-led war and the approach towards keeping SA out of the US’s crosshairs. Municipal elections lie ahead, and we note that the Government of National Unity (GNU) has held together better than we had expected. Events abroad have been dominant and negative, but SA has quietly continued with the gradual trajectory of recovery that has been establishing itself over the last few years.
In summary, while the geopolitical environment remains fragile and the humanitarian consequences profound, financial markets are signalling an expectation of eventual stabilisation. The noise has been loud, but the underlying economic direction, both globally and domestically, has been quietly encouraging.
SA EQUITIES
JSE-listed equities, as measured by the FTSE/JSE Capped All Share Index (ALSI), began 2026 with considerable momentum before experiencing a sharp reversal in the final weeks of 1Q26.
The index was up approximately 11% over January and February, supported by a favourable combination of robust commodity prices, easing inflation expectations, and growing confidence around interest rate cuts. This environment drove strength in domestic bonds, which in turn supported a strong rally in financials, particularly banks and insurers.
This positive backdrop changed abruptly on 28 February following a significant escalation in geopolitical tensions, as conflict in the Middle East triggered a sharp surge in oil prices. This resulted in a rapid reassessment of global inflation and interest rate expectations.
March saw a meaningful market correction, with the Capped ALSI declining sharply over the month. The MSCI South Africa Index fell by c. 19%, making it the worst-performing liquid emerging market (EM) globally over the period. It also marked one of the largest monthly drawdowns for SA equities in over two decades.
At its trough in March, the local market experienced an intra-month drop of approximately 17%, highlighting the sensitivity of domestic assets to global shocks — particularly those affecting energy markets, bond yields, and currency dynamics.
What drove the quarter
The quarter was a tale of two halves, highlighting just how quickly market narratives can shift.
- Early 1Q26: The environment was supportive for risk assets, with falling inflation expectations, firmer bonds, and improving domestic sentiment driving performance in financials and domestically exposed sectors. This environment was also conducive for commodities, with the gold and platinum group metals (PGM) sectors adding meaningfully to the index’s performance.
- Late 1Q26: The oil price spike changed the calculus entirely and introduced a new risk dynamic. As a net importer of oil, SA is particularly exposed to energy shocks, which feed through into inflation, interest rates, fiscal pressure, and consumer demand. Many of the trades that had performed strongly in January and February unwound quickly.
Positioning and portfolio considerations
Heading into the quarter, the setup for local assets appeared increasingly constructive, particularly for sectors such as banks, retailers, and insurers, which offered attractive relative value compared to exporters.
While this view remains intact over the medium term, the quarter exposed a persistent structural challenge: the investable universe of high-quality, liquid domestic companies remains narrow.
- Banks continue to be the most attractive opportunity set. Operational performance is strong, management teams are executing well, and the sector is well-positioned to benefit from a gradually improving economic environment.
- Retailers remain the most challenging area. While consumer conditions had been improving prior to the oil shock, the sector remains largely ex-growth, with increasing concerns around capital allocation and execution.
- There are pockets of strength — notably Shoprite and, to a lesser extent, Boxer — where companies are navigating a difficult environment well.
- However, from a broader discretionary retail perspective, opportunities remain limited. Our exposure to broader discretionary retail has been kept minimal, with selective positioning in more defensive names such as Pepkor, which screens attractive on valuation but faces a more uncertain consumer backdrop.
Global exposure: Naspers, Prosus and Tencent
Naspers and Prosus have been notable underperformers YTD, with their share prices down approximately 22% and 24% (to 10 April 2026), respectively. This has brought renewed scrutiny to the holding company structures and the underlying operating assets, particularly against the backdrop of global technology and EM tech underperformance.
Despite this, we continue to see compelling value in these businesses.
Tencent is one of the highest-quality large-cap technology companies globally, with consistent operating delivery and strong positioning across multiple growth vectors. The recent derating represents, in our view, a multi-year entry point into a high-quality compounder. Naspers and Prosus remain core holdings in local portfolios, while Tencent continues to be the largest position in our EMs strategy.
Increasing volatility on the JSE
As highlighted in previous commentaries, the JSE’s composition has shifted materially, with precious metals and other commodity-linked sectors now commanding significant index weight. Gold comprises c. 18% of the ALSI (supported by central bank demand, geopolitical hedging, and investor flows); PGMs comprise a further 10%, although they are more exposed to industrial demand, especially in the automotive sector.
This has important implications
This concentration has increased the volatility of the index, which means the market is increasingly being driven by macro variables, including US dollar movements, geopolitical developments, and global liquidity, rather than domestic fundamentals.
Index-level forecasting has become harder, reinforcing the importance of bottom-up stock selection.
Outlook
We maintain a neutral stance on SA equities, with a forward-looking return expectation of approximately 12%, albeit with a wide range of potential outcomes.
The outlook is highly dependent on developments in the Middle East:
- Our base case is that tensions ease, oil prices stabilise below US$80/bbl, and the market environment reverts to one more supportive of domestic assets.
- However, this is clearly uncertain. A more prolonged conflict could result in higher inflation, weaker consumer conditions, fiscal deterioration, and pressure on global growth, all of which would weigh heavily on JSE-listed equities.
Final thoughts
The events of the past quarter reinforce a familiar lesson: external shocks are becoming more frequent and more consequential for the SA market. For SA investors, this is particularly important given the market’s sensitivity to global macro variables. While the domestic backdrop showed signs of improvement heading into 1Q26, external factors once again proved decisive.
In this environment, maintaining a disciplined, selective, and valuation-aware approach remains critical. Opportunities exist — particularly in high-quality financials and global growth exposures – but careful positioning and scrutiny of management capital allocation decisions in ex-growth sectors will be essential.
DOMESTIC BONDS
The escalation of conflict in the Middle East was the dominant macro development in 1Q26, driving volatility and broad-based losses across global bond and currency markets. In the near term, the environment points to higher inflation and moderately weaker growth.
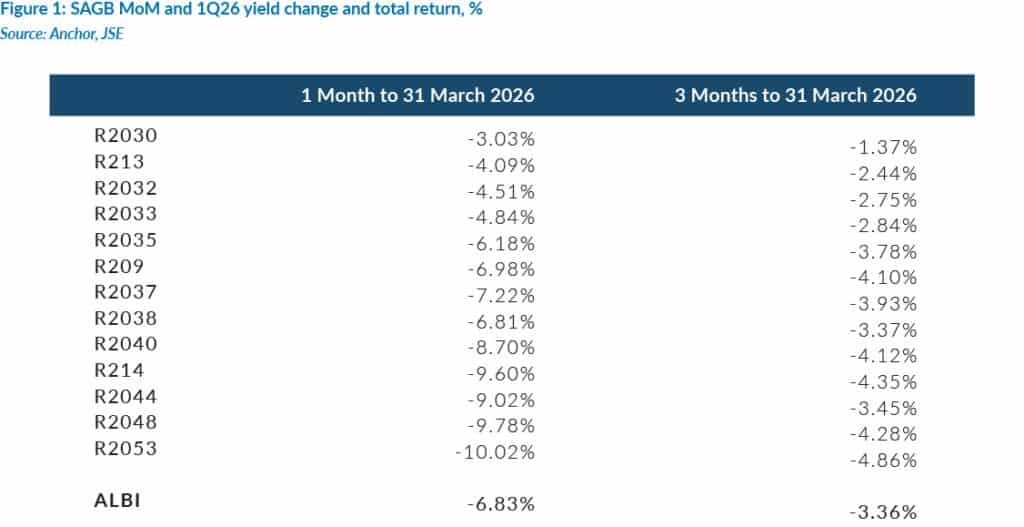
The South African Government Bond (SAGB) curve bear-flattened in 1Q26, with shorter-dated yields rising more than those at the long end. The All-Bond Index (ALBI) fell by 3.36% over the quarter (Figure 1). Gains earlier in the year, supported by improving domestic fundamentals including stronger fiscal dynamics and external balances, were fully reversed in March. The sell-off reflected a typical risk-off move, with risk premia rising across the curve and yields shifting higher by c. 120 bpts over the month due to the conflict. Following this repricing, yields now offer a more attractive entry point, and we remain cautiously constructive on the asset class.
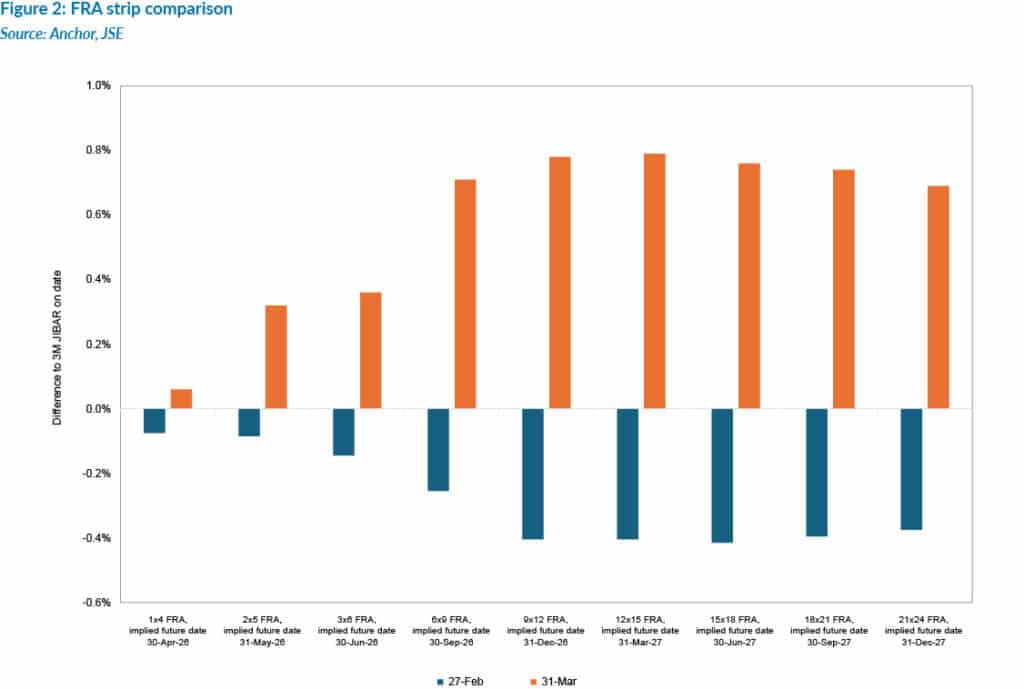
The Middle East conflict represents a classic negative supply shock, exerting upward pressure on prices while weighing on growth. Monetary policy expectations have adjusted materially. Prior to the conflict, markets had priced in two local rate cuts by year-end; this has since unwound, with pricing now reflecting roughly three local rate hikes (Figure 2).
Despite this repricing, we think it is premature to adopt a bearish stance on SA bonds. The outlook will depend on how long the shock persists, particularly the extent of any sustained disruption to oil supply through the Strait of Hormuz. For now, current events suggest that the situation may not be prolonged. Trump’s actions suggest a clear preference to contain oil prices, with efforts to calm markets and support supply. Our base case is that the shock is temporary.
If that proves correct, the risk of second-round inflation effects is likely to remain contained. Central banks typically look through the initial price impact of supply shocks, as this cannot be addressed by conventional monetary policy, focusing instead on whether broader inflation pressures begin to build. We expect the SARB to adopt a similar approach while closely monitoring wage dynamics and inflation expectations.
Importantly, SA’s underlying macroeconomic position continues to improve, as reflected in the 2026 Budget. Fiscal dynamics are on a better footing, structural growth constraints are gradually easing, and the external position remains supportive. Recent volatility appears driven by global developments rather than a deterioration in domestic fundamentals.
In this context, we maintain a cautious but positive view. The 15–20-year segment of the SAGB curve remains particularly attractive, offering compelling carry and rolldown given the shape of the zero curve. More broadly, SAGBs continue to offer some of the highest yields in the EM universe, albeit with a meaningful fiscal risk premium. Overall, we expect domestic bonds to deliver returns of around 9% over the next 12 months, implying a real return of roughly 6%.
THE RAND
The first quarter of 2026 has been marked by an extraordinary confluence of global shocks, including a US-led military campaign in Iran, the blockade of the Strait of Hormuz with severe implications for global oil supply, substantial foreign outflows from SA assets (exceeding R50bn), and an inevitable pivot towards risk-off sentiment. Despite these headwinds, the rand has demonstrated notable resilience, and at the time of writing (a day after failed US-Iran peace talks in Islamabad), the rand is ZAc2 stronger against the US dollar relative to its level at the start of 2026.
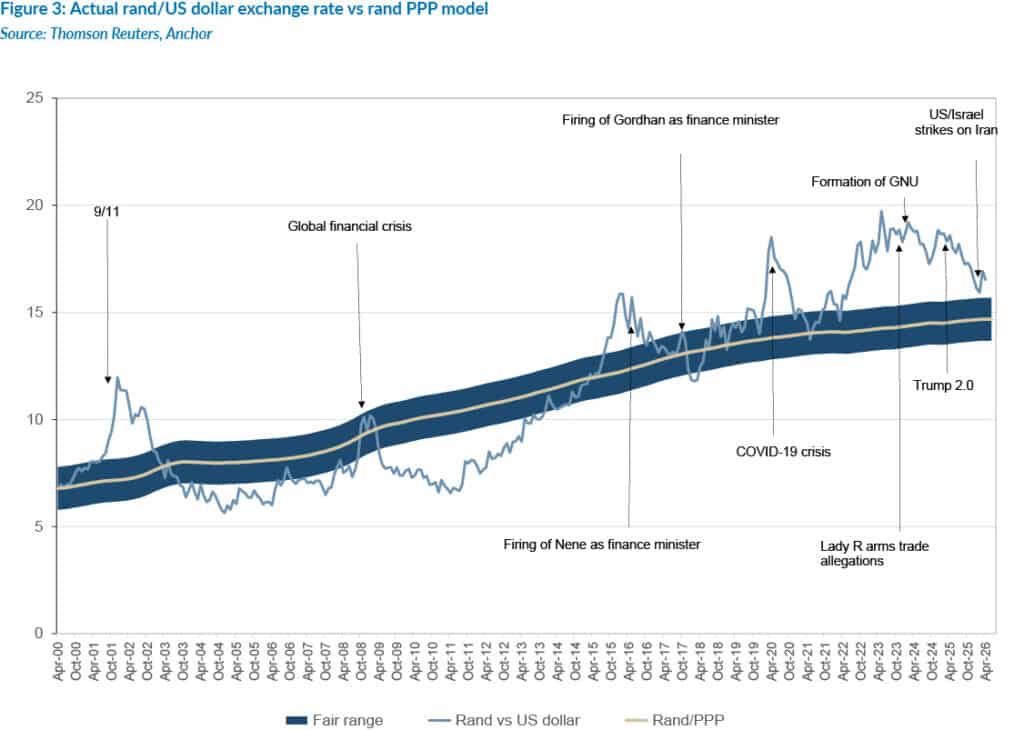
At Anchor Capital, we subscribe to a purchasing power parity (PPP) model for the long-term value of the rand. Over the past three years, the rand has been on a gradual recovery path from significantly oversold levels. This has been supported by a combination of the US dollar gradually losing its value against other currencies, improved terms of trade with domestic exports being more valuable globally, and a steady improvement in SA’s political and economic fundamentals. While this overall positive trend remains intact, it has been overshadowed in the near term by heightened global geopolitical uncertainty, as can be seen in Figure 3.
Forecasting the value of the rand in a year is a fool’s errand, as the local unit usually trades within a R2.00 range against the US dollar over 12 months. The risk of negative surprises to one’s view is particularly high at the moment, and the rand could quite easily be weaker than R19.00/US$1 this time next year.
That said, if we look at this rationally and consider a scenario where the war ends within the next year and that some recovery is likely, we think that a level of around R16.00/US$1 appears reasonable. This reflects a combination of continued improving domestic fundamentals, a potential relief rally once the US-led war on Iran is over and the likely higher risk premium applied to EMs for a while after the cessation of hostilities.
GLOBAL EQUITIES
We remain cautiously positive on global equities over the next 12 months, despite a significant increase in geopolitical risk. The escalation of the Iran conflict in March represented a genuine shock to markets; however, the most important takeaway is not the event itself, but how markets responded. Rather than capitulating, global equities stabilised and have partially recovered into April, leaving markets broadly flat YTD at the time of writing. We therefore retain our expectation for an 8% return from global equities in 2026.
Geopolitical risk is clearly elevated and unresolved. The Iran conflict remains fluid, and further volatility should be expected. That said, markets are forward-looking and appear to be pricing a contained conflict rather than a major global escalation. Our base case aligns with this view.
We do not believe Trump wants to re-engage in a continued full-scale war.
There will be ongoing noise, and the risk of miscalculation is real, but the incentives remain strongly skewed towards de-escalation. As a result, while geopolitical events may continue to drive short-term volatility, they are unlikely to derail the broader economic and earnings cycle.
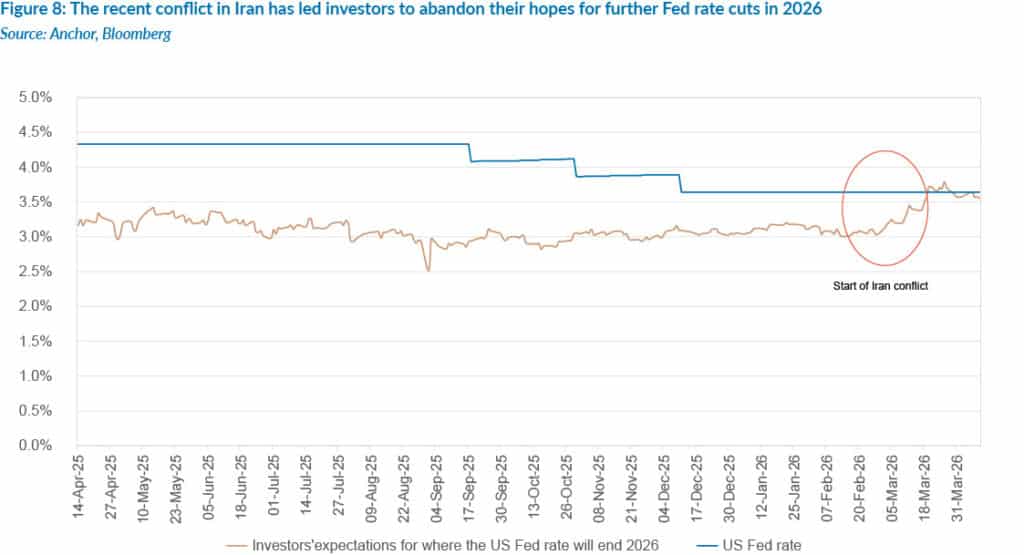
The key macro risk to this view lies in the oil price and the potential for supply disruption, particularly through the Strait of Hormuz. A sustained increase in oil prices has the potential to push inflation upwards, resulting in central banks increasing interest rates. Before the Iran war, the market expected 50 bpts of interest rate cuts in the US, and this has changed to an expectation of flat interest rates for the remainder of this year. With the US benchmark rate at 3.75%, monetary conditions remain restrictive by historical standards, but this also provides the Fed with scope to ease policy in the event of a slowdown in economic activity.
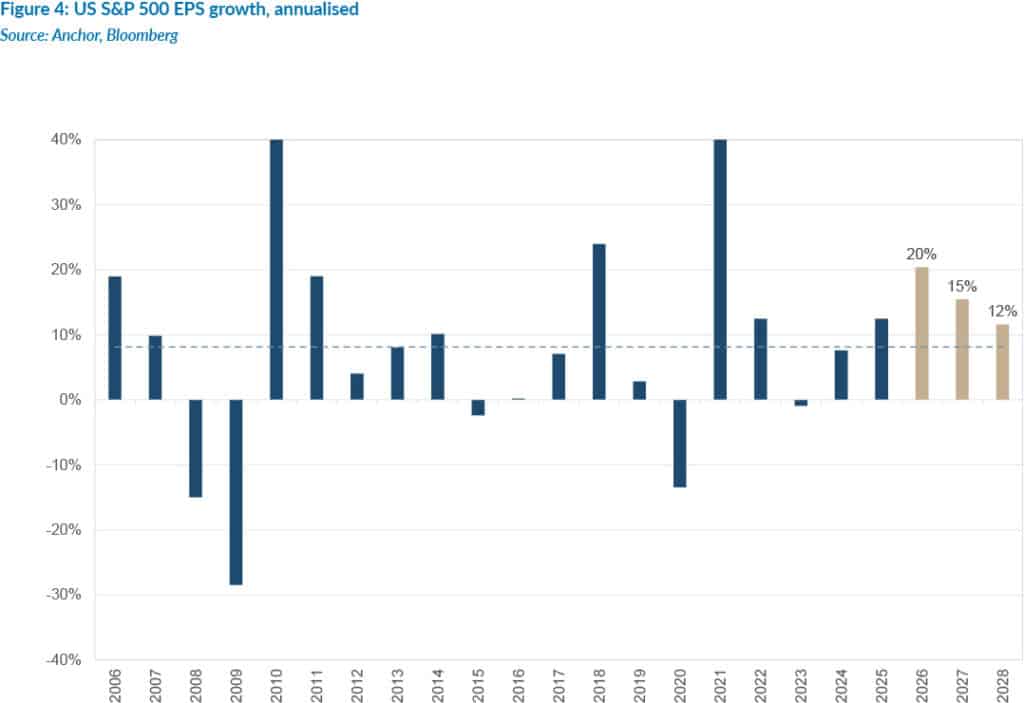
Stepping back from the noise, earnings growth expectations remain firmly intact, and the graph below shows a projected 20% earnings growth from the S&P for the next 12 months. This is driven by strong economic growth, significant capital expenditure by the big tech companies and lower interest rates.
The US economy continues to demonstrate remarkable resilience. While GDP growth forecasts have been revised marginally lower following the Iran shock, these adjustments are not material. The bottom line is that the US economy is very strong. The US also remains largely self-sufficient in terms of oil, meaning the primary transmission mechanism of the shock is through prices rather than supply constraints.
The scale of the current AI-driven investment is extraordinary (US$650bn in 2026) and continues to underpin both current economic activity and future productivity gains. While there is an ongoing debate about the ultimate returns on this capital, the near-term impact on growth and earnings is undeniable.
From a valuation perspective, the picture has improved meaningfully.
Equity markets are now approximately 10%-15% cheaper than six months ago, not because prices have fallen significantly, but because earnings expectations have continued to rise while markets have moved sideways. This is an important dynamic. It means that some of the valuation excess that concerned us at the start of the year has been absorbed through earnings growth rather than price declines.
We are therefore in a more balanced position:
- Valuations remain elevated in absolute terms;
- But they are more reasonable relative to growth prospects
The chart below shows the forward P/E multiple of the US market:
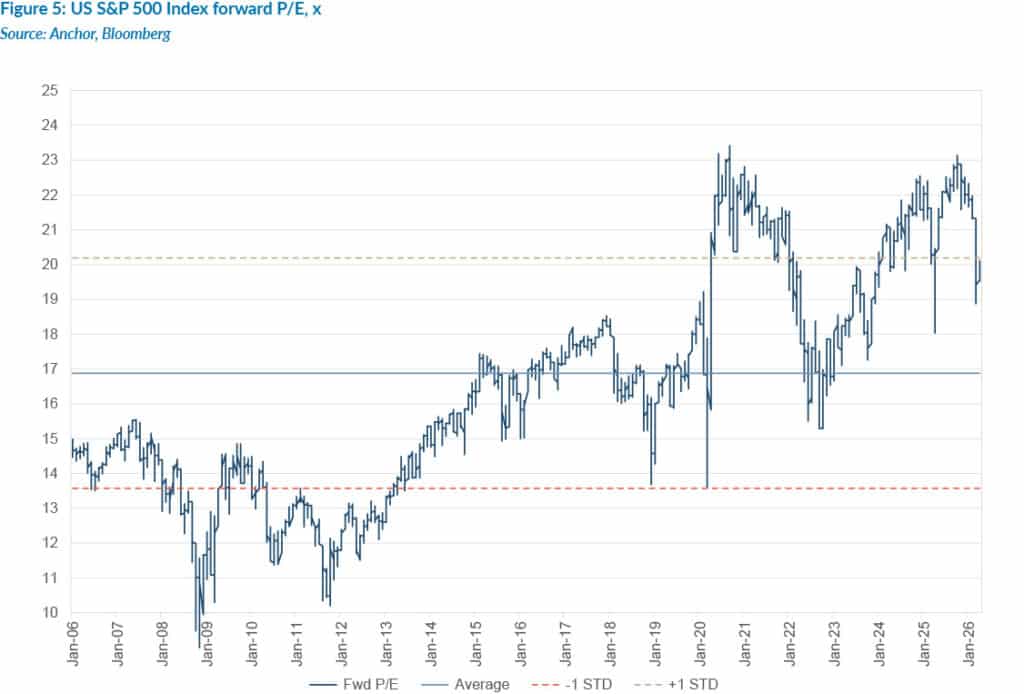
The current valuations support our view that equities can continue to deliver positive returns, albeit with volatility along the way.
It is important to emphasise that this will not be a smooth journey. Markets are pricing a relatively benign macro outcome, and any disappointment, whether from geopolitics, inflation, or earnings, can still result in sharp corrections.
When we look out over a 12 to 24-month horizon, the combination of strong earnings growth, resilient economic activity, and improving valuation support provides a solid foundation for higher equity markets.
The table below shows the earnings growth and P/E multiples of the different world indices.
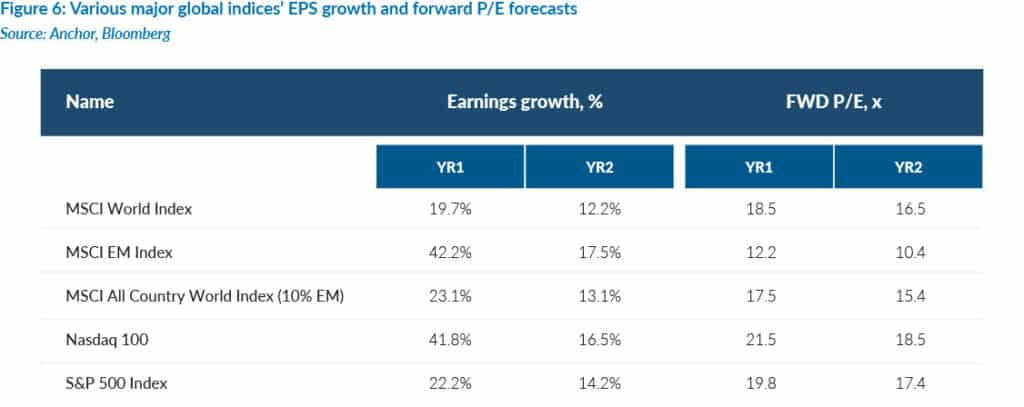
Growth outside of the US is more challenging, and the Euro region looks vulnerable, as an importer of a large proportion of its energy needs. EMs, which had been gaining favour in the pre-war, risk-on global environment, may face a higher risk premium in the near term as global uncertainty persists.
GLOBAL BONDS
One of the most significant bond bear markets in the past 60 years occurred in 2022, driven by a sharp rise in inflation following post-COVID-19 supply chain bottlenecks, alongside surging commodity prices in the wake of Russia’s invasion of Ukraine.
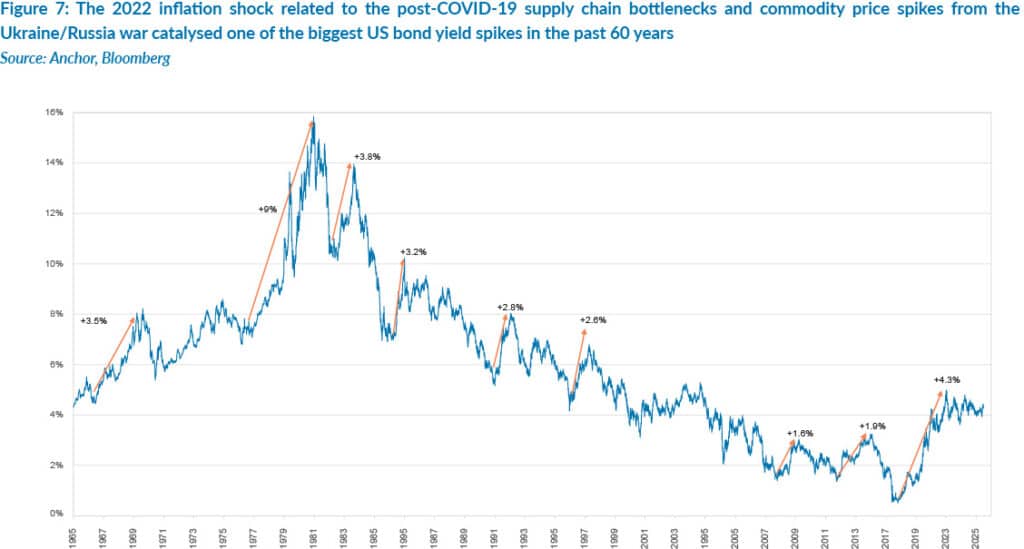
Since then, the bellwether for global yields (the US government’s 10-year borrowing rate) has traded in a fairly tight range between 4% p.a. and 4.5% p.a. The recent US and Israeli military strikes on Iran and its retaliation have caused a spike in the oil price, raising some concerns about near-term inflationary impacts and leading investors to abandon their hopes for Fed rate cuts in 2026.
Despite the increasing pessimism about the prospect of US rate cuts, the US 10-year government yield has remained in its 4% to 4.5% p.a. range, with the rate also being sensitive to the prospects of economic growth, which have remained fairly resilient, despite the Middle East conflict.
We think the US government’s 10-year borrowing rate will remain range-bound around the current levels, resulting in investors in these bonds generating returns over the next 12 months, predominantly driven by income of 4% to 4.5%.
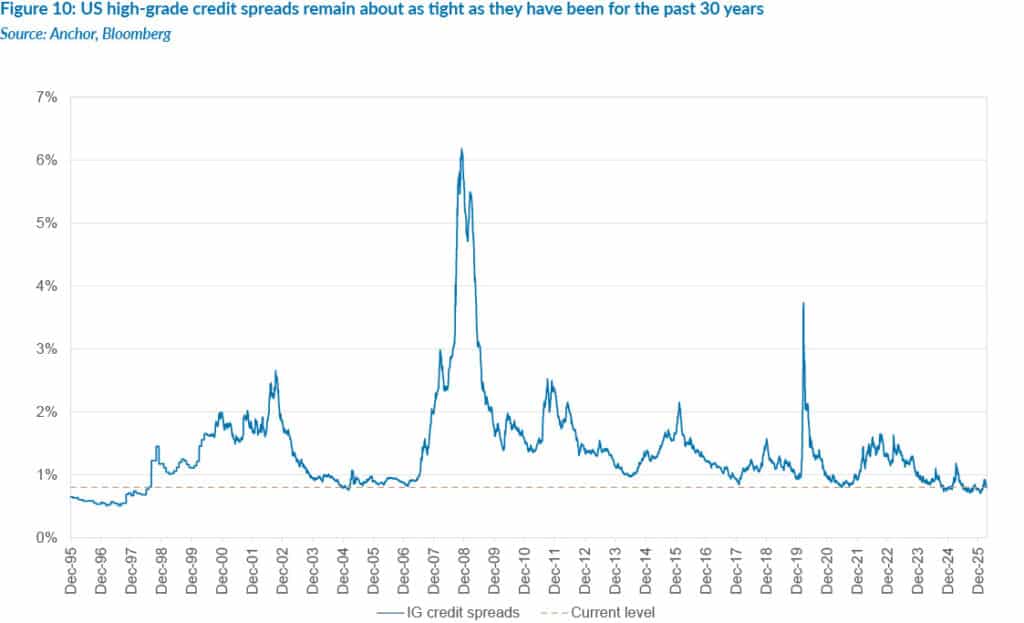
Investors in high-grade corporate bonds currently earn a yield of c. 5% p.a., with their additional compensation for taking on the risk of lending to non-government borrowers (0.8% p.a.) still about as low as it has been in the past 30 years. This leaves lenders in this high-grade market with limited protection against any default shocks. While this makes sense in the context of optimism around US economic growth, the recent wobbles in private credit markets have shown that AI disruption can also cause vulnerability in even the higher-quality borrowers. With almost no scope for further tightening in credit spreads, investors in US corporate bonds are likely left to rely on income (5% p.a.) as the sole source of their returns over the next year, while the prospect of capital losses from widening credit spreads lingers as a tail risk, albeit an unlikely one for the foreseeable future.
GLOBAL PROPERTY
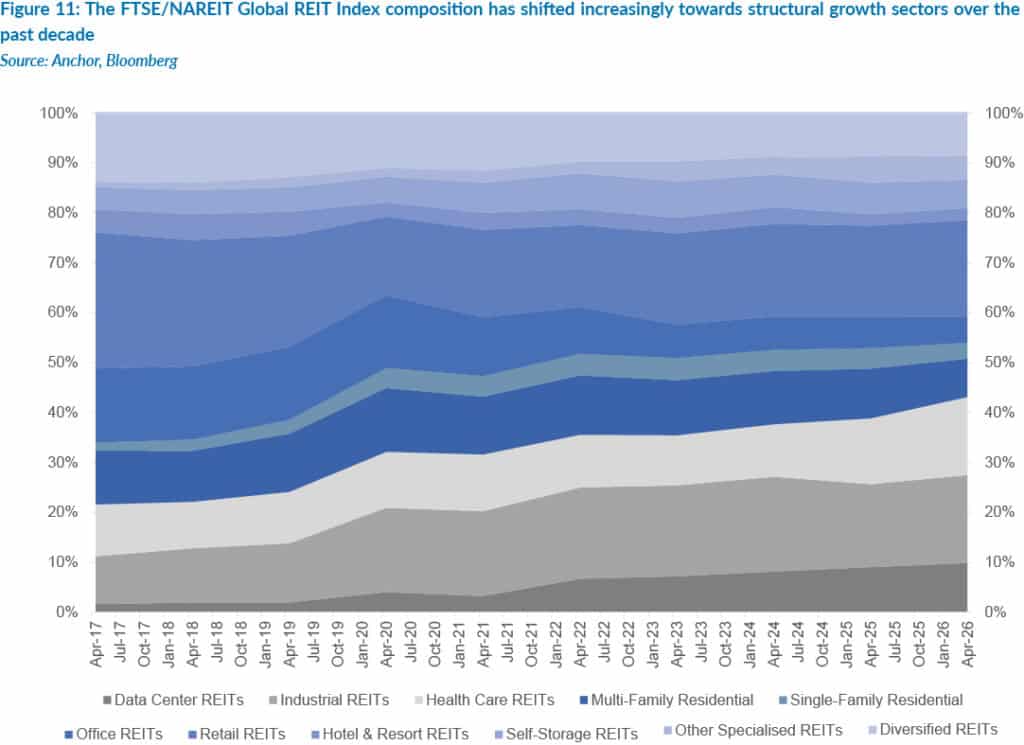
The Global real estate investment trust (REIT) landscape has seen a large shift in its make-up over the past decade, as the major global REIT indices have shifted increasingly towards the structural growth sectors.
This has made the index yield appear reasonably uncompelling on a relative basis, as the index’s forward dividend yield has stayed relatively stable (c. 4.3% p.a.) while bond yields have climbed c. 2% over the past decade. Much of the reason can be explained by the shift towards faster-growing REIT sectors, where investors are willing to rely more on dividend growth than dividend yield for their total return.
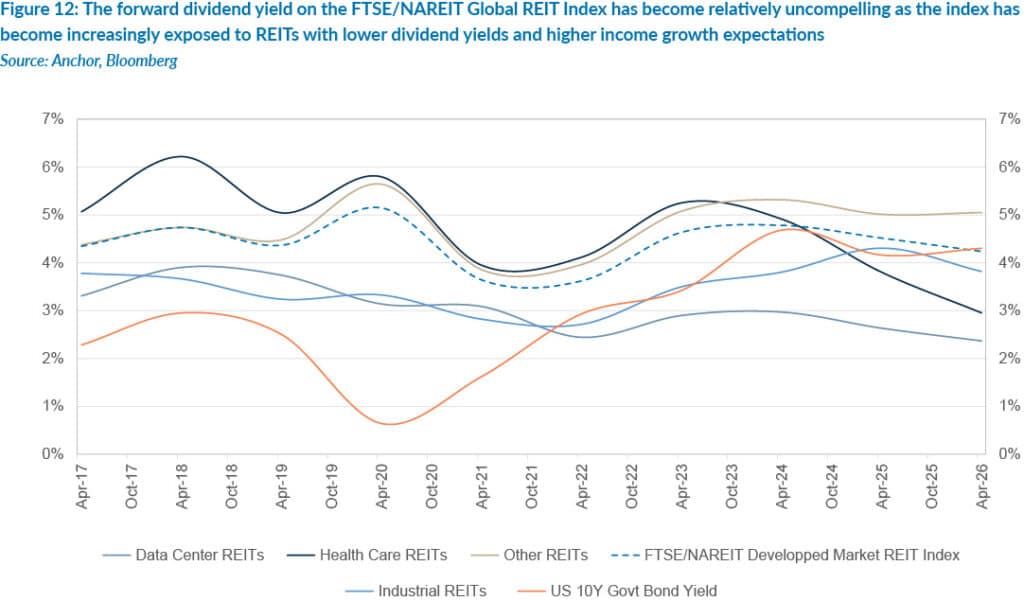
Healthcare REITs, which now represent c. 15% of the global REIT landscape, a sector which is dominated by heavyweights Welltower (US$146bn market cap) and Ventas (US$40bn market cap), trade on a forward dividend yield of c. 3% (substantially below the US 10-year government bond yield of 4.3% p.a.). The sector has structural growth tailwinds from ageing populations, but has also recently experienced some cyclical tailwinds, particularly post-COVID-19, when financing costs increased, and construction has slowed, constraining supply. The sector is also operationally complex and regulated, constraining supply even further.
Data centres, which have also become a meaningful REIT index component (c. 10% of the FTSE/NAREIT Global REIT Index), are another structural growth segment which has grown rapidly over the past decade and trades on a forward dividend yield of 2.4% as investors anticipate spectacular growth from the sector to meet the rising data demands from the AI revolution.
As the REIT industry shifts increasingly towards faster-growing, moderate-income-producing REITs, it becomes increasingly important to understand what to expect from your REIT investments. Selecting stocks that represent your investment objective is becoming more important than ever in the REIT industry. At the industry level, the increasing reliance on growth exposes the industry to greater volatility. As such, at a broad index level, we anticipate a return of around 6% p.a., with about two-thirds of that coming from income.