ECONOMICS
As we welcome the new year, the global economic environment remains challenging. As a small, open commodity-exporting economy, South Africa’s (SA’s) prospects are intrinsically tied to the global economy. As such, over the next year, we expect slower global economic growth to dominate the agenda. As a result, a recessionary-like environment can be expected across developed markets (DMs), with more divergence in economic activity for emerging markets (EMs). As such, our base case is for softer and more volatile commodity prices as global economic growth slows. Overall, financial markets remain relatively pessimistic about global growth prospects. As such, there is a greater potential for an upside surprise as the year develops.
A global shift in monetary policy, to either pause or slow down the pace of interest rate hikes in 2023, will largely remain a function of inflation which is broadly expected to ease — especially towards the latter part of 2023. Consequently, central banks are likely to shift their tone from arresting inflation to supporting growth. Once again, however, one cannot discount the strong risk of an upside surprise in global inflation. Meanwhile, Russia’s war on Ukraine remains a key geopolitical risk that does not appear to be abating anytime soon. In addition, the effects of sanctions against Russia and their disruptive nature on oil prices and broader supply chains continue to dampen the economic outlook. The current European Union (EU) ban on Russia’s seaborne crude oil and the expected ban on imports of refined oil products from Russia in 1Q23 are some challenges that will add volatility to the energy market. On the back of this, we caution that the effects of a global slowdown, combined with a higher interest rate environment, will continue to weigh on financial markets.
Food price inflation remains a focal point for investors at the start of 2023, given its impact on inflation and global monetary policy last year. Data released by the United Nations at the end of last week showed that The FAO Food Price Index (FFPI) averaged 132.4 points in December, down 1.9% from its November reading and, importantly, the ninth consecutive monthly decline. Thus, global food prices ended the year roughly where they started despite several disruptions, from the war in Ukraine to extreme weather. In relation, US inflation appears to have peaked in June 2022, with the consumer price index (CPI) providing a good reason to believe that we are now at the beginning of a downward trend. Moreover, the goods sector has primarily driven the decline in inflation over recent months, whilst prices of services have unfortunately proven stickier. Nonetheless, the downtrend is welcome news for markets and the US Federal Reserve (Fed), but it does not necessarily mean that we will get back to the Fed’s 2% annual inflation target anytime soon. If historical trends are anything to go by, it could take up to two years for us to get there. Interestingly, the decline in inflation is taking place without a sharp increase in the unemployment rate, which points to a higher probability that the Fed might engineer a much-desired soft landing of the US economy, a scenario that many thought was very unlikely just a few months ago.
The sequencing of how the Fed reaches its dual mandate (taming inflation and maintaining full employment) is key for capital markets as we move into 2023. Taming inflation first and moderating employment later means that the need for the largely feared “demand destruction” on the part of the Fed decreases. A less aggressive Fed (or a potential Fed “pivot” in 2023) would naturally be bullish for asset prices (public and private) ranging from rates to credit to equities. However, that being said, capital markets will likely remain vulnerable in 2023, and volatility will likely persist because capital remains scarce and expensive, and high-yield primary credit markets will probably stay virtually shut down for the time being.
No one will disagree that 2022 was an arduous year for SA, politically and economically. As a political institution, the ANC remains in a state of deep internal unease – with ongoing implications for the broader political economy. Many of these divisions and internal institutional weaknesses were displayed at the ANC’s 55th National Conference in December. 2022 saw a record level of loadshedding; Transnet’s crippling challenges; an ongoing breakdown in local government; and an elevated and poorly addressed crime crisis (particularly organised crime), which have all sapped local sentiment and undermined SA’s stuttering economic recovery. These and other deep structural concerns face the ANC’s new(ish) leadership, which continues to be impeded by three primary and ongoing growth constraints – ideology, patronage, and state capacity.
However, it is not all doom and gloom – the outcomes of the top seven and National Executive Committee (NEC) votes from the December conference provide a far more conducive basis for navigating these various challenges. It is also worth bearing in mind that since 2017 the president has made significant additional political headway, consolidating his internal authority in a deeply divided and often dysfunctional party. This has allowed the president to drive critical institutional and governance reforms, offer executive support for fiscal consolidation, and introduce some (if not ideal) economic reforms. Most importantly, however, post the December conference, the troublesome so-called radical economic transformation (RET) faction of the ANC appears to be in retreat – which should provide investors with some definitive relief.
Nevertheless, unlike in 2017, when Ramaphosa’s election as president of the ANC (and later the country) initiated a period of heady investor optimism, this time around, any material improvement in sentiment will rely not only on the signals emanating from the ANC’s recent conference but, instead, on the concrete, lasting reforms that the president and his allies push for in the new year. The most notable signal of intent in this regard will be the next cabinet reshuffle, which will likely be announced at some point early this year.
On the domestic monetary policy front, there is a high degree of uncertainty surrounding the upcoming 2023 interest rate decisions, given the diversity of views within the SA Reserve Bank’s (SARB’s) Monetary Policy Committee (MPC) about how it should approach the peak of the hiking cycle. At the last MPC in November, three members voted for a 75-bpt hike, and two voted for 50 bps. In fact, every MPC decision in 2022 featured a split vote, most of them quite evenly balanced. As such, we expect another split vote in the upcoming January MPC meeting. Forecasting the MPC’s decision is more difficult than ever as SA nears the top of the nominal hiking cycle. Nonetheless, we believe the SARB will likely hike by a further 75 bps throughout 2023 in gradual increments.
SA EQUITIES
SA equities (FTSE/JSE Capped Swix) returned 4.3% last year, comfortably outperforming the MSCI Emerging Markets Index (-14.3% in rand) and the MSCI All World Index (-12.0% in rand) consistently throughout 2022. Our total return expectation for the JSE over the next 12 months is 13%, primarily driven by positive returns from the miners, energy, banking and rand-hedge industrial counters.
Most investors frame SA as a higher-risk EM, and as such, the relative defensiveness of the 2022 performance would have raised a few eyebrows. However, as highlighted numerous times in previous editions of The Navigator, the set-up going into 2022 for the JSE did not screen as risky as the set-up for DM indices – and the outcome was ultimately not that surprising. Several factors in the build-up to 2022 lead us to this conclusion. First, the local economy has been underperforming vs its potential for many years. As a result, those sectors with the highest beta to SA GDP growth (except banks) have become a much smaller component of the local overall index. This continued underperformance of nominal GDP growth has also resulted in a gradually increasing cost of capital (SA government bond yields) during a time when the developed world was experiencing a continued reduction in the cost of capital. Last year saw the cost of capital in the developed world increasing rapidly, placing increased pressure on valuation multiples investors were prepared to pay. At the same time, SA entered last year on low-growth prospects, inflation largely under control and a stock exchange trading on the lowest relative rating in its history (the increase in SA risk-free rates had less of an impact on overall valuation levels).
We continue to view the 2023 outcome of China’s growth and economic policy as having the largest overall impact on JSE portfolio construction. In the middle of 2022, while China was taking a hard line with its zero-COVID policy and geopolitical risk was weighing on EM sentiment, the JSE also went through a tough run, with the Capped Swix down 12.7% between the end of 1Q22 and the end of 3Q22. However, as both of those risks started moderating, and pressure was taken off the US dollar towards the back of the year (due to the perceived threat of US inflation being under control), the JSE saw a sharp recovery in 4Q22. Consequently, it ended the year 4.3% higher in rand terms and down 2.2% in US dollar terms, emerging as one of the better geographies to invest in during 2022.
Some might question our conclusion on China’s outsized impact on the JSE. However, the way the JSE has evolved, the basic materials sector now accounts for c. 25% of the local bourse, with China being the biggest swing factor on end commodity demand. In addition, there is also the direct exposure to the Chinese tech giant Tencent via Naspers and Prosus (c. 12%), not to mention SA’s reliance on Chinese consumers for businesses like CFR Richemont (c. 3%), among others, accounting for over 40% of total directional exposure to China on the JSE. Thus, calling the outcome on China has become a key variable to get right for anyone managing a local equity portfolio.
Our stance towards China is positive. Still, we concede that our outlook was also positive a year ago when China emerged from a painful 2021 for holders of many Chinese equities. Our view then was premised on China being counter-cyclical, easing monetary conditions at a time when the rest of the world needed to tighten. Instead, the Chinese credit impulse, a measure of monetary conditions in China, has been tightening steadily from late 2020 and throughout 2021. We expected this to reverse going into 2022 to stabilise the country’s property market.
What caught us off guard was the government’s approach towards containing the spread of COVID-19 in the middle parts of the year and Russia’s invasion of Ukraine and the further spotlight it shed on the complex relationship between China and Taiwan. Our view and outlook on China should be seen in that context.
We remained overweight Naspers and Prosus in our domestic portfolios throughout the extreme volatility, and we hope to be justified in our decision. We were certainly not one of the many asset managers calling China “uninvestable”. Our base case is for Chinese economic growth of 5% this year, which will be multiples of what we will see throughout the developed world. We believe there is enough pent-up demand, especially from Chinese consumers, to drive a solid earnings recovery from Tencent and other China-focused consumer names.
Return expectations from domestically focussed companies have moderated since our last forecasts were published on 10 October 2022 in the previous edition of The Navigator – Anchor’s Strategy and Asset Allocation, 4Q22. We have been very bullish on SA banks for over two years. The combination of self-help and impairment unwinds post-pandemic, and positive endowment impacts from a rate-tightening cycle have been driving healthy earnings upgrades. The banks were a standout performer last year among the larger companies listed on the JSE. The FTSE JSE SA Banks Index rose by 17.7%, contributing a significant portion of the overall return of the Capped Swix (2.9%). While we are still invested in the banking sector, and it still looks fairly priced with reasonable growth prospects, our view is that without the same tailwinds driving share price performance that we have seen for the past two years, the ability to rerate materially from here will be somewhat limited. Our total return expectation is still north of 10% for the year, but ultimately we believe that the shares will be range bound and provide defensive exposure to the domestic component of the JSE. With economic conditions continually deteriorating in SA, it is difficult to get overly excited about any specific sector structurally.
Nevertheless, what is becoming clear is that the next round of investment opportunities is emerging as the dust settles post-COVID-19. In our portfolios, we are looking for businesses executing well (Afrimat, Shoprite and Bidvest come to mind) and self-help stories where the management teams have done an excellent job of driving positive change from the inside (Woolworths, Absa and OUTsurance). As a result, we think that stock pickers will be rewarded in the coming year as the differentiation between winners and losers becomes more pronounced, and management teams are rewarded for running businesses well in an extremely tough operating environment.
DOMESTIC BONDS
SA government bonds (SAGBs) recorded their strongest performance of the year in 4Q22, with the All Bond Index (ALBI) returning 5.19% for the last quarter of 2022. This implies a 2022 return of 3.78%, a clear indication of the struggles SAGBs experienced throughout 2022 as markets were rattled by:
- Russia’s invasion of Ukraine.
- Persistently elevated inflation in DMs (often, CPI prints in DMs have been multiples of their respective central bank targets).
- Global central bank rate hiking due to the slowing (or reversal) of quantitative easing (QE).
- China’s ongoing zero-COVID policy saw harsh movement restrictions in place there (the policy was finally abandoned in December 2022).
Given the above, the SARB has responded with successive rate hikes in 2022, leaving the repo rate at 7% by year-end vs 3.5% just eighteen months prior. DM central banks have also faced runaway (and sticky) inflation. However, in SA, inflation peaked in July 2022 at 7.8% YoY. Since then, it has moderated to 7.4% at the most recent print – which remains 1.4% above the top end of the SARB’s 3%-6% target band and 2.9% above the midpoint of the target band.
Currently, forward rate agreement (FRA) expectations are for rates to peak at 50 bps higher (in July 2023) than present levels, leaving the repo rate at 7.5% before the central bank pauses hikes. Cuts are only expected to happen in 1H24. With SAGBs entering 2023 with yields above 10% across the curve (from the R2030 onwards, a 7-year bond which matures on 31 January 2030) and long-dated debt still yielding 11.4% (R2040 17-year bond), we currently foresee returns in 2023 of 10.25%, with most of that return being interest income.
Domestic political and social risks pose a material threat to this forecast. These risks include:
- President Cyril Ramaphosa remained under a cloud even after his re-election as head of the ANC because of the robbery (of US$580,000) and alleged cover-up at his Phala-Phala farm. After the early December 2022 threat of his resignation, the market reaction laid bare how critical a figure he is considered to be by the market at large.
- Ongoing loadshedding remains a risk – 2022 was the worst year yet for blackouts, with more hours per day without power than in any previous year.
- The lead-up to the 2024 SA national general elections will create uncertainty as we head into the latter part of 2023, given the decline in ANC support at a national level. Some polls are placing ANC support for the 2024 election at 50%-52%. Still, there is the risk that the national government will be destabilised and uneasy coalitions will be formed – a downside risk for stability.
At Anchor Fixed Income, we remain bullish on SAGBs as an investment class. However, we are mindful of the above risks. The potential for volatility throughout 2023 exists with some headwinds that may materialise, negatively impacting bond returns.
THE RAND
Last year was characterised by a strong US dollar dominating other currencies, allowing the rand to end the year at R17/US$1. We note that consensus forecasts are shifting towards a weaker dollar for 2023, and we have already seen global hedge funds shifting their positioning accordingly. We are questioning how much a weaker dollar manifests as a strong rand for the year.
Projecting the rand’s value in a year’s time is a fool’s errand. This is because the rand vs US dollar exchange rate is one of the world’s most volatile currency pairs and trades well away from any modelled fair value for long periods. We note, however, that the rand trades within a R2.50 range to the US dollar in most 12-month periods.
The indicators for the rand’s fair value are gradually turning negative again. We note that 2022’s current account surplus will likely give way to a shallow deficit in 2023, eroding some currency support. The boon from high commodity prices will also dissipate, shining a light on SA’s fragile fiscal situation and poor government finances.
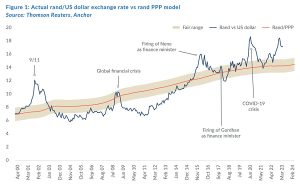
We retain our purchasing power parity (PPP) based model for estimating the fair value of the rand. We have extended this out by three months since the publication of The Navigator – Anchor’s Strategy and Asset Allocation, 4Q22 report on 17 October 2022. Over our forecast period, we expect inflation abroad to come under control and return towards more normalised levels. As a result, our PPP model is again showing an increasing propensity for long-term rand weakness from 2024. Our PPP-modelled value for the rand vs US dollar at the end of the next 12 months is R14.30/US$1 (see Figure 1). We apply a R2.00 range around this to get to a modelled fair value range between R13.30/US$1 and R15.30/US$1.
The current global backdrop means we are starting with the rand meaningfully weaker than our modelled fair range. In previous cycles, dollar strength has tended to dissipate (and reverse) toward the end of the US rate-hiking cycle. Current indications are that the US Fed will reach peak rates in 1H23, meaning that we expect to see currency normalisation, with the US dollar giving up some of its gains in the latter part of next year. However, we do not expect the currency to fully recover that rapidly, and we are projecting a rand in the R16.00-R16.75/US$1 range in a year. For this report, we have modelled on R16.50/US$1.
We expect the rand to remain particularly volatile, and surprises are a certainty in the year ahead.
GLOBAL EQUITIES
We expect global equities to recover some lost ground in 2023. Markets crashed in 2022 and gave up all of the gains of 2021 as global interest rates were hiked aggressively. We have now moved further into the cycle, and inflation appears to have peaked a few months ago. We expect asset prices to eventually rebound as central banks slow and, eventually, stop monetary tightening (probably in the next six months). This process is never smooth, but we should end 2023 with a far brighter economic outlook, which we believe markets will have priced in by then. We expect volatility and some further dips, which will provide opportunities to add value by stock picking.
Global bearishness prevails, with major US investment bank S&P’s forecasts tightly around the 4,000 level (0%-5% equity return for the year), with an expectation of a poor first half as the economy remains under pressure. This might be the case, but we expect the bear market to end as inflation recedes. Positive surprises could be well rewarded in a pessimistic environment. We believe a 4,400 level at the end of 2023 is viable, which equates to a 14% return for 2023, although we have pencilled in a 10% return to be conservative. The S&P started 2022 at around 4,800 and ended the year just above the 3,800 level.
Beneath the index level, there are three important underlying dynamics:
- There is massive desynchronisation between the East and the West. In the US (the world’s biggest economy), it is all about putting on the brakes and suppressing inflation, which risks a recession. In China (the world’s second-biggest economy), the economy is being powerfully stimulated, and a recovery is expected after opening up from harsh COVID-19 lockdowns. This revitalised engine of growth will be positive for commodities and Chinese cyclicals like luxury goods.
- The end of the US monetary tightening cycle should weaken the dollar. However, the market has already started this process, and the US Dollar Index ended the year 8% stronger after peaking at a massive 17% a few months earlier. This will be positive for commodity prices and US earnings, with 38% of US profits coming from offshore.
- In 2022, defensive and energy shares held up well, while tech and other growth-oriented companies slumped considerably more than the index (the Nasdaq was down 32% in 2022). The premium for long-term secular growth all but disappeared. As markets recover later in 2023, the reverse will likely apply, and many great growth companies are now trading at very attractive multiples. Microsoft, one of the world’s top-quality growth stocks, was down 32% in 2022.
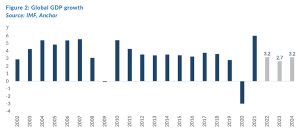
Global growth in 2023 (see Figure 2 below) is likely to be the lowest in years, with China countering poor US growth. However, more synchronised growth is expected to follow in 2024. This is what the market will be pricing in at the end of this year.
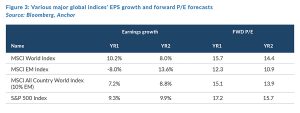
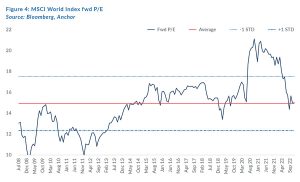
The MSCI World Index’s forward P/E of 15.7x (see table below) leaves room for upside, even though the 10% earnings growth forecast is likely too high. Multiples often increase when earnings dip as long as the future outlook is more positive. In addition, EMs are much cheaper, with strong recovery potential.
The MSCI World Index’s forward P/E is shown in the chart below.
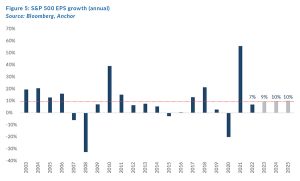
But the most critical determinant of markets is earnings, and downgrades will certainly follow – official forecasts tend to lag the actual expectations discussed in investment meetings. The picture below shows that Bloomberg consensus’ 2023 EPS growth projections for the US are 9% YoY, which appears high given the economic pressure that will be felt from higher rates. We would argue that much of this has been anticipated and is priced in at current valuations.
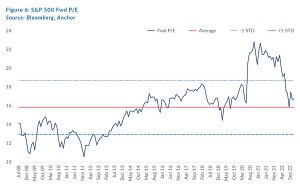
The US S&P 500 forward P/E of 17x (see graph below) is just above the 15-year average, which is the argument for moderating return expectations. However, if you strip out the big five tech companies, this decreases to a cheap 14x. Nevertheless, we note that this does leave a buffer for anticipated downgrades.
GLOBAL BONDS
US 10-year government bond yields spent most of the post-global financial crisis (GFC), post-inflation, QE-era capped at around 3%. Over this era, the US Fed was more than willing to rush in with a liquidity injection (“Fed put”) with the threat of inflation seemingly confined to the history books and this, along with a similar outlook on supportive monetary policy from the European and Japanese central banks, made fixed-income investments unappealing for investors seeking a real return. Central banks doubled down on QE and zero rates when the pandemic hit, and fixed-income yields became even more unappealing. Then, in 2022, seemingly extinct inflation came roaring back to life as DM consumers emerged from the COVID-19 pandemic (in pristine financial condition thanks to aggressive fiscal stimulus) with pent-up consumer demand and supply chains still clogged up. The resultant inflation appeared transitory but was exacerbated by food and energy price shocks caused by the unexpected Russian invasion of Ukraine. The prospect of spiking inflation becoming entrenched increased dramatically. DM central banks were caught on the back foot and scrambled to catch up, causing the biggest sell-off in bonds in at least the 40-odd years that most bond indices have existed. By October 2022, the Bloomberg Global Aggregate Bond Index had fallen more than 20% YTD.
However, that is all in the rear-view mirror, and going forward, the most important questions for global bond investors are:
- Will we return to a benign inflationary environment, and if so, how quickly?
- Will the “Fed put” return, and if so, how much can we rely on it?
On the former question, we believe that most factors that appeared to have confined inflation to the “history books” are still firmly in place.
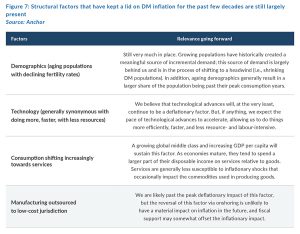
Having said that, the current bout of excess DM demand is unlikely to dissipate without a meaningful deterioration in economic activity (and the concomitant increase in unemployment), which we believe is only likely to materialise in 2H23. As such, inflation is expected to remain uncomfortably high for 1H23.
Our thoughts on the “return of the Fed put” are that QE is now very much an arrow in DM central bank quivers and will make a reappearance during the next bout of economic stress. Thus, in our view, the Fed put is still very much in place. Still, we now believe that the ability of investors to blindly rely on it kicking in every time there is market volatility is a thing of the past, given the recent confirmation that the threat of inflation is still very real. We think real evidence of higher unemployment is necessary before we can rely on the Fed put kicking in. As previously mentioned, we believe it will only likely show up in 2H23 at the earliest.
Regarding the outlook for US government bonds in 2023, towards the end of our investment horizon (i.e., late 2023), we will see the economic conditions necessary for a start of easing monetary policy. Unfortunately, for bond investors, we think that current DM government bond yields already reflect this outcome, so our base case is for US 10-year government bond yields to end the year close to their existing 3.5% level, giving investors a total return (in US dollar terms) of 3.5% for the next 12 months.
The likelihood of the US ending 2023 in a period of economic stress cannot be excluded. As such, the prospect of some corporate defaults rattling corporate bond markets must be factored in. US investment-grade credit spreads have already pre-empted some of this and are trading well off their cycle lows. Still, as is almost always the case, credit markets will likely overreact to defaults, and as such, there is a reasonable prospect of credit spreads ending 2023 slightly higher. That will be a fantastic opportunity for corporate bond investors. Still, the path to that point is likely to cause some pain, such that US corporate bond investors will likely match the performance of government bond investors in 2023 with a 12-month total return (in US dollar terms) of 3.5% with a slight capital loss offsetting an attractive yield.
GLOBAL PROPERTY
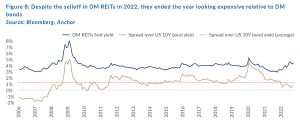
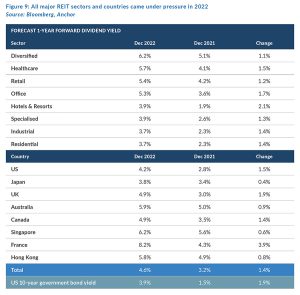
DM-listed property was one of the worst-performing asset classes in 2022 (FTSE EPRA/NAREIT Global REITs Index -24.5% YoY). The asset class matched many others in entering a bear market in 1H22 (i.e., down more than 20%), but it was the relative performance in 2H22 that was perhaps the most disappointing, falling almost twice as much as global equities in 3Q22 (-11% QoQ vs -6% QoQ for global equities) and then lagging the 4Q22 recovery (6.6% QoQ vs 9.9% QoQ for global equities). In a year when DM interest rates spiked, resulting in one of the biggest bond market selloffs on record, it is perhaps unsurprising that this income-generating asset class also had a tough time.
The major derating for the asset class resulted in an increase in the forecast dividend yield of 1.4% for 2022 (from 3.2% at the start of 2022 to 4.6% at year-end). But, such was the extent of the spike in rates for 2022 that the jump in forecast dividend yield lagged the increase in bond yields, resulting in a compression of the relative yield premium for real estate investment trusts (REITs) over bonds to well below its historical average, leaving the asset class still looking relatively expensive even after a very poor year.
The selloff was fairly indiscriminate, with all sectors and regions experiencing pain in 2022.
Going forward, we expect to remain in a structurally higher interest rate environment, and this will mean that the operating model (which relies on leverage, that will now come at a higher cost) and the valuations (which are viewed relative to other yield-generating investments) will need to adjust accordingly. We believe this adjustment still has some way to run and will weigh slightly on capital values. However, this is offset by the positive tailwind we expect from moderately higher inflation, driving rental escalations and the prospect that all of the pandemic-related supply chain and labour disruptions we have experienced for the past few years will potentially keep supply cyclically constrained.
Regarding our expectations for the next twelve months, we think investors can anticipate a dividend yield of c. 4.6% to combine with mid-single digit operating income growth and a slight derating for a total return (in US dollar terms) of 7% for the asset class.
ALTERNATIVES
The last year has reminded investors that equities and bonds are volatile and can incur material losses over shorter-term timeframes. A year or two ago, the promise of a steady 8%-12% return p.a. seemed only moderately exciting. However, the relative attractiveness of that profile is now much more interesting to many investors after a year of pervasive double-digit declines. This is where the world of alternative investments comes into play.
Alternative investments offer some compelling investment profiles and potential returns. For example, in our asset allocation table earlier in this document, we indicate a return expectation of 10%-15% in rand investments and 8%-20% in the US dollar category. This is a broad range of returns, and we discuss the various available opportunities in this article.
The term alternative investment is broad, and we view this category as investments different from long-only, vanilla (and typically listed) exposure to underlying assets like equities and bonds. Alternative investments include hedge funds, structured products, private debt, private equity, special opportunities and property development. The risks and potential returns vary markedly, and these must be properly understood and considered together with a suitable investment professional.
Alternative income investments are probably the easiest to understand. Our “vanilla range” of income collective investment schemes (CIS) generate running yields of around 8.5%-10.5% in rand terms and invest primarily in liquid, listed instruments. These funds are mainly lent to the government, banks and large corporates. You can earn even bigger returns if you are willing to lend to private businesses and individuals. Anchor can source private debt funds, generating yields of around 13%-14% in rand and 9% in pound sterling. These are riskier than vanilla lending; usually, money must be committed for longer than one year. While the risks are higher, the track record of our UK fund is exemplary, and the fund managers are of the highest calibre. Anchor has also just launched a global income fund generating a running yield of close to 7% in US dollar terms. This fund invests primarily in US dollar-denominated bonds of big SA corporates.
The simplest way to understand hedge funds is that they are unitised products where the fund manager has a more extensive toolset and can enter into contracts which create different profiles for long-only investments. The fund manager can hedge (reducing risk), short (making money out of shares going down) and gear (using debt to buy more of an investment). A hedge fund’s track record and investment discipline are crucial. We do not typically invest in hedge funds outside of the Anchor stable as we properly understand the styles and processes of our managers. Our Anchor Accelerator Fund won the award for the best long/short hedge fund in SA in 2019, and it invests across SA and EMs. Our best-performing local fund has generated a low volatility return of 17% p.a. over the past five years. We also have a global macro fund (not licensed to be marketed in SA), which sophisticated investors can enquire about.
Structured products have become particularly attractive due to higher interest rates and high volatility. Banks build these for us based on the investment profile we wish to create, and we can offer hedging, capital guarantees, geared portfolios and generate attractive coupons. These form a crucial pillar of many of our high-net-worth individual (HNWI) portfolios and should be considered supplementary to vanilla long-term investments. “Reverse convertibles” are an attractive space at present. We are also generating interest in US dollar coupons of 15%-20% (paid out monthly) if investors are prepared to accept some downside risk in the chosen equities. We can also create a diversified basket of these products, where we typically aim for a low volatility 12%-14% US dollar return, which we have been achieving for the last year.
Anchor also has dedicated resources sourcing exceptional opportunities that are made available to our clients. For example, in the property space, Anchor Tenant typically creates three to four offshore property opportunities every year, and our standard minimum return objective is more than 15% p.a. in US dollar terms. As a result, we can regularly identify properties that fit the bill in terms of quality and risk. In addition, other opportunities, including underwriting, equity-secured lending and placings, have generated meaningful returns for our clients.
As seen above, alternative investments span a broad spectrum, but generally, these products offer something different to vanilla equities and bonds. The return threshold for these to be interesting is typically double digits, with lower risk than equities. Higher interest rates have made this more easily achievable. Anchor is starting a unitised fund that offers a diversified range of the products and profiles explained above, with the objective of a reasonably stable 12%-15% rand return p.a.
At Anchor, our clients come first. Our dedicated Anchor team of investment professionals are experts in devising investment strategies and generating financial wealth for our clients by offering a broad range of local and global investment solutions and structures to build your financial portfolio. These investment solutions also include asset management, access to hedge funds, personal share portfolios, unit trusts, and pension fund products. In addition, our skillset provides our clients with access to various local and global investment solutions. Please provide your contact details here, and one of our trusted financial advisors will contact you.