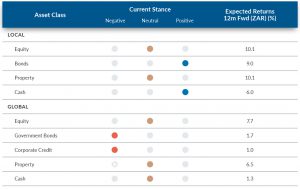
Global Backdrop
Global economic growth slowed from 3.6% in 2018 to a more pedestrian 3.0% last year. This is expected to increase towards 3.1% in 2020. Underlying this, is a divergence between developed markets ([DMs]; which are expected to slow a little further) and EMs (ex-China), which should accelerate slightly. One does feel that the US economy is past its peak and that as US President Donald Trump’s tax cuts for individuals are grandfathered out, consumer spending will slow a little. This will act as a bit of a handbrake on the US economy for a while. Meanwhile, US inflation is likely to hover around the Federal Reserve’s (Fed’s) 2% target. The combination of these factors will likely usher in an extension of accommodation from central banks. The Fed is likely to continue to support risk assets. With global equity prices looking quite full currently, we think that the beneficiary of the looser Fed policies will likely be EMs. This will probably support both the rand and domestic bonds even in the face of domestic deterioration.
Domestically, we expect that the local economy will continue to splutter and bumble along. Eskom and a lack of confidence are taking their toll. We recently saw that the government heard comments from the private sector and lightened visa restrictions for tourists. It would be wonderful if Parliament took it upon themselves to see what they can do to foster growth this year. What an outcome if they spent their time identifying just three regulations that they could lighten or repeal in order to give the economy space to grow. We can think of several possibilities offhand. Without some space from government our economy will continue to splutter along. Consensus is quite strong that SA will suffer a downgrade to complete junk when Moody’s announces its decision on 27 March. With the current economic framework this is inevitable. That said, we do think that a sensible plan for Eskom and its debt (what we have seen so far is not enough) and a sensible budget from the finance minister with below-inflation increases for a number of government departments would be enough for a stay of execution from Moody’s, buying time to 20 November. The economy remains in dire straits and it will take a few bold changes in direction to significantly improve the outlook.
While the Fed will continue to support global risk assets, geopolitics will remain a risk factor. As we have seen with the recent actions by the US in Iran, many of these events are unpredictable and both shock and scare investors. We expect volatility will remain high, though opportunities are to be found in most asset classes at the moment.
South African Equities
Investors on the JSE experienced a relatively disappointing 2019, with the local index being the only major stock market globally to not record double-digit US dollar returns. With the help of a 3.1% positive move in December the JSE/FTSE Capped Swix ([Capped SWIX], our benchmark for measuring local equity performance) ended the year up 6.7%, with the currency another 3% stronger. As has been the case throughout much of its history the JSE’s four-largest components (domestic cyclicals, materials companies, Naspers/tech and rand hedges) experienced very differing fortunes:
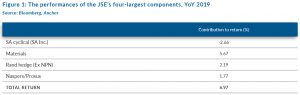
Throughout the year, swings in sentiment, whether it be domestic influences (politics, Eskom etc.) or global forces, kept investors nervous as to where SA sits in its own growth cycle. Towards the end of the year the “phase-1” trade deal between China and the US helped catalyse a rally in EM stocks and currencies, dragging the rand (+4.7% in December) and the local bourse (FTSE/JSE Capped SWIX Index +3.1% in December) higher. Platinum shares were again leading the way, up another 20% to cap a year in which their share prices tripled! Gold shares continued the rollercoaster bouncing back from a double digit sell-off in November to post a double-digit gain in December, leaving gold stocks up 120% for the year. Gold and platinum shares accounted for 80% of the Capped SWIX performance in 2019 and almost half of December’s performance.
SA cyclical (SA Inc.) shares
Many pundits, Anchor included, expected the economy to start showing some signs of life after a decade of mismanagement as the new administration led by President Cyril Ramaphosa took the reins. However, continued loadshedding by Eskom, a restrictive policy framework and poor overall confidence levels resulted in 2019 being yet another missed opportunity for the SA economy.
Domestically focussed equities were unable to defy gravity and their earnings growth slumped, with a few notable exceptions. These declines in earnings growth and the continued spectre of a potential Moody’s downgrade caused foreign investors to lose patience with domestic companies selling c. R128bn worth of SA equities over the year. The continued foreign selling caused SA companies to de-rate significantly and, for the first time since 2009, local listed firms now trade at a discount to their EM peers.
These three factors – disappointing earnings growth (often times negative growth), de-ratings in valuation and offshore selling – caused annual investment returns from local companies to range from, at best, low single-digits to a more than 50% YoY decline.
However, fortunately, there were a few exceptions to this dire storyline. SA companies that continued to meet investors’ growth expectations, such as Capitec and Clicks, were handsomely rewarded. Investors piled into these businesses, resulting in them reaching eye-watering valuations. It is important to reflect for a moment on these companies, especially since their impressive performances highlight that investors are indeed still craving growth stories in the SA context. This means that, should SA companies start to show signs of earnings growth returning or at least earnings growth not disappointing investors’ expectations, we would see SA firms return to their previous multiples which will, in turn, lead to strong investment returns.
The question to ask is will this happen in 2020? Our expectations for SA GDP growth and consequently earnings growth for SA companies have been pulled back markedly from 12 or even 6 months ago. And, judging from the valuation levels of most SA companies, this is also true for the rest of the market participants. The combination of these two factors, much lower expectations (making a positive surprise easier to achieve) and slight incremental improvements, could provide a catalyst for investor confidence to return. The lack of confidence from investors, businesses and consumers has been the reason for the subdued performance of the SA economy.
So, will SA companies be able to meet these low expectations and show slight and incremental improvements in earnings growth? Eskom remains the key swing factor as the economy will struggle to grow if it continues to be constrained by a lack of electricity supply – there is nothing that can impact confidence levels like sitting in the dark. However, should Eskom be able to keep the lights on, we believe, that the ingredients are there for SA corporates to deliver on current low expectations.
The unpredictability of the range of potential outcomes has resulted in a fairly cautious approach to portfolio construction. We are currently c. 15% underweight domestic cyclicals (which make up c. 50% of the JSE/FTSE Capped SWIX), with a skew towards the more defensive subsectors such as banks, property and quality industrials. The JSE Banks Index continues to trade at an undemanding 9x forward PE multiple, a 6% dividend yield and expected 1-year forward earnings growth of 7%, valuations we find appealing in the context of the low-growth environment.
Materials shares
The dominant theme in 4Q19 was the continued rally in the platinum group metals (PGM) sector. The underlying metals enjoyed another strong quarter in US dollar terms, with the prices of platinum, palladium and rhodium, the three major metals in the PGM basket, increasing by 10%, 16% and 14% during the quarter, respectively. PGM company shares soared as a result, with the four major PGM miners (Amplats, Implats, Northam Platinum and Sibanye-Stillwater) rallying between 43% and 71% for the quarter.
Given the strong commodity price performance of precious metals (PGMs, gold) and iron ore in 2019, we believe that precious metals and iron ore miners should continue to deliver attractive earnings growth if spot prices hold. There is less homogeneity in the diversified mining sector than in the PGM space. We prefer iron ore exposed diversified miners to those with no exposure such as South32 or Glencore. However, Glencore, is unfavoured due to investigations by several entities including the US Department of Justice (DOJ) over Glencore’s compliance with the US Foreign Corrupt Practices Act. The recent rally in the Brent crude oil price and a relaxation of covenants have alleviated some of the concern around Sasol’s requirement for an equity raise. However, weak chemicals prices will pressure Sasol’s earnings as Lake Charles ramps up. Within the paper and pulp sector, we prefer Mondi over Sappi due to the former’s superior return on capital and capital allocation history.
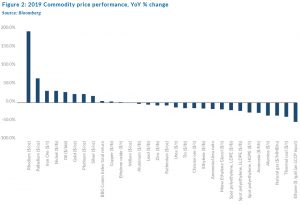
In our view, the largest risk factor for the commodity sector remains global growth, particularly Chinese growth. Continued weakness in global car sales pose a threat to PGM prices as 40% of platinum and 80% of palladium demand comes from the auto sector.
Car sales fell c. 4% YoY globally in 2019 – the largest decline since 2008. Intuitively the weak car sales number should have negatively impacted sentiment across the PGM basket of commodities, however changes to environmental legislation has resulted in increased demand for palladium as loadings (the amount of palladium used in catalytic convertors) were increased by regulators in the wake of all the carbon cheating by car manufacturers. In terms of iron ore, a faster-than-expected recovery in Vale’s ore output in 2020 would also put pressure on iron ore prices (following the January 2019 mine tailing dam wall disaster iron ore prices soared and Vale hasn’t recovered to full production yet). The largest upside risk to the resources sector remains greater-than-expected global economic growth. Chinese stimulus, in particular, has the potential to support base and ferrous metals.
Naspers/ Prosus
It was a memorable year for Naspers where management have been actively trying to address the elephant in the room, that being the large discount to net asset value the company continues to trade at. In February, the pay TV asset, Multichoice was successfully unbundled and separately listed which left Naspers as a pure play consumer internet business, with a primary focus on the high-growth EMs around the world.
Later in the year, Naspers announced its intention to carve out the ex-SA assets and list these in Amsterdam thereby opening up to a new set of shareholders previously unable to access the shares due to limitations on investing in the ‘higher-risk’ JSE.
The corporate actions saw Naspers deliver a total return of 21.55% for 2019, outperforming its largest underlying asset (Tencent) by 3%. It is highly likely that, over the short- to medium-term, the prospects of Naspers (and now Prosus) will remain largely dependent on the performance of Tencent which is expected to growth EPS by c. 20% YoY in 2020. Trading on a forward PE multiple of 28x, in line with its long-term average, we wouldn’t expect much in the form of an additional rerating from Tencent. Our base case is that the rating will be unchanged giving us a total return expectation in line with its earnings growth of 20%. As a result, we have kept an overweight position in Naspers/ Prosus.
Rand-hedge shares
Making up the rest of the index is a list of shares referred to as rand hedges, which pertains to the fact that domestic factors such as GDP growth and political whipsawing have very little influence on the operations, earnings and future prospects of these companies.
Within this cluster, British American Tobacco (BATS), which ended 36% higher YoY in 2019, and Reinet (a BATS proxy) made the greatest contributions to the index’s total return. BATS shares rebounded sharply in 2019, after a few years of underperformance as sentiment weighed on the future prospects of the global tobacco industry, which is plagued by increasing regulatory pressure, alternative products taking market share from traditional cigarettes and, in the case of BATS, a growing debt burden amassed after a series of acquisitions. The underperformance of the shares seems to be more sentiment driven rather than as a result of a significant decline in operating profit, which remains healthy.
With earnings expected to grow in the mid-single-digits this year and the share trading at 10x estimated forward earnings one year out (a large discount to the 10-year average of 14x), we continue to retain exposure to BATS via shares we own directly and a position in investment holding company, Reinet.
Luxury jewellery and watch maker, CFR Richemont had a disappointing year relative to global luxury peers. Nevertheless, the share price still ended up 20% for 2019, adding 0.3% to the index. Trading at a forward PE multiple of 21x (vs a long-term average of 19x) and with earnings expected to grow by 14% YoY in 2020, we see CFR as fairly valued, with no obvious opportunity being presented.
SA equities conclusion
Not much has changed in terms of our views or positioning in SA- listed equities. We are underweight companies that are very reliant on domestic economic growth and sentiment, while retaining modest exposure to those companies we believe will continue to outperform in a tough environment and remain cognisant of some very appealing valuations. We are largely neutral on the materials sector, where earnings momentum screens as the most attractive and free cashflow yields remain healthy at spot commodity prices. Philosophically, we will always be nervous holders of materials companies, or any company with a largely commoditised top line. To complete the picture of our domestic positioning we are overweight rand-hedge shares. Naspers/ Prosus, Bidcorp, Reinet and Investec (50/50 between SA and UK), remain key calls for us as we position ourselves for another volatile period.
At an index level our total equity return expectation is in the region of 10.1% for the year, this implies 6.3% from earnings growth with no meaningful rerating.
SA BONDS
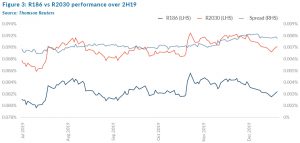
The local currency has shown major fortitude in 4Q19 – on 1 October 2019 the rand vs US dollar exchange rate stood at R14.82/$1, by the end of 2019, the rand had strengthened to R14.01/$1 – just below 6% worth of currency strength in the quarter. The benchmark R186 bond strength was more muted, moving from a yield of 8.32% to 8.245%. The curve has steepened slightly over the quarter reflecting concerns about the country’s long-term outlook. 5-year credit default swaps (CDS) traded at 164bps to 192bps throughout the quarter, essentially ending the year where it began at ~160bps. The US 10-year bond yield traded in a band from 1.5% to 1.95%, ending the year at 1.9%.
The net result of the above has been an All Bond Index (ALBI) 4Q19 return of 1.73% – this compares favourably with the ALBI return of 1.36% in 3Q19. The ALBI closed 2019 with a net return of 10.5% – a strong year for local bond holders.
We also note that the R186 benchmark bond is now under 7 years to maturity and that the R2030 is a near exact 10-year bond. The spread between these two has increased by 10bps over 2H19, from 70bps to 80bps – further emphasizing the slight steepening of the SA bond curve.
Looking to 2020, the local political situation has survived some major flashpoints in 2019, most specifically the delivery of another budget indicating increased deficits – leading to a projected debt/GDP of above 70% in the medium term.
However, political indications (such as the unwillingness to give another full bailout to SAA during the strike action) as well as direct actions (as seen in prosecutions and deeper investigations into state capture actors) have allayed the downgrade fears in the short term.
Importantly, these risks will remain for as long as government runs large deficits and growth remains anemic, decreasing the former and increasing the latter remain the key fiscal objectives for government heading into this decade.
The global risks from 2019 carry into 2020, the Tory majority in the UK gives some support to British pound-denominated assets and drives clarity on Brexit, but final negotiations on the trade agreement are highly unlikely to see a resolution before the end 2020 deadline – meaning some level of uncertainty remains. Looking to the US, Trump’s phase-1 trade deal with China was agreed on in December 2019, but risks remain heading into the 2020 US election cycle.
The Democratic presidential lead candidates are beginning to take shape and the risk to SA bonds remains a risk-off market sentiment in the lead-up to that event, which takes place on 3 November 2020.
Current bond yields thus remain tied to the above risks. We view long-run SA inflation at 4.5% and US inflation at 1.7%, a differential of 2.8%. The long run 10-year CDS spread of 270bps and a US fair yield of 1.9% results in a fair value of the 10-year benchmark at 7.4%.
Given the premium required to hold rand over US dollar and political uncertainty, this is modelled up to 8.2%. This compares with the band of 8.17% to 8.575% that the bond has traded in over 4Q19. This leaves some room for capital growth as well as a return of over 4% above inflation with a total return of about 9.3% on the benchmark R186 bond.
SA-LISTED PROPERTY
Even though decreasing share prices have led to higher dividend yields in the SA property sector, investors have not yet regained confidence in local property counters. In 4Q19, and for calendar 2019, the SA property sector underperformed cash, fixed income and equities, this even after the terrible 2018 the sector experienced.
The overall SA macro outlook for 2020 still has clouds on the horizon, including Eskom, SAA, the Government’s inability to implement investment-friendly structural reforms, as well as global recession fears, and it seems unlikely that landlords will be able to wave a magic wand and have the local property sector return to its glory days. Tenants will remain under pressure, at least for the near term, and rental negotiation terms agreed will continue to reflect the reality of this situation. However, the capital depreciation experienced over the past two years does mean that many share prices in the sector have de-rated to the extent that large discounts are available in the listed property sector when compared to physical asset valuations. The truth, as it often does, probably lies somewhere in the middle of this anomaly, providing potential upside to share prices, although it will probably require some passage of time to find an “agreed” clearing price.
Share prices reacted poorly to dividend reductions in 2018 and 2019, but we believe that any sign of stabilisation of this trend – even for some stocks where dividend prospects are negative, but the trend is improving – could be a meaningful inflection point. Also, an important document came out on 13 November, which should add some backbone to future investor confidence. Historically, property company accounting standards were not closely scrutinised in SA. The woes of the past two years meant that this would no longer be acceptable and the JSE and the Association for Savings and Investment SA (ASISA) were involved in the construct of the Best Practice Recommendations for standardised accounting practices. This becomes effective for companies with financial year-ends commencing after 1 January 2020, although early adoption is being encouraged. The two main advantages for analysts and investors are:
- SA REIT Funds From Operations (FFO) per share will replace distributable EPS as the primary supplemental performance measure.
- Non-IFRS metrics can no longer be applied as broad principles but require step-by-step disclosure that can easily be reconciled back to the reported IFRS accounts.
Again, this may take time as some year-ends will only happen in late 2021 when this practice is compulsory, but it will lead to clean results and property income growth forecasts which are defined and transparent.
Overall, we believe that the sector will remain more volatile than it has in the past, and more in line with equity market and risk-on volatility than an income asset. Our 2020 forecast returns from the sector comprise a dividend yield of 9.8% and a capital gain of 0.3% (which in turn comprises income growth of 2%, but an exit yield of 10% – above forecast forward yield) resulting in a total return of 10.1%.
THE RAND
Projecting the rand’s value in a year’s time is a fool’s errand. The rand vs US dollar exchange rate is one of the world’s most volatile currency pairs and trades well away from any modelled fair value for long periods.
We note, however, that the rand trades within a R2.50 range to the dollar in most 12-month periods.
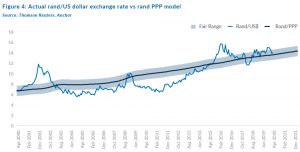
We retain our purchasing power parity (PPP) based model for estimating the fair value of the rand and we have extended this out by three months since our last Navigator’s publication.
Our PPP-modelled value for the rand vs US dollar at the end of the next 12 months is R14.10/$1 (See Figure 4). We apply a R2.00 range around this to get a fair value range of R13.10 to R15.10/$1.
We note that the rand ended 3Q19 at R14.01/$1, which would imply a 1% weakening to get to the mid-point of our fair range at the end of 2020. We expect that 2020 will be particularly volatile as the risks around rating actions, fiscal deficits and politics all play out domestically. Global factors are probably more aligned towards being supportive of the rand, but with elections and geopolitical risks keeping the currency markets volatile.
Global equity markets
We enter 2020 with global equity markets reflecting a mirror image of the start of 2019. While the end of 2018 saw the market nosedive (a 9% drop in December 2018), global markets rallied into the 2019 year-end, giving the MSCI World Index (+27.7% YoY) its best year of the decade. We are currently experiencing a liquidity driven bull market and, while momentum might well take the market higher, the risks of a shorter-term correction are increasing. We are comfortable remaining long-term investors in the global equity market at current (relatively high) valuations but would be strategic with the deployment of new capital into the market.
An equity return in the mid-single-digits is our base-case scenario for the year. This will be highly reliant on earnings growth materialising as projected by the market, since the capacity for a further increase in multiples seems limited. Market consensus earnings growth is in the region of 20% for 2020, although this includes several once-off factors and underlying growth is projected to be around 10%. The less bullish market commentators believe this could be aggressive, which is the primary risk for the year.
The last quarter of 2019 saw the market dismiss virtually all risks and in early 2020 even missiles and drone attacks in the Middle East have not dampened market enthusiasm. The biggest drivers of the market have been monetary policy easing (which is likely to continue), a more positive outlook for trade tensions and a lack of alternatives in a low-yield world. There has been little earnings momentum for the past six months.
Growth shares in the US have been the winning category for an extended period, but after material sustained outperformance, it makes sense to be increasing exposure to Europe and EMs. A slight change in bias towards value shares also looks warranted, although our investment philosophy supports growth shares over time. The run-rate turnover growth rate of around 17% for the big global tech companies is massive and we remain positively disposed to this segment of the market. We remind readers that tech is now 25% of global markets and generating piles of cash.
Europe appears to have improving growth momentum, although we are hesitant to invest too heavily in companies whose longer-term growth potential is limited. We are upweighting the UK as December brought the prospect of some clarity to the UK’s plans for exiting the European Union (EU) as UK voters delivered a strong mandate to Prime Minister Boris Johnson to proceed with his proposal of exiting by the end of January 2020. Johnson’s Labour government saw its representation in Parliament lifted from 46% to 56% as a result of the December election, giving them the comfortable majority needed to execute Brexit. Brexit clarity helped the British pound continue a rally which saw it rise over 10% since its August lows when the UK faced a real possibility of leaving the EU without a deal.
Figure 5 below shows the MSCI World Index at PE multiple levels of 17.2x, which is one standard deviation above the 15-year average. This would warrant some caution, although markets can stay at relatively elevated valuation levels for extended periods if earnings growth is maintained. We will be assessing this carefully.
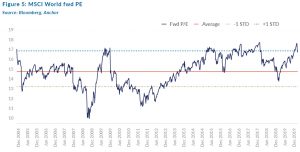
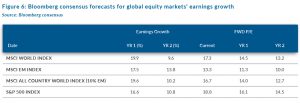
Figure 6 below shows the different market segments and valuations. EM earnings growth is projected to be strong for the next two years, which would probably result in strong market performances. The biggest risk to this outcome is geopolitical tensions rising, pushing up the oil price and stoking inflation.
We are in the midst of a strong bull market and it is always difficult to call the top. The logical approach is to gradually reduce exposure and redeploy capital on pullbacks. However, for long-term investors, trying to time the market is often not a value-added approach and we are still able to identify attractively priced growth shares to construct an attractive portfolio. And remember … the unpredictable president of the US needs the market to be flying towards the end of the year to nudge voters to put an X in the Trump box when the November US election takes place.
Global bonds
At the beginning of the previous quarter (3Q19) as we contemplated what could happen to US interest rates over the next twelve months, we were faced with that harbinger of doom, an inverted US yield curve, and a market expecting three rates cuts by the end of 2020. We got one of those rate cuts (in October) and financial markets have subsequently moderated expectations, with less than a 30% chance of getting both other cuts by year-end and only a 70% chance of getting at least one more cut in 2020. The US yield curve has since normalised with US 10-year government bond yields trading about 0.3% higher than US 6-month government bond yields (the widest that spread has been since 2018). Part of the calm in interest rate markets has come from the Fed action to alleviate short-term funding problems.
The Fed has started to increase the size of its balance sheet again, something it theoretically needs to do in the normal course of business to counteract the increasing supply of physical US dollar cash in the system – the cash supply typically grows in line with nominal GDP growth. The Fed is at pains to point out that this increase in the size of its balance sheet is not quantitative easing (QE) and, while in theory they are correct, in practise it’s a case of “a rose by any other name would smell as sweet.” This injection of additional liquidity has gone a long way towards easing financial market conditions.
So, with the major global central banks all back to providing regular liquidity to financial markets and relatively low expectations for changes in monetary policy, we think that geopolitics is the only issue that could occasionally derail the relative calm in markets. We see no reason to change our expectations from three months ago which are that we’ll see one more rate cut from the Fed this year (probably mid-year as US politicking reaches a crescendo before the presidential election). We expect that with Christine Lagarde newly installed as the head of the European Central Bank (ECB) there will be few surprises as she errs on the side of caution in her first year in the job. So, with everything remaining relatively sanguine at global central banks, we see no reason to tinker with our 12-month US 10-year government bond yield forecast, leaving it at 1.9% and giving investors a total return of 1% in US dollar terms over the next 12-months.
In corporate bonds, we’ve seen a strong rally again in the latter half of 2019 and US investment grade credit spreads are back to below 1% for the first time since the euphoria of early 2018. We think this is unsustainable and we continue to expect a gradual, late-cycle deterioration in credit quality and spreads resulting in only a 0.4% total return in US dollar terms from US investment-grade bonds over the next twelve months.
Global property
Real estate was one of the worst-performing asset classes in the final quarter of 2019. In fact, real estate was the only S&P 500 sector to end the decade with a negative quarter. US long-term interest rates climbed 0.25% during the quarter as the Fed delivered a liquidity injection to deal with short-term funding problems and the US and China took some baby steps towards a trade deal. Real estate stocks generally struggle when rates are rising and that explains a lot of what happened in 4Q19.
The US was the region hit hardest in 4Q19 and besides the headwind from rising rates, there were some sectors that continued to struggle. Earnings results from health care real estate investment trusts (REITs) showed that challenges resulting from low occupancy rates and costs growing faster than revenues remained a problem. The enactment of new legislation on rent controls for high-cost West Coast markets and New York City will also create a slight headwind to rental growth for some of the larger US residential REITs and a pick-up in store closings showed that the pain is far from over for US retail REITs. On the other end of the spectrum, UK REITs had a stellar quarter, up over 20% in US dollar terms as the UK moved towards the realistic prospect of an orderly Brexit.
The spread of dividend yields over bond yields is on the high-end of what’s typical and so it’s likely we’ll see that gap close over time, although with at least part of that narrowing coming from higher bond yields. We think that it’s unlikely we’ll see a meaningful re-rating in developed market REITs over the next twelve months. That leaves us expecting a total return in US dollar terms from the asset class of about 5.9%, with 3.9% coming from yield and the rest from income growth.