Executive summary:
- The US dollar is by far the most dominant global currency, finding itself on one side of c. 90% of all foreign exchange (FX) transactions, the denomination of around half of all foreign currency debt, the currency in which c. 50% of all global exports are billed and the currency in which c. 60% of all foreign reserves are held by governments around the world.
- FX transactions, which facilitate global trade and investment, function on systems and processes facilitated by intermediaries predominantly domiciled and regulated in major developed market (DM) economies (the US, the EU, the UK, Japan and Switzerland).
- Major DM currencies are issued by central banks with transparent and politically independent mandates and well-tested mechanisms for supporting liquidity which underpin the store of value for their respective currencies.
- Legal recourse, if FX participants renege on their obligations, is well understood and well tested within the gambit of the current, DM-major dominated FX market.
- Speculation around the demise of the current US dollar-centric FX market is often based on geopolitical considerations (e.g., countries looking for ways to avoid being subject to the regulations and/or sanctions imposed by the US with regard to the use of much of the existing global financial architecture).
- Countries looking to work around the incumbent FX market structures may expose themselves to operational risk, liquidity constraints, increased uncertainty around legal recourse and enforceability and exposure to currencies where the store of value is subject to issuing authorities that lack transparency.
- China’s increasing global economic impact makes it amongst the most likely to catalyse a shift away from the current DM major currency-dominated system. However, the five DM majors still represent c. 45% of global trade and c. 50% of global GDP (vs China with c. 12% of global trade and 18% of global GDP).
- The indebtedness of the DM majors and their reliance on foreign funding is also suggested as a source of fragility to their existing dominance. Most rely on foreign funding for 30%-40% of their government debt, though, for many, their major allies heavily finance that (the DM majors finance at least half of foreign-funded US government debt vs c. 10% funded by China).
- Recent examples where China has worked with trade counterparties to circumvent the use of the US dollar (including Brazil, India, Russia, and Saudi Arabia) show that efforts to disintermediate the US dollar and other major DM currencies are already underway, though, for context, these four nations collectively represent only c. 6% of global trade.
- We believe it will be years, if not decades, before the incumbent DM currency majors are materially displaced. As such, we think it is prudent in most instances to continue to use the US dollar as the base currency for managing clients’ global wealth, where assets are custodied by well-regulated institutions. In addition, if needed, there is a clear path of legal recourse to protect assets.
- From an investment perspective, we monitor the relative valuation of the US dollar against the other major DM currencies to identify tactical investment opportunities. Using the most established currency valuation metrics, real effective exchange rates (REER) and purchasing power parity (PPP), we currently see the US dollar as c. 20% expensive against the euro and the British pound, 5%-10% overvalued relative to the Swiss franc and as much as 40%-60% overvalued vs the Japanese yen. We caution that currencies can maintain these relative valuation mismatches for extended periods.
The Bank for International Settlements’ (BIS) Triennial Central Bank Survey captures currency trading activity across 52 jurisdictions for 56 currencies. The most recent report (April 2022) shows the following:
- Turnover in global FX markets reached US$7.5trn/day in April 2022 – a volume that is 30 times greater than daily global economic activity (GDP).
- Around 80% of all FX trading activity takes place in five major financial centres.
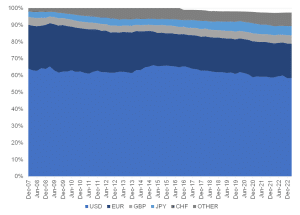
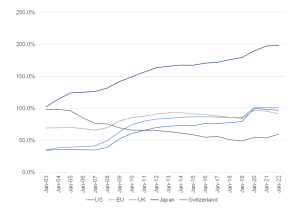
- The US dollar was on one side of c. 90% of all FX trades in April 2022 (consistent with the level of US dollar activity seen for the past few decades)
- The Chinese renminbi’s share of FX transaction turnover has increased from 1% 20 years ago to 7% more recently.
Figure 1: Share of FX transactions by currency
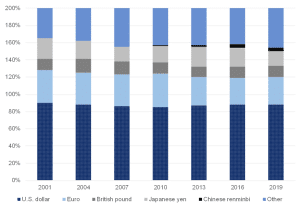
Note: On a net-net basis at current exchange rates. Percentages sum to 200 percent because every FX transaction includes two currencies. The Chinese renminbi is 0 until 2013.
Source: BIS Triennial Central Bank Survey of FX and OTC Derivatives Markets
A significant amount of the US dollar’s use in currency transactions is as a “vehicle currency” for FX transactions (i.e., when non-US dollar pairs are not exchanged directly but via the US dollar, e.g., for a transaction from SA rand into Brazilian real, there will typically be two trades in the background – SA rand to US dollar and US dollar to Brazilian real). This is estimated to account for c. 40% of US dollar transactions.
US dollar dominance extends to many FX metrics beyond its dominance of FX transaction volumes. The US dollar’s influence is often multiple times the size of the next most dominant currency, with the US dollar having consistently held that dominant position for an extended period. Notable areas where the US dollar has a disproportionately large influence are:
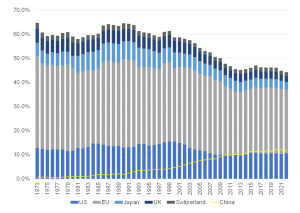
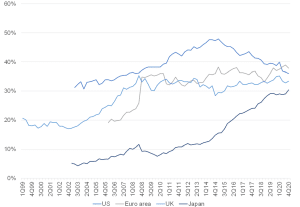
- The US dollar has a dominant footprint in offshore funding markets. About 50% of all international debt securities and cross-border loans are denominated in US dollars. The amount of borrowing where neither the borrower nor the lender is a US resident is c. 88% of international US dollar-denominated debt (bonds) and 65% of US dollar-denominated bank loans.
Figure 2: The share of foreign currency debt issuance by currency
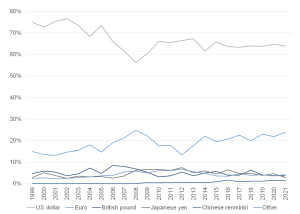
Note: Foreign currency debt is denominated in a foreign currency relative to the issuing firm’s country (not the issuance’s location). At current exchange rates. Data are annual and extend from 1999 through 2021 (2021 is 1H21). The Chinese renminbi is 0 until 2008.
Source: Dealogic, Refinitiv, US Federal Reserve Board staff calculations.
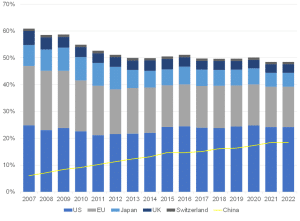
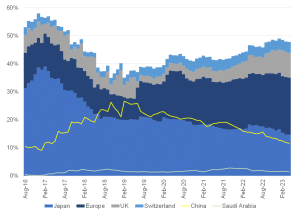
- The share of exports billed in US dollars – around half of all global exports are billed in US dollars, though this tends to vary by region.
Figure 3: The share of export invoicing by currency per region
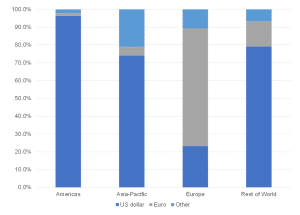
Source: IMF Direction of Trade, Central Bank of the Republic of China, Boz et al. (2020); US Federal Reserve Board staff calculations.
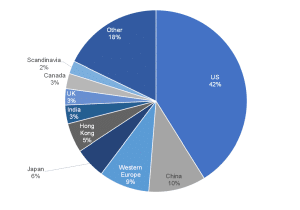
This disproportionate share of global trade billing happens even though the US accounts for only c. 10% of international trade.
Figure 4: The share of global trade by region/country
Source: Anchor, IMF
- The share of foreign reserves held by countries globally (with the US dollar’s share almost three times that of the next largest currency – the euro).
Figure 5: FX reserves by currency
Source: Anchor, Bloomberg, IMF
There has been much speculation around the demise of the US dollar’s unrivalled international role. The arguments supporting this thesis are usually based on the following:
- China’s growing role in the global economy, where it is expected to surpass the US in becoming the world’s largest economy in the next decade.
- Developments in technology (e.g., crypto).
- Geopolitical considerations (e.g., countries looking to avoid being subject to the US’s regulations and/or sanctions regarding using much of the existing global financial architecture).
- Increasing public and private debt levels in the US.
In this note, we try to address some of those arguments by putting their influence into context relative to the main drivers of the FX market functioning. Still, before we get there, it makes sense to point out some facts supporting the status quo of US dollar dominance.
The benefits of the current system of US dollar dominance include the following:
- The current processes and systems for transacting in these currencies have been established and refined over decades and stress-tested through multiple crises.
- Experienced, credible, and well-regulated intermediaries control the processes and systems.
- Foreign exchange transactions for global trade or investment involve at least two counterparties with obligations they must fulfil. The legal recourse and enforcement if participants renege on their obligations, are well established through years of case law.
- The concentration of transactions in the major global currencies increases the liquidity of those transactions (and avoids the potential for higher costs inevitably associated with transactions in less liquid instruments).
- The currencies that currently back the majority of FX transactions are issued by central banks with well-established, transparent, and politically independent mandates that support liquidity and store of value. The US Federal Reserve’s (Fed’s) handling of the liquidity stresses for US dollar investors at the start of the recent pandemic are testament to this.
To shift away from US dollar dominance in global FX trading, particularly to the extent that the shift is towards currencies that are not already well-established incumbents (e.g., euro, Japanese yen, Swiss franc, or British pound), the transacting participants must be willing to expose themselves to the following potential risks:
- Operational risks associated with transacting via less established systems and processes.
- Higher costs associated with transacting where there is likely less liquidity.
- Increased uncertainty around legal recourse and enforceability if transacting counterparties renege on their obligations.
- Reliance on financial intermediaries where regulatory supervision is less transparent.
- Exposure to currencies where the central banks involved in issuing and regulating the currencies may operate with low transparency or be subject to political interference that could materially impact the value or liquidity of the particular currency.
These potential risks may be perceived as immaterial by some transacting participants willing to shift to less well-established ways of transacting and investing internationally. In contrast, for others, the costs and risk will be an acceptable price to extract themselves from the disproportionate influence that the US and other incumbents have on the current global trade and investment system. It is important to remember that for these new systems of transacting and investing globally to be adopted, both sides of the transaction must agree to the shift.
The Chinese renminbi is held up as a real challenger to the US dollar, given the strong likelihood that the Chinese economy will become the largest in the world over the next decade and that China plays such a significant role in global trade. However, there are significant roadblocks to more widespread use of the Chinese renminbi, including:
- The renminbi is not freely exchangeable,
- the Chinese capital account is not open,
- investor confidence in Chinese institutions, including the rule of law, is relatively low.
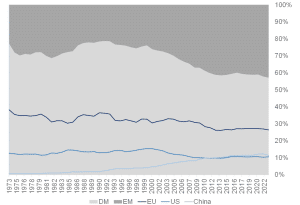
While China has made great strides towards the role of the world’s dominant economy and has achieved that at least partially via a dramatic increase in its share of global trade, its share of global trade remains only marginally ahead of that of the US and still well behind Europe’s share of global trade. While the five incumbents that currently dominate global FX trade and foreign reserves (US dollar, euro, Japanese yen, British pound, and Swiss franc) have lost share of global trade and economic activity to China over the past couple of decades, they collectively still maintain a healthy global lead over China.
Figure 6: The share of global trade by country/region
Source: Anchor, Bloomberg, IMF
Figure 7: The share of global GDP by country/region
Source: Anchor, Bloomberg
We have recently seen China agree with several of its trade counterparties to transact directly in the relevant countries’ currency pairs to start working around the established systems of global FX trade. Countries that China has worked with in this respect include Russia, Brazil, India, and Saudi Arabia, though to put these deals in context, those countries collectively represent only around 6% of global trade.
Figure 8: The share of global trade by country/region
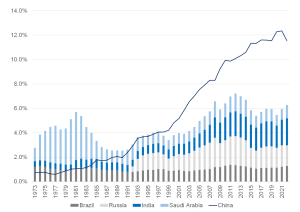
Source: Anchor, Bloomberg
Much has been written about the US’s vociferous appetite for debt and how that might expedite its demise at the centre of the global financial system. To put this into context, the US remains similarly indebted (relative to the size of its economy) compared to most other major DM economies.
Figure 9: The share of government debt as a percentage of GDP by country/region
Source: Anchor, Bloomberg
To a certain extent, these major DM economies rely on foreigners to finance a portion of this debt.
Figure 10: The share of government debt held by foreigners by country/region
Source: Anchor, Bloomberg
This reliance on foreign funding, particularly to the extent the source is countries looking for a way out of the existing system dominated by the US, is also cited as a possible risk to the US dollar dominance, but here we note that at least half of the US government’s foreign debt financing (i.e., c. 15% of overall US government debt) is funded by the US’s DM allies. Although material, China’s funding of US debt has decreased to around 10% of the US government’s foreign funding or 3%–4% of overall US government debt. Recent geopolitical animosity between the US and Saudi Arabia was also cited as a risk to US government funding should the Saudi petrodollar savings be redirected away from funding the US government. This appears to us as unlikely to have an immaterial impact.
Figure 11: The foreign funders of US government debt by country/region
Source: Anchor, Bloomberg
So, the quantum of these recent shifts to disintermediate the US dollar is still relatively immaterial relative to the size of the global FX market. Our base case is that other incremental shifts away from the current systems and processes are likely to happen slowly enough to ensure the status quo of US dollar dominance will be around for years if not decades.
While we will continue to monitor the progress of any shifts in this direction, for now, our default remains taking a prudent approach to managing the global wealth of our clients and denominating it in currencies where established transparent and highly regulated intermediaries are involved in the custody of our clients’ assets and where there is clear legal recourse in the unforeseen circumstances where reneging counterparties put our clients’ assets at risk. We use the US dollar as the base currency for most of our clients’ global wealth, except when there are specific needs for other currencies. The bulk of investment opportunities remain US dollar-denominated, and this also minimises the frictional cost associated with transacting away from our clients’ base currency.
Figure 12: Globally listed stocks, share of market cap by listing domicile
Source: Anchor, Bloomberg
We constantly monitor the relative valuations of the major currencies we predominantly invest in for our clients. For this, we use the most established currency valuation metrics, REER and PPP.
REER is a method of creating an index for each currency based on its exchange rates with a basket of its largest trading partners, weighted according to the relative quantum of trade with each of those partners and then adjusted for inflation.
Finance theory suggests that a country with lower relative inflation should see its currency appreciate to maintain PPP. This equilibrium is supported in practice by the ability of citizens of the country with higher inflation to import goods from those countries with relatively lower inflation (because the prices will not have risen as much in that country). Importing those goods will create demand for the country’s currency with lower inflation, causing it to appreciate and restore exchange rate equilibrium. In addition, central banks generally set interest rates based on prevailing or anticipated inflation rates, and the relative yields (carry) further reinforce purchasing power. Calculating how currencies have fared relative to how PPP suggests they should have, is very sensitive to the starting point of that calculation. To mitigate against this, we generally average the calculation over various starting points.
To this extent, we view the US dollar as overvalued relative to the other liquid FX majors and factor this into our broader investment decision-making process.
It must be noted that currencies can remain relatively undervalued or overvalued based on REER and PPP for extended periods.
The following section compares the major currencies against the US dollar on our two favoured currency valuation metrics.
The euro vs the US dollar
The euro looks to be c. 18% undervalued against the US dollar.
Figure 13: The euro vs the US dollar on a REER basis
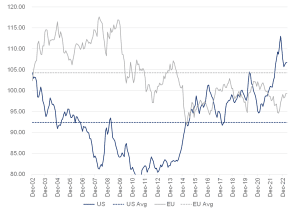
Source: Anchor, Bloomberg
Figure 14: The euro vs the US dollar on a PPP basis
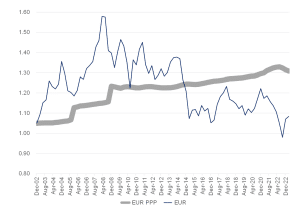
Source: Anchor, Bloomberg
The British pound vs the US dollar
The British pound looks to be c. 20% undervalued against the US dollar.
Figure 15: The British pound vs the US dollar on a REER basis
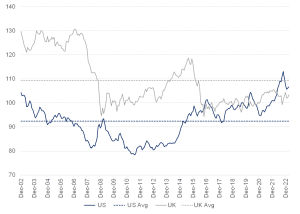
Source: Anchor, Bloomberg
Figure 16: The British pound vs the US dollar on a PPP basis
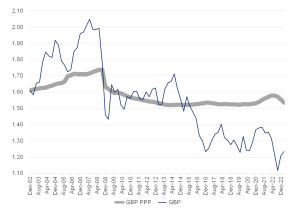
Source: Anchor, Bloomberg
The Japanese yen vs the US dollar
The Japanese yen looks to be 40%-60% undervalued against the US dollar. However, this is relative to the valuation over the past couple of decades which has been heavily influenced by extreme monetary policy.
Figure 17: The Japanese yen vs the US dollar on a REER basis
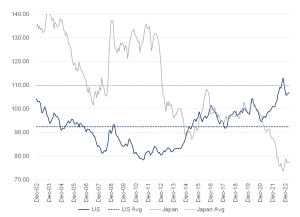
Source: Anchor, Bloomberg
Figure 18: The Japanese yen vs the US dollar on a PPP basis
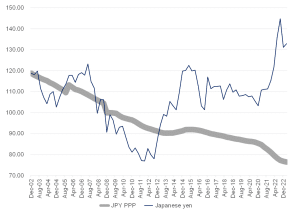
Source: Anchor, Bloomberg
The Swiss franc vs the US dollar
The Swiss franc looks to be 5%-10% undervalued against the US dollar.
Figure 19: The Swiss franc vs the US dollar on a REER basis
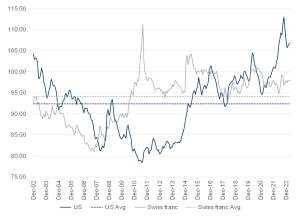
Source: Anchor, Bloomberg
Figure 20: The Swiss franc vs the US dollar on a PPP basis
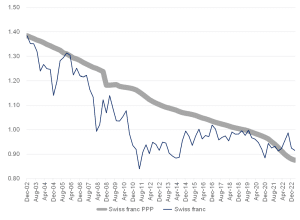
Source: Anchor, Bloomberg
Conclusion
We anticipate that China and many of its trade partners will continue to explore ways of disintermediating the incumbent system of FX transacting dominated by the DM majors. However, these incremental changes will likely be immaterial in terms of de-railing the dominance of the US dollar and its major DM peers for at least the next few years, if not decades. We are thus inclined to take a prudent approach to maintain the status quo of a US dollar base currency for the majority of our clients. In terms of our view on other DM FX majors relative to the US dollar, we sense that the US dollar looks relatively overvalued, and we will look to factor this into our broader investment decisions while remaining cognizant that these relative valuation mismatches amongst the major DM currencies can persist for extended periods.
At Anchor, our clients come first. Our dedicated Anchor team of investment professionals are experts in devising investment strategies and generating financial wealth for our clients by offering a broad range of local and global investment solutions and structures to build your financial portfolio. These investment solutions also include asset management, access to hedge funds, personal share portfolios, unit trusts, and pension fund products. In addition, our skillset provides our clients with access to various local and global investment solutions. Please provide your contact details here, and one of our trusted financial advisors will contact you.