The Global Markets
After the strong start on equity markets in January, most world markets (MSCI World -2.4% MoM/+4.6% YTD) came under pressure last month, weighed down by higher-than-expected US inflation data, dashing hopes that the US Federal Reserve (Fed) will soon be able to pause its monetary tightening and possibly cut rates before the end of this year. Instead, stubbornly high inflation saw expectations re-emerge that the Fed would rather continue to ramp up rates for a while to come. The latest Fed meeting minutes also showed that most Fed officials agreed that high inflation risks remained a “key factor” in shaping monetary policy and warranted continued rate hikes until it was under control. Worries around US/China relations over Russia also weighed on sentiment.
While US January inflation slowed again, it was by less than the market had anticipated, with headline consumer price index (CPI) data coming in at 6.4% YoY vs December’s 6.5% YoY print and market expectations of 6.2% YoY. Core CPI, which excludes the erratic food and energy components, also printed lower at 5.6% vs 5.7% YoY in December, but this was again higher than expected (forecasts were for 5.5% YoY). MoM, January CPI rose 0.5% vs December’s 0.1% decline. US January’s existing home sales dropped to the lowest level in 12 years, although the pace of the decline did slow. However, January consumer spending, which accounts for over two-thirds of US economic activity, jumped 1.8% – the biggest rise since March 2021. The December data were also revised to show spending dipping 0.1% instead of falling 0.2% as initially reported.
Read more about the US inflation rate and its effects on the market here.
The US Markets
On US equity markets, all three major indices ended a volatile month lower, with the Dow (-4.2% MoM) recording the biggest pullback of the three, wiping out its YTD gains (-1.5% YTD). The blue-chip S&P 500 slid 2.6% MoM (+3.4% YTD), while the tech-heavy Nasdaq closed February 1.1% lower (+9.4% YTD).
The European Markets
In Europe, Germany’s DAX ended the month 1.6% higher (+10.4% YTD), while France’s CAC Index closed February 2.6% up (+12.3% YTD). January euro area inflation printed at 8.6% YoY vs December’s 9.2%. Germany’s inflation rate continued to rise, increasing by 8.7% YoY (non-harmonised) in January vs December’s revised 8.1% YoY gain. This is as food and energy prices remained high due to Russia’s war on Ukraine. Compared with December, CPI advanced by 0.5%. France’s annual inflation rate also rose in February – to 7.2% YoY vs January’s 7.0% print, with the upward pressure again coming from higher food and energy prices.
The UK Markets
The UK’s blue-chip FTSE-100 Index recorded its best February performance since 2019, rising by 1.3% MoM (+5.7% YTD). UK January inflation eased for a third month, coming in at 10.1% YoY vs December’s 10.5% print. While this third consecutive monthly decline in inflation eased pressure on the Bank of England to raise interest rates and was the lowest reading since September 2022, it nevertheless remained stubbornly elevated at close to 40-year highs. Meanwhile, British Prime Minister Rishi Sunak signed a new trade deal with the EU on 27 February, designed to remedy any issues caused by the Northern Ireland Protocol.
The Chinese Market
Following January’s bounce in Chinese markets, investors took profit in February, and markets ended mostly in the red following a three-month rally that started when China began easing its strict zero-COVID policy. Hong Kong’s Hang Seng Index fell 9.4% MoM (0.0% YTD), while the Shanghai Composite Index gained a slight 0.7% (+6.2% YTD).
The Economic Data Front
On the economic data front, China’s factory activity bounced back further in February, with the official manufacturing purchasing managers index (PMI) jumping to 52.6 in February from 50.1 in January. The print exceeded expectations (50.5) and was the highest reading since April 2012. The official non-manufacturing PMI, which measures business sentiment in the services and construction sectors, also rose to 56.3 from January’s 54.4 print. The 50-point mark separates expansion from contraction.
Japan’s benchmark Nikkei gained 0.4% in February (+5.2% YTD), while economic data showed that the country’s economy had averted a recession, although it rebounded by much less than forecast in 4Q22. GDP grew 0.6% YoY in 4Q22 vs consensus expectations of a 2.0% rebound. The Japanese economy had slumped by 1.0% in 3Q22. Japan’s inflation rate rose to 4.3% YoY in January vs December’s 4.0% YoY print – the highest reading since December 1981, amid a rise in the prices of imported raw commodities and yen weakness.
February was also disappointing for commodities, with most coming under pressure. The Brent crude oil price was down 0.7% MoM (-2.4% YTD). Initially, reports of Russian production cuts and a rebound in Chinese demand had held oil prices firmer. Still, inflation fears, a warm winter in the US and Europe, and continued inventory builds eventually weighed on the oil price, sending it lower. Iron ore prices retreated by 0.8% in February (+4.6% YTD). After three consecutive months of increases, the gold price lost ground – down 5.3% in February (+0.2% YTD) as a strong dollar and hawkish Fed amid rising US inflation concerns weighed on the yellow metal, which hovered around two-month lows. The prices of platinum and palladium also fell – down 5.8% and 14.2% MoM, respectively. On the flip side, natural gas prices rose 2.3% MoM (-38.6% YTD), and thermal coal prices advanced by 3.8% MoM (-22.2% YTD).
Following South Africa’s (SA’s) FTSE JSE All Share Index’s impressive start to the year, February saw the index record a MoM decline of 2.2% (+6.4% YTD), with the FTSE JSE Capped SWIX also down 2.3% MoM (+4.5% YTD). Miners were the biggest drag on performance and the Resi-10 fell in February (-13.2% MoM/-7.1% YTD) as commodity counters struggled, while the SA Listed Property Index retreated by a further 0.7% for the month (-1.7% YTD). The Indi-25 gained (+1.7% MoM/+15.2% YTD), buoyed by positive performances from counters such as Anheuser-Busch InBev (+7.8% MoM) and Richemont (+5.5% MoM). The Fini-15 outperformed, advancing 2.5% MoM (+6.6% YTD). The performances of some of the biggest shares on the JSE by market cap disappointed, with BHP Group, the largest company on the exchange, down 6.8% MoM, while Prosus fell 3.7% MoM and Naspers lost 2.7% MoM. Other large-cap counters that recorded share price losses for the month included Anglo American Platinum (Amplats; -20.8% MoM), Sasol (-13.7% MoM), and Anglo American (-13.1% MoM). The rand weakened by 5.2% MoM (-7.2% YTD) against a strong US dollar with rising concerns about the impact of SA’s ongoing power crisis on the economy, further weighing on the local unit. At President Cyril Ramaphosa’s State of the Nation Address (SONA) on 9 February, the president declared a National State of Disaster – with immediate effect – as a response to the current energy crisis.
South African Economic Data
In SA economic data, January headline inflation, as measured by the consumer price index (CPI), cooled for a third consecutive month, coming in at 6.9% vs December’s 7.2% print. MoM, CPI decreased by 0.1% in January. The main contributors to the 6.9% annual inflation rate were food and non-alcoholic beverages; housing and utilities; transport; and miscellaneous goods and services. Food inflation jumped 13.4% YoY, reaching a 14-year high. According to Stats SA data, retail trade sales shrank in December, dropping by 0.6% YoY and MoM, as retailers and households dealt with ongoing loadshedding, the rising cost of living and elevated prices. November’s retail data were upwardly revised to a 0.8% YoY gain (from an initial reading of 0.4% YoY).
Finance Minister Enoch Godongwana delivered the 2023 Budget Speech in Parliament on 22 February. It was a reasonably neutral affair followed by a somewhat positive, albeit slightly muted, market reaction. Overall, the primary fiscal intent is unchanged, and the 2023 budget reiterates the government’s commitment to debt stabilisation via fiscal consolidation. However, loadshedding continued unabated, with the worsening energy crisis casting a shadow on SA’s future growth outlook, which was reflected in the weaker rand. In addition, on 24 February, the Financial Action Task Force (FATF) announced that SA would be greylisted (as was widely expected). This means that SA is seen as having compliance issues or shortcomings that threaten the international financial system, and it is a serious blow to a country’s reputation. A greylisted country is subjected to increased monitoring and must deal with adverse economic consequences for trade and transactions with other countries.
Figure 1: February 2023 20 best-performing shares, MoM % change
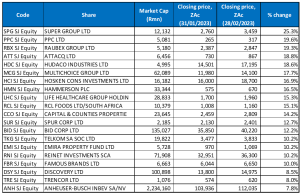
Source: Bloomberg, Anchor Capital
Month-on-Month Analysis: Best-Performing Shares
Super Group was February’s best-performing share, rocketing 25.3% MoM. The Group had its best day on the JSE in over two years on 2 February when its share price shot up c. 11% following a trading update. In the trading update, the company said that its headline profit could rise by at least 25% YoY for the six months to the end of December, while its headline EPS was expected to rise by between 25% and 35% YoY to as much as ZAc257.7 – more than 50% above pre-COVID-19 pandemic levels. The consulting and logistics company then reported strong half-year (1H23) results on 21 February, further buoying the share price. Super Group’s revenue advanced 34.6% YoY to R29.12bn, while diluted EPS rose 30.1% YoY to ZAc248.3. Operating profit improved by 26.1% YoY to R2bn from R1.59bn in the prior comparable period.
January’s best-performing share, PPC, which recorded a share price rise of 21.6% in the first month of 2023, came in second, increasing its share price by a further 19.6% MoM in February. The cement supplier’s share price jumped following reports that it is considering selling its Zimbabwean business for c. US$200mn. According to media reports, a local company involved in road construction and home building was interested in PPC’s Zimbabwe unit. Selling it will help PPC focus on its local operations, and negotiations are reportedly ongoing.
Infrastructure development and construction materials supply group, Raubex, which recorded a MoM share price gain of 19.3%, was February’s third best-performing share. Raubex was followed by property developer Attacq Ltd., Hudaco Industries and Multichoice Group, which recorded MoM gains of 18.8%, 18.6%, and 17.7%, respectively.
Attacq’s share price soared after it announced a proposed transaction with the Government Employees Pension Fund (GEPF), as represented by the Public Investment Corporation (PIC), to fund a R2.8bn Waterfall City development. The GEPF will acquire a 30% stake in the ordinary shares and shareholder loans held in Attacq Waterfall Investment Company (AWIC) for c. R2.5bn and R300mn into AWIC as a shareholder loan. AWIC is a wholly owned subsidiary of Attacq, holding its completed real estate portfolio and development and leasehold rights in Waterfall City (including developments under construction and leasehold land). If the deal goes through, the proceeds will reduce the loan-to-value (LTV) ratio from 37.2% to c. 24%, with management indicating the proceeds will be used to reduce debt and potentially for share buybacks. Meanwhile, despite a challenging operating environment, automotive and industrial products company, Hudaco reported in its FY22 results that its turnover rose 12% YoY to R8.15bn from R7.26bn posted in FY21, while its headline EPS increased 22.0% YoY to R20.07.
Hosken Consolidated Investments (HCI), Hammerson Plc, Life Healthcare, and RCL Foods posted MoM gains of 16.9%, 16.5%, 15.3% and 15.1%, respectively. On 15 February, Life Healthcare’s share price surged as much as 13.9% after the hospital group released a trading update for the four months to 31 January and said it had received “several unsolicited proposals” for its UK-based AMG business. Life said that overall paid patient days increased by c. 13.0%, increasing overall occupancies from around 55.0% recorded in the prior year to c. 62.0%. Moreover, the Group said it had witnessed strong underlying operational performance across all its markets during the review period, maintaining momentum and robust cash generation.
Food Group, RCL Foods Ltd (+15.1% MoM) said in a trading update for the six months ended December 2022 that it expects its HEPS to be 26.8% and 20.1% lower YoY to between ZAc53.20 and ZAc58.10. RCL added that the expected decline from the comparative period was primarily due to Rainbow Chickens and its Baking business unit.
Figure 2: February 2023 20 worst-performing shares, MoM % change
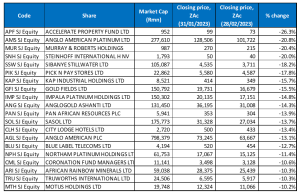
Source: Bloomberg, Anchor Capital
Month-on-Month Analysis: Worst Performing Shares
Diversified real estate investment trust (REIT), Accelerate Property Fund was February’s worst-performing share, declining by 26.3% MoM. Last month, Accelerate said it is selling its Ford Fourways building (a motor retail property) for R80mn at a 8.9% yield to its lessee Hatfield Property Holdings. Accelerate will use the proceeds of the sale to pay off debt and/or reinvest the funds into its portfolio. Separately, Accelerate said its intention to raise R50mn by way of a rights offer had been given the go-ahead. It will issue 71,248,571 ordinary shares for ZAc70 per rights offer share in the ratio of six rights held at the close of business on 8 February. Proceeds of the rights offer will fund Accelerate’s working capital requirements to right-size the business and “strengthen its financial position”.
Amplats (-20.8% MoM), in second spot, reported disappointing FY22 results last month. The results showed that its earnings (-38% YoY) and free cash flow per share (-66% YoY) were down significantly due to a decline in the platinum group metals (PGM) basket price and as high costs and lower volumes ate into the Group’s bottom line. The three main metals (platinum, palladium and rhodium) contribute 83% of its revenue. In US dollar terms, platinum was down 11%, palladium was down 15%, and rhodium fell 20%. However, this was somewhat offset by an 11% weakening in the rand vs US dollar exchange rate over the period. Still, PGM prices declined from their all-time highs reached in 2021. Amplats also cut its full-year dividend payout by R50bn following the plunge in profit, with the miner saying it will pay out R115/share, or R30bn to shareholders, vs R300/share, or R80bn, in FY21.
February’s third worst-performing share was Murray & Roberts (-20.4% MoM). Last month, the construction Group released a trading update which showed that it expects to report a major loss for 1H23 after the company encountered liquidity problems in 2022. Its interim headline loss per share is expected to slump to between ZAc323 to ZAc321/share for the interim period compared with ZAc13/share profit in 1H22. As of 31 December 2022, Murray & Roberts said that its order book stood at R16.1bn (1H22: R18bn excluding discontinued operations), and its project pipeline remained strong.
Murray & Roberts was followed by Steinhoff, Sibanye Stillwater and Pick n Pay Stores, which recorded MoM declines of 20.0%, 18.2%, and 17.8% in February. Steinhoff, with its high debt burden, continued to fall in February. On 9 February, the company announced that it had raised R4.9bn by selling 265mn shares, or 7.2%, of discount retail subsidiary Pepkor Holdings. Following the sale, Steinhoff’s interest in Pepkor will decline to c. 43.8% from 51%. Sibanye Stillwater reported FY22 results this week, which showed that its revenue decreased to R138.29bn from R172.19bn posted in FY21, while diluted EPS fell 42.4% YoY to R6.50. 2022 was a year of operational disruptions for the Group with a strike at its gold business in 2Q22, a seven-week closing at its US PGM business due to an extreme weather event, production impacts from higher loadshedding in the last four months of the year, copper cable theft at its SA PGM business (up four times between 1Q22 and 4Q22), while volumes were down across the business as a result. The other drag on its earnings was the decline in PGM prices.
The industrial, chemical and logistics company Kap Industrial Holdings (-15.7% MoM), in its 1H23 results, indicated that its revenue increased 12% YoY to R15.27bn, compared with R13.65bn posted in 1H22 while its diluted EPS fell 17.3% YoY to ZAc30.20. Earnings before interest, taxes, depreciation and amortisation (EBITDA) declined by 2% YoY, while operating profit before capital items fell 8% YoY. Group CEO Gary Chaplin said subdued consumer demand led to lower sales volumes. In terms of its downstream market customers, including polymer sellers, retailers selling mattresses and furniture, and the automotive industry, they were impacted by loadshedding more than others, hitting KAP volume sales. Chaplin noted, “To mitigate that, we are exploring new export markets that can allow us to continue to run our production and export products,” adding, “We are seeing opportunities opening up in certain European markets.”
Rounding out February’s ten worst-performing shares were Gold Fields, Impala Platinum (Implats), and AngloGold Ashanti, with MoM declines of 15.5%, 14.8% and 14.3%, respectively. Implats, in its production update for the six months ended 31 December 2022, said that its output of refined PGMs fell 9% YoY, as scheduled loadshedding limited smelting capacity, while production from managed operations increased by 2% YoY to 1.18mn 6E ounces. Moreover, revenue per 6E ounce sold increased 5.2% YoY to R38,117/oz. Meanwhile, in its FY22 trading update, AngloGold revealed that it expects its production to be 2.742Moz, compared to 2.472Moz recorded in FY21. It also expects its HEPS to be between 8.0% and 13.0%, lower than ZAc146.0 recorded in the previous year.
Figure 3: Top-20 best-performing shares, YTD
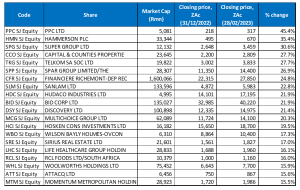
Source: Anchor Capital, Bloomberg
Year To Date Analysis: Top 20 Best-Performing Shares
A bumper performance from PPC Ltd (discussed earlier) in January and February saw it grab the top spot and emerge as the best-performing share YTD with a price gain of 45.4%. It was followed by Hammerson Plc (+35.4% YTD), which featured prominently among February’s best-performing shares. Another February outperformer, Super Group (discussed earlier), was in the third spot with a YTD advance of 30.6%.
Super Group was followed by Capital & Counties (CapCo +14.2% MoM) and Telkom SA (+10.2% MoM), with YTD share price gains of 27.7% each. In a mid-February 3Q23 trading update, Telkom revealed that its Group revenue increased 2.3% YoY to R11.03bn, while its mobile revenue rose by 7.0% YoY to R5.69bn. Furthermore, Telkom said that broadband subscribers increased to 12.05mn from 11.02mn registered in the previous year.
Spar (+26.9% YTD), luxury goods manufacturer Richemont (+24.8% YTD), and Sanlam (+22.8% YTD) followed Telkom. In its trading update for the 18 weeks that ended 28 January 2023, Spar revealed that the Group delivered a robust trading performance, with turnover increasing by 7.8% YoY and total sales increasing by 7.4% YoY.
Hudaco and food services company Bid Corp – both up 21.9% YTD – rounded out the ten best-performers YTD. In February, Bid Corp, which operates in 35 countries, reported a 45.5% YoY jump in half-year earnings. It benefitted from a resurgence across the hospitality sector as pent-up demand for dining out continued through the summer. The Group said that its profit soared 48% YoY to R3.29bn, while HEPS were up 45.5% YoY to ZAc971.7, and its revenue increased 28% YoY to R91.7bn.
Figure 4: Bottom-20 worst-performing shares, YTD
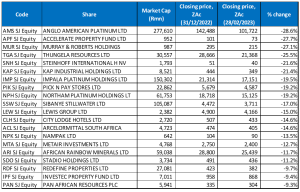
Source: Anchor Capital, Bloomberg
Year To Date Analysis: Top 20 Worst-Performing Shares
Amplats was the worst-performing share for the year to the end of February, with a YTD decline of 28.6%. It was followed by Accelerate Property Fund (-27.7% YTD) and Murray & Roberts (-27.1% YTD) in the third spot (all discussed earlier). We note that EOH Holdings’ share price is down 33.0% YTD, but the share price decline calculation is complicated by the rights issue it announced in December, and we have excluded it from the commentary and table.
Last year’s darling, coal miner Thungela Resources (-25.5% YTD), followed in the fourth spot after losing a further 7.8% MoM in February. Last month, Thungela announced the acquisition of an Australian coal operation (the Ensham coal mine), with the value of the transaction being R4.1bn. Thungela will have a 75% stake in the subsidiary (named Sungela), while two other co-investors (a Swiss and an Australian investment group) will make up the balance.
Thungela was followed by Steinhoff, Kap Industrial, and Implats with YTD declines of 21.6%, 21.4%, and 19.5%. Finally, Pick n Pay Stores, Northam Platinum, and Sibanye Stillwater rounded out the ten worst-performing shares YTD with share price drops of 19.2% (both Pick n Pay and Northam) and 17.0%, respectively.
At Anchor, our clients come first. Our dedicated Anchor team of investment professionals are experts in devising investment strategies and generating financial wealth for our clients by offering a broad range of local and global investment solutions and structures to build your financial portfolio. These investment solutions also include asset management, access to hedge funds, personal share portfolios, unit trusts, and pension fund products. In addition, our skillset provides our clients with access to various local and global investment solutions. Please provide your contact details here, and one of our trusted financial advisors will contact you.