Despite entering 2023 with valuations looking attractive relative to history, it is shaping up to be a year in which South African (SA) equity investors will be happy to see the back of when it comes to their domestic market performance. The AI-driven euphoria (mania?) entirely passed us by due to the lack of any relevant domestic means to get exposure, while a cocktail of persistently elevated interest rates (driving the cost of capital to long-term highs), weakness across most of the commodities to which SA is exposed, persistent loadshedding and a weak consumer meant investors spent much of the year on the defence. It was undoubtedly a year in which avoiding those whose business models and past strategies were particularly exposed (Transaction Capital, Pick n Pay and Sibanye come to mind) was especially influential in determining how one’s performance turned out.
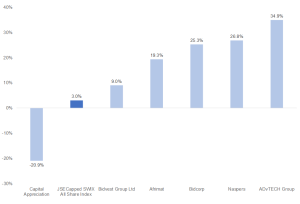
As for our domestic equity picks for 2023, an equal investment in each of the shares, since we published our Anchor’s local stock picks for 2023, would have returned a credible inflation-beating return of 16%, comfortably outperforming the pedestrian performance from the broader SA equity market. The one fly in the ointment proved to be Capital Appreciation, which suffered from a general lack of interest in smaller capitalisation shares and struggled operationally as companies deferred IT spend as much as possible in the face of SA’s poor macroeconomic environment.
Figure 1: Anchor’s 2023 domestic stock picks – total return (rand)
Source: Anchor, Bloomberg
As we turn our attention towards 2024, there is undoubtedly a temptation to sift among the rubble of 2023 (some candidates mentioned above) on the basis that these shares are likely to be the most geared to a return to a more favourable backdrop (receding incidence of loadshedding, declining interest rates, private participation in areas of failing public infrastructure [most notably Transnet]). While we have sympathy for this view, we are concerned that many of the companies in this motley camp do not have the benefit of time on their side should, as so often has happened in the past, these favourable catalysts prove slower to materialise than hoped, not to mention the need to navigate SA’s national election in the interim.
Thus, while we will remain vigilant for conditions turning more supportive as 2024 progresses, our stock selections (in alphabetical order) reflect continued caution and a bias towards our long-term preference for quality compounders with strong management teams and a company-specific growth thesis that is relatively insensitive to how SA’s macroeconomic prospects unfold. While it may seem a bit unoriginal, as the high proportion of 2019 World Cup veterans that featured in SA’s victorious 2023 campaign showed – if it isn’t broken, don’t try to fix it. Thus, we too, have a couple of 2023 veterans that we are happy to stick with in the year ahead.
Afrimat: Gratification delayed, not lost
Although an investment in Afrimat worked out satisfactorily in 2023 in relative terms, it fell some way short of what we hoped for in absolute terms. We think this may be explained by continued Transnet problems impacting its iron ore exports and the ramp-up from its Nkomati anthracite operation being several months behind expectation. Thus, the earnings leverage from this project is not particularly apparent in the interim results to 31 August 2023. Our investment thesis is largely unchanged, with Nkomati having achieved its initial monthly production targets (there is the potential for further production increases in due course). Believing that it is a case of gratification deferred rather than lost, we are sticking with Afrimat as one of our picks for 2024.
We have long been impressed by the capital allocation discipline of this management team, which, through a series of astute acquisitions over the last decade, has transitioned Afrimat from a rather unexciting industrial company focused mainly on the supply of materials to the construction industry into a mid-sized diversified miner. It has proved highly adept at identifying operations that have been poorly run and undercapitalised by their current owners, typically of a size that is too small for the larger global diversified miners to be interested. Not overpaying and rapidly implementing a turnaround plan, supported by adequate capital, has seen Afrimat often recover its investment in as little as three years, implying it continues to maintain a highly attractive return on its capital – not something that is common with serial acquirers. While we like companies that generate high returns on the capital in their businesses, they must be able to reinvest this capital at similarly high rates of return and thus compound that growth. That reinvestment can be in the form of expanding existing operations or acquiring other businesses – this is an example of the latter.
Throughout 2023, Afrimat has announced the acquisition of Lafarge (still to be approved by the Competition Commission). This was initially a bit of a surprise to us as it represents a reversal of the pivot to mining and back to construction materials. However, on closer inspection, it appears to be vintage Afrimat – high-quality assets that have suffered from neglect by its Swiss owners and are exactly within Afrimat’s wheelhouse of competence to turn around.
While Afrimat has proved effective in its M&A strategy, it has not been without a few bumps. The eleventh-hour withdrawal from the Gravenhage manganese deal (shortly after a capital raise, partly intended to fund this acquisition) and the initial challenges to get Nkomati anthracite to its potential come to mind in this respect. With the Lafarge deal under the belt, management has made it clear that the team has its hands full, and its growth aspirations are now. This removes, to some extent, some of the potential “event risk” typically associated with companies relying on M&A for future growth.
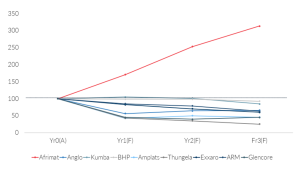
One could argue that the sensitivity of Afrimat’s earnings to unpredictable commodity prices and the frailty of Transnet are risks to it achieving the expected growth. The already very low bar of performance set by Transnet and the fact that the majority of future growth comes from operations that are not reliant on Transnet (a deliberate strategy on the part of management mitigates to some extent the Transnet risk, although this undoubtedly remains an area of sensitivity). As for the risk posed by commodity prices, the following chart contrasts Afrimat’s earnings projections with those of other miners listed in SA, indexed to the same starting point. The points to take from this exercise are that the main difference between Afrimat and the rest lies in its new acquisitions contributing over the next few years, and the rather unexciting growth outlook for the rest of its peers reflects a relatively bearish commodity price profile is already embedded in forecasters’ expectations.
Figure 2: Afrimat’s earnings growth prospects vs those of SA-listed mining peers
Source: Anchor, Bloomberg
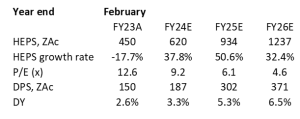
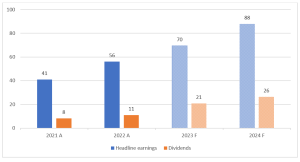
Concerning the current consensus projections for Afrimat below, the strong growth the company is on course to deliver over the next few years is clearly evident. Its rating is admittedly high in the context of SA mid-cap shares, but this unwinds relatively quickly. A very strong balance sheet also gives us comfort that a healthy dividend underpin is reasonably secure.
Figure 3: Afrimat current consensus earnings and dividend forecasts
Source: Anchor, Bloomberg consensus forecasts.
Curro: On the right side of operating leverage
The potential growth algorithm for Curro has long appeared attractive, and in its early days as a listed company, investors paid a significant premium for this. However, Curro has struggled to deliver the elusive J-curve. With the benefit of hindsight, its past expansion strategy was too aggressive and poorly executed (too many junior and pre-schools) considering the poor economic backdrop that followed. COVID-19, not its fault obviously, was another frustrating setback for the Group, pushing it into a panicky rights issue at a particularly dark hour for its long-suffering shareholders. That was a final straw for many of its shareholders, who threw in the towel and punished the share severely in the process. Yet, the tide appears to be turning. A new, more professional management team has steadied the ship. Learning from past mistakes, investing in line with demand (more orientated to high schools) and focusing on filling past excess capacity heralds a season of robust growth, with Curro positioned to capitalise on the SA demand for quality private education. This shift suggests a maturation in Curro’s strategic approach, one that promises to align future growth with the sturdy foundation it has built over the past decade.
This graph below provides a compelling narrative on Curro’s momentum in the high school segment, illustrating the expansion potential based on student progression from Grade 8 to Grade 12. In 2023, Curro reported a significant intake of 6,928 Grade 8 students, a foundational year for high school education. This figure is juxtaposed against the 4,241 students currently in Grade 12, surpassing the 2,479 figure from 2019, showing a robust enrollment growth over four years.
Figure 4: Curro growth momentum – expansion potential in high school based on rollover from Grade 8 to Grade 12

Source: Curro
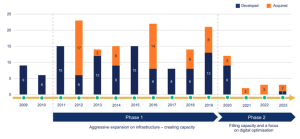
The following chart shows Curro’s strategic infrastructure development over 15 years, separated into two phases. Phase 1, from 2009 to 2019, is characterised by an aggressive expansion strategy, as evidenced by the number of schools either acquired (in orange) or developed (in blue). The transition to Phase 2, which commenced in 2020, marks a shift in strategy from aggressive construction and acquisition to a more measured approach. Here, the focus is on optimising the use of the existing infrastructure and digital enhancement, aiming to maximise the value of the investment in the newly created capacity. The declining numbers in the chart from 2020 onwards indicate a deliberate deceleration in physical expansion as Curro pivots to enriching the quality of its educational offerings through digital technology.
Figure 5: Curro – Total number of schools acquired and developed per year
Source: Curro
Recent results have demonstrated that the earnings flywheel that proved elusive for so long is finally working. Thanks to its more measured investment plans, free cash generation is set to improve strongly. Although the share has rerated somewhat as recent results have restored confidence in its execution, currently on a 12-month rolled forward PE of 14x, we believe Corro is a secure compounder, with earnings projected to grow at c. 25% per annum over the next two years.
Figure 6: Curro (December year-end) – rolled forward P/E ratio
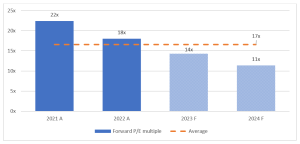
Source: Anchor, Bloomberg
Figure 7: Curro – earnings and dividend expectations, ZAc
Source: Anchor, Bloomberg
Dis-Chem Pharmacies Ltd: Revising The Growth Story
We believe Dis-Chem Pharmacies Ltd (Dis-Chem) is an exciting opportunity for investors on the JSE. The share has largely treaded water over the past five years. It produced a 1.5% compounded annual growth rate in total return over that time. There have been operational issues and disappointments over that period. There are also other contributing factors. Valuations on the JSE as a whole are under pressure; the cost of capital in SA is high, and consumer confidence is near all-time lows. These issues may persist. However, we believe that if Dis-Chem is able to execute its plan, it can deliver strong returns to investors.
We look for businesses that generate high returns on capital. Dis-Chem generates strong returns on invested capital in the mid-30% range. A natural question that follows is whether there are competitive advantages to protect these high returns. The retail sector is notorious for apparent competitive advantages that later turn out to be illusory. A large part of the problem comes from switching costs for the consumer, which are very low. In fields like enterprise software or banking, switching to another provider requires a lot of effort on the customer’s part. For retail consumers, switching involves nothing more than walking to your competitor’s store. Competitive advantages like scale and strong brands are, therefore, particularly important for retailers. In Dis-Chem’s case, it is meaningfully smaller than its biggest competitor (Clicks). Nevertheless, we believe that Dis-Chem has the potential to grow to a meaningful scale over time.
Annual store growth has the potential to be strong for years into the future. According to the company, Dis-Chem will have 272 stores at the end of February 2024. It aims to open 20 new Dis-Chem stores in FY25 and 40 new Dis-Chem stores p.a. after FY25. If done successfully, that would translate into strong double-digit annual store growth over the short to medium term. If same-store sales are decent, revenue growth should at least mirror the annual growth in stores.
Dis-Chem currently earns a 5% operating margin. Group operating margins have not improved over the past decade. Until now, operating leverage has been elusive. In its August 2023 interim results, management discussed achieving positive operating leverage in 2H24 and over time. One area of focus is better revenue growth vs payroll growth. Payroll is the company’s biggest fixed cost. Management is lowering the average store headcount by moving some existing staff into new locations as new stores are opened. Dis-Chem believes it can do this and still maintain high customer service. It expects this to continue going forward.
Figure 8: Dis-Chem operating margin
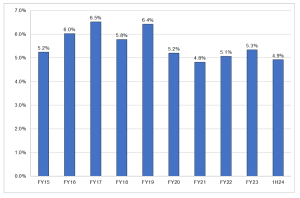
Source: Company filings
Dis-Chem lags behind its biggest competitor, Clicks, on two important fronts. First, Clicks earns higher operating margins (9% vs Dis-Chem’s 5%) despite having lower gross margins (21% vs Dis-Chem’s 23%). This suggests better cost competitiveness for Clicks. Second, Clicks has a more attractive working capital cycle (and therefore free cash flow conversion) than Dis-Chem. Dis-Chem’s wide selection range is an important contributor to the difference. This is a focus for Dis-Chem management. A 10% improvement in inventory days over the medium term is targeted. We acknowledge these potential areas of improvement for Dis-Chem. We are, in fact, shareholders in Clicks, but we believe there is the potential for both businesses to perform decently over the next few years.
Combining strong store growth with stable or even improved operating margins opens the possibility for strong double-digit earnings growth over time. At a forward P/E of 22x, we believe Dis-Chem’s risk-reward ratio is favourable.
MAS Real Estate: A 100% upside at peer rating, but its growth is peerless
MAS Real Estate (MSP) is a retail property (mall) owner in Central and Eastern Europe (CEE). We are positive about the fact that 90% of MSP’s rent comes from Romania and Bulgaria, where mall penetration (mall space per capita) is low, GDP growth is attractive and real retail sales have been resilient (vs the rest of CEE).
Figure 9: Real retail sales growth rate
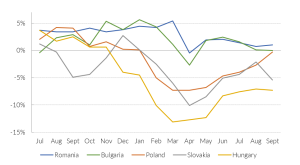
Source: Eurostat
Figure 10: Shopping centre density, square meters per 1,000 population
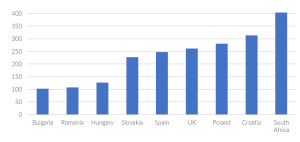
Source: Cushman and Wakefield, ASB
We like that the MSP malls are new (with an average age of just five years) because we have found that maintenance capex, tax levels, operating costs and urban decay/obsolescence risks increase with age in CEE.
Figure 11: The average age of malls (years at the end of 2023)
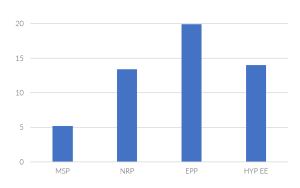
Source: Company reports, Anchor
Rental growth usually correlates with mall size – the large malls have struggled with rental growth, probably reflecting the impact of online shopping (high-value and high-margin items that used to be on display and sold in large destination malls are increasingly purchased and reviewed online), flexible working (convenience shopping centres close to residential areas anchored by grocery retail have benefited from work-from-home [WFH]), urban decay (which accelerated following COVID-19 as commuting to city-centres declined and the office property sector started taking strain) and the increasing costs of maintaining large expensive destination malls. Another positive for us is that the MSP malls are relatively small and low-cost. See Figure 12, which compares the MSP and Nepi Rockcastle (NRP) malls in terms of size and value/sqm.
Figure 12: Average size of malls (m2)
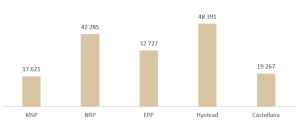
Source: Company reports
Figure 13: Value/sqm vs GLA (sqm) for MSP and NRP
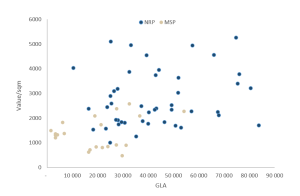
Source: Company reports
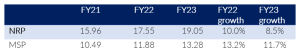
While we like the rental growth track record, Romanian/Bulgarian exposure and strong balance sheet of NRP, we highlight that MSP has a track record of faster rental growth, a stronger balance sheet (lower loan-to-value [LTV] ratio) and greater exposure to Romania and Bulgaria (MSP’s exposure to these two countries is 86% of its rent whereas that of NRP is 48%). MSP rentals have grown by 3% p.a. – faster than that of NRP on a like-for-like basis over the past three years. Nevertheless, it remains more affordable than that of NRP (on a gross rent-to-sales ratio and based on absolute level of rent).
Figure 14: Net rent/sqm/month (EUR)
Source: Company reports, ASB estimates
From FY19 to FY23, MSP’s distributable income per share (DIPS) increased by 8% (based on the MSP’s reported results). Similarly, MSP has grown its NAV/share much faster than NRP since FY19, even though MSP’s NAV took a bigger knock in its COVID-19-impacted FY20 results. For FY24, we expect MSP’s DIPS to grow by 15% YoY.
Despite MSP’s superior rental growth track record and lower LTV (debt gearing), it trades at just 59% of book value. We calculate that the market currently prices in a franchise value yield (rump yield) of 12.3% into MSP’s operating assets (malls). If MSP’s assets were valued at the same operating earnings yield that the market currently prices into NRP assets, MSP would be valued at R30/share. Given MSP malls’ superior growth trajectory and lower maintenance costs, they should arguably be valued at a lower yield than the NRP malls.
Figure 15: Rump yield of European retail property companies = [net rental income – corporate costs – tax]/[market cap + net debt – net other assets]
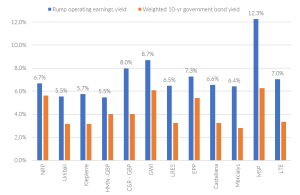
Source: Company data, ASB estimates, Reuters. Prices as at 7 December 2023
We believe the MSP opportunity exists mainly because it decided to stop paying dividends in FY23 (reflecting its desire to retain capital to get to investment grade and fund development opportunities in Romania). We have seen similar share price slumps when Redefine (RDF) and Hyprop (HYP) cancelled their dividends and strong rallies when their dividends were reinstated. In our view, MSP should employ a dividend reinvestment plan (DRIP) to retain distributable income. This should enable it to declare an attractive dividend.
MSP recently made a public offer to repurchase EUR60mn of its bond debt, so its balance sheet and liquidity are clearly not troubled. We also like that MSP mentioned in its recent annual report that it had secured mortgage financing and did not rely on the bond market alone for funding.
Naspers/Prosus: Time for Tencent to enhance an already unfolding self-help story
Another of last year’s squad that remains in our line-up for 2024 is Naspers/Prosus. While much ink has been spilt in pursuit of justifying which of the two is the better holding at any given point in time, and our bias would be towards Prosus after its notable underperformance relative to Naspers in recent times, we think it is wise to maintain some exposure to both.
With c. 80% of the Group’s net asset value (NAV) comprised of its stake in Tencent, despite the ongoing selldown of Tencent to fund open-ended share buyback at a Prosus level, whatever one’s view is of the balance of the Prosus, it is the Tencent prospects that will continue to dominate investment performance for Prosus. After years of underperformance, we believe the risk-reward ratio for Tencent is now attractive. Tencent is down 39% in US dollar terms* since the end of 2020. It has notably underperformed the MSCI All-Country World Index, up 15%, and even the Hang Seng Index, down 33%, over the same period. A combination of factors drove this underperformance. First, at 27x forward earnings, Tencent’s valuation at the end of 2020 did not price in any potential slowdown in growth.
Of course, a slowdown in growth is just what ended up happening. Following years of strong growth, earnings (adjusted for investment activity) and free cash flow were 6% and 28% lower, respectively, from 2020 to 2022. Second, China’s tougher operating and regulatory environment hurt earnings and sentiment. Chinese regulators cracked down on large Chinese tech companies like Tencent. Simultaneously, the Chinese economy struggled to grow after the COVID-19 pandemic. Given how strongly it depends on China for growth, the harsher domestic environment was particularly tough for the company. Tencent has historically generated much more of its business domestically than its global peers. Just 9% of Tencent’s revenue came from outside China in 2022. For comparison, US peers such as Alphabet, Electronic Arts, Meta Platforms and Microsoft generated 52%, 57%, 57% and 49% of revenue outside the US.
Despite the tough last few years, there are still positives to the investment case. First, Tencent remains a high return on invested capital (ROIC) business with sizeable competitive advantages. The 2022 ROIC of 22% is a decent showing in what was a tough year for the business and the sector.
Tencent has respectable competitive positions in its key verticals – social networks and video games. These businesses are housed under Tencent’s value-added services (VAS) segment. Tencent’s WeChat remains the biggest social network in China, with over 1.3bn monthly active users (MAUs). Most online activities, like booking tickets, playing video games, sending money or connecting with friends, continue to occur through its super-app. China’s internet users spend an estimated one-fifth of their online time on WeChat**.
Tencent’s video game business is amongst the largest in the world. It owns market-leading titles, including Honor of Kings, PUBG, League of Legends and Fortnite (through its 40% stake in Epic Games). Five of the top ten mobile games outside of China measured by daily active users (DAUs) were developed and operated by Tencent in 2021***. Social networks and online games, which comprise the VAS segment, contribute half the revenue and 60% of gross profit.
For the first three quarters of 2023, earnings growth (+34%) has outpaced revenue growth (+11%). Cost discipline has been a focus. Employee headcount is 9% lower than at its peak in 1Q22. We believe the reduction in headcount is largely finished now, given that in 3Q23, the headcount grew QoQ for the first time since 1Q22. The operating leverage has improved operating margins (non-IFRS operating margin, adjusted for investment activity) back to the mid-30% range in 2023.
The valuation multiple has continued to de-rate in 2023. Both free cash flow per share (+103% YoY) and EPS (+34% YoY) are up meaningfully in 2023. By contrast, the share has delivered a 0% total return.
One additional source of value is the extensive investment portfolio that Tencent has built up over time. Company President and Chairman of the Investment Committee Martin Lau has described the investment strategy by saying: “There’s a lot of great entrepreneurs outside, and if you turn every single one of them into your enemy, it’s not a good thing. As a company you can’t actually hire these entrepreneurs, so what are you going to do? Investment is actually the best way to get a piece of their action.” ****
Tencent’s investment portfolio stands at over US$110bn today. It is 29% of the company’s US$385bn market cap. Frankly, the market ascribes little to no value to the portfolio. It is worth pointing out, however, that Tencent has made several moves in recent years to crystallise at least some of the value in the portfolio for shareholders. Stakes in Sea, Meituan and JD.com have been partially or fully spun out or divested. Currently, the portfolio includes stakes in Tencent Music Entertainment, PDD Holdings (the company behind Pinduoduo and Temu), Epic Games (maker of Fortnite), Universal Music Group, Snap, Spotify, NIO and many others.
While we do not expect growth to return to previously sky-high levels, we think future growth can be decent going forward. Furthermore, the current valuation does not require the heady growth of yesteryear for investors to make a decent return. At 16x forward earnings (with 29% of the market cap represented by the investment portfolio), the growth implied by the current valuation has declined. As suggested earlier, we do believe some of the de-rating is justified. The business is more mature than it was years ago. Perhaps just as importantly, regulatory crackdowns and geopolitical tensions between China, the US and Taiwan may have changed investors’ perceptions of the risk in the country and sector. We do not wish to underplay these risks as they are all too real. However, we feel that the share’s risk-reward has now improved to such an extent that Tencent is worth strong consideration for global investors.
Turning our attention to the balance of the Prosus investment portfolio, it suffices to say that, outside of a few reasonable successes (the profitable exit of its Indian investment, Flipkart, for example), it has proved largely unsuccessful in its efforts to build a successful portfolio of investments outside of Tencent. The technology verticals it has chosen to back (online classifieds, fintech, food delivery, and online education) have not featured among the areas of technology that have proved spectacular successes in recent years – cybersecurity development of AI springs to mind. Combining this with the rough period for Tencent, what has been a golden era for investors in technology over the last few years has passed Prosus investors by.
Prosus’s lacklustre investment record is largely water under the bridge. What is important for share price performance from here is the prospects of success for its strategy. Over and above the performance of Tencent, as discussed above, we will likely see several other medium-term drivers for Prosus. These include:
- The ongoing share buybacks of both Naspers and Prosus shares, funded from the sale of Tencent shares, are increasing the NAV per share at a rate of about 5% p.a. This may not sound like a lot, but it adds up over time! Since the buyback began, the free float of Prosus shares has already fallen by 17% – the pool of those willing to part with their shares is shrinking all the time. Eventually, the growing scarcity will likely drive a further narrowing in the discount at which these shares trade to NAV.
- One of the most pleasing aspects of the recent Prosus results is that the speed at which it has been getting its non-Tencent investments to profitability (a key commitment of the team) has significantly exceeded expectations, and management has accelerated its target for profitability being reached to 2H24. Achieving self-sustaining profitability in what is collectively called the E-commerce division not only improves the range of options through which Prosus may unlock value from this portfolio but begins to justify that investors should start to evaluate Prosus because it is more than just a discounted proxy for Tencent.
Figure 16: Prosus’s E-Commerce division is well on track to end the long era of trading losses
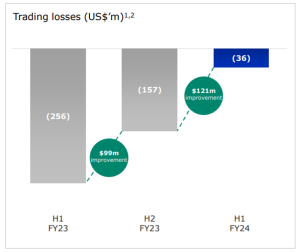
Source: Prosus
Naspers and Prosus performed relatively well in 2023 despite another year of lacklustre performance from Tencent. We expect 2024 to be a year in which investors continue to gain confidence in the non-Tencent part of the thesis being delivered. As for Tencent, as we point out, the risk-reward ratio tilts steadily more positively.
* Returns cited are total returns.
** Chen, L. (2022) The Story of Tencent & China’s Tech Ambition. Hodder & Stoughton.
*** Tencent 2021 Annual Report.
**** Chen, L. (2022) The Story of Tencent & China’s Tech Ambition. Hodder & Stoughton.