In this note, the Anchor investment team highlights a selection of JSE-listed companies that we believe are worth keeping an eye on in the year ahead. Keep in mind that these individual stock ideas may not necessarily be reflected in all client portfolios (as our portfolios have different mandates and risk-return profiles). However, we did try and find stocks that indicate how we pick our shares and that mirror our philosophy in this regard.
Global inflation has been at the core of this year’s market meltdown, driven by easy money and supply pressures from clogged supply chains and Russia’s war on Ukraine. We think US inflation could subside to 3% within a year, easing pressure on central banks to act in a restrictive manner. During the height of the volatility and market declines, it is important to remember that it is an economic cycle, and we are well past the halfway mark. It is also vital to remember that markets move long before economies turn – they look forward and price-in the aggregate view of the future. By the time the economy is on the up again, markets will have already run away.
So, the playbook sounds simple, but the shorter term is far more complex, and market participants and commentators are on edge trying to work out when rates will peak, how long rates will remain high, and how deep the economic impact will be. These are all factors that will determine the short-term trajectory of markets. As we enter 2023, it is widely expected that the first half of the year may still have some bumps in store for investors due to these uncertainties. However, it should be kept in mind that this bear market is already becoming quite extended by historic standards and, with each passing month, becomes more so. During bouts of intense selling pressure, all shares typically fall as investors’ urge to exit risk assets tends to make the individual investment cases of companies of limited importance. For those that have the ability to move against the herd, this can present a wonderful opportunity to enhance one’s portfolio. Below are some suggestions for JSE-listed companies to invest in.
ADvTECH: A resilient service offering, education is in demand all over Africa
Although ADvTECH (ADH) has invested heavily in its South African (SA) and African schools and tertiary offerings over the past six years, normalised HEPS growth has not reflected this adequately. In addition to emigration and affordability, arrears have risen, and the expansion has been funded with debt. An investment into other parts of Africa has yet to generate rewards; however, we see substantial opportunities in Africa, such as ADH’ ‘s Kenyan operations. In our view, education is a more defensive offering than, for example, a retailer in Africa. In our opinion, an African government such as Kenya is more likely to support a private education company; after all, most politicians send their children to private schools and therefore have a vested interest in the success of the said private school. ADH is cognisant of the various non-systematic risks posed by individual African countries. Accordingly, management has communicated its intention to expand into Africa responsibly.
Figure 1: ADvTECH Group overview
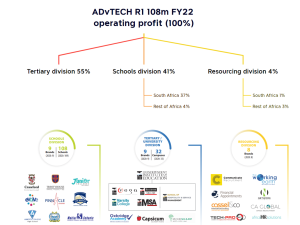
Source: Anchor, Company data
As a result of a growing population and a lack of public sector investment in education infrastructure, the state education system is at saturation point, resulting in low pass rates. Thus, there is an extensive demand for quality education – 27% of the SA population is between the ages of 5 and 19, while 18% is between the ages of 20 and 29. As a result, the number of applications to certain public universities is up to fourteen times oversubscribed. With a long history and proven track record, ADH is SA’s leading private school and tertiary educator. There are three divisions of the company, namely Schools, Tertiary, and Resourcing, and ADH has a presence in 19 African countries, with SA dominating the sector. As a pioneer in many respects, it continues to grow student numbers while maintaining an impeccable academic record.
While ADH and Curro are dominant names in private schooling, together, they only account for 13% of independent school students in SA. Scale enhances affordability, so there is significant growth potential. However, as greenfield schools have long payback periods and acquisitions increase debt, responsible growth is essential. In FY19, ADH’s utilisation rates had declined to 22% of its existing schools’ building capacity after six years of significant investment. The underutilised capacity is only 17% and is expected to decrease even further.
ADH is the second-largest player in tertiary education after public universities. In terms of student numbers, it pales in comparison to government institutions, but we see this as a significant opportunity. According to our estimates, the company has a low 4% market share among SA university students and a 29% share among private higher education students. Since its courses meet the same criteria as those offered by the state and the range is increasing, we believe its growth potential is significant, as public universities are substantially oversubscribed and not radically different in pricing as in the past. In addition, ADH is currently challenging the SA government regarding ADHs eligibility to attain official university status, which would add significant value and increase enrollment.
Although public sector institutions still offer alternatives, in the absence of significant and non-forthcoming government investment, substituting is becoming less appealing. Furthermore, entry requirements are becoming more stringent, and the quality of education is under threat due to rising teacher-to-student ratios.
In our view, ADH’s financial drivers are simple: grow net student numbers, achieve cost growth-related fee increases, maintain low bad debts, and balance capital expenditure (CAPEX) between growth and replacement. At different times of the cycle, mature schools will experience mid-single-digit earnings growth, resulting in inflated debt levels. Given the good visibility of student numbers at the start of the financial year, we believe the debt is manageable. There are always acquisition opportunities (but fewer than historically), and they are often cheaper than greenfield development. Despite this, greenfield opportunities are still abundant due to urbanisation and a growing middle class.
The weak local economy and political environment have resulted in considerable and unpredictable headwinds. However, a decision to hold back on new schools in 2020 through to 2022 is positively impacting free cash flow and should, on our estimates, see utilisation rates rise to previous highs of 86%.
ADH’s 1H22 results were in line with expectations. Normalised EPS rose 22% YoY to ZAc67.3, driven by 18% YoY revenue growth (education revenue was up 12% YoY) and improving margins across all divisions. Schools and Resourcing operations in the Rest of Africa delivered solid results, with EBIT up 70% and 136% YoY, respectively.
The student numbers published were those included in the FY21 results announcement, namely February 2022. No additional disclosures have been made regarding numbers or utilisation rates – we forecast some modest gains during the year, particularly in Tertiary, which does experience some mid-year enrolments.
Cash generated by operating activities increased by 9% YoY to R1.5bn, facilitating the settlement of R861mn in debt. As income received in advance declines and CAPEX rises, debt levels will increase in 2H22f. In FY22f, we expect net debt (excluding lease liabilities) to be R1,042mn, compared to R1,546m in FY21. We expect net debt to decline going forward. Still, we believe the dividend payout ratio will remain the same in the short to medium term because management would want liquidity to respond to market opportunities, whether organic or acquisitive.
Despite lower debt, finance costs only decreased from R89mn to R83mn. Rising rates and higher lease liabilities (+62% YoY) increased finance costs. The lease interest grew from R31mn to R47mn. The reason for this is the doubling of lease space at Waterfall (15 years at high rentals) and the addition of other properties for a full year.
We remain comfortable with the debtors’ book (R752mn) and provisioning level. 1H22 debtors are up 5% on 1H21, less than the revenue rise. Due to upfront billing and collection efforts throughout the year, a comparison with FY21 (R565mn) is inaccurate. The provision rates have levelled off following an increase in COVID-19 provisions (54.9% in FY19, 61.7% in FY20, and 55.4% in 1H22). This explains the lower credit loss charge in FY21 – 2.4%, which is down from 3.1% in FY19 and 4.1% currently. Management continues to take a tough stance on debtors, which is reflected in the level of discounts offered, 4.1% of revenue in 1H22 compared to 4.5% in FY19; the discount level peaked at 4.8% in FY20.
With a low base, we believe the growth prospects are appealing given increasing capacity utilisation in schools, strong demand for tertiary education and a turnaround in its Africa operations. In addition, significantly lower debt costs and ongoing efficiencies through the centralisation of activities are further tailwinds. Figure 2 below shows that we expect a one-year total return of 56.4% by applying an exit P/E of 16.6x to our ADH earnings.
Figure 2: ADvTECH forecast and valuation
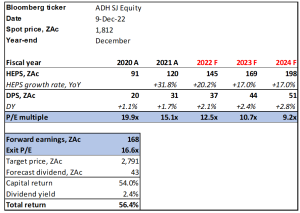
Source: Bloomberg, Anchor Capital
Afrimat: Poised to deliver in 2023
Afrimat was one of our local stock picks for 2022. After a promising start to the year (no doubt benefitting from the surge in commodity prices following Russia’s invasion of Ukraine), the share has struggled in recent months. Sagging iron ore prices, Transnet’s persistent underperformance, an unexpected capital raise (probably unnecessary in retrospect), and the eleventh-hour collapse of its purchase of the Gravenhage manganese mining right (a growth project assumed to be in the bag) all conspired against it in recent months. All these developments were a timely reminder that investing in an acquisitive business on a journey to become a diversified mid-tier miner in SA can sometimes get bumpy. Despite these short-term frustrations, our investment thesis for Afrimat is largely unchanged, and our high regard for this management team as shrewd capital allocators remains. After our initial disappointment that Afrimat failed to conclude the Gravenhage deal, on further reflection, we concluded that being prepared to walk away from a deal at such a late stage, after considerable time and cost have already been invested, because certain commitments from the seller were not adhered to, demonstrates Afrimat’s capital allocation discipline even more clearly.
Over the past decade, Afrimat has transitioned from a well-run but rather unexciting supplier of construction materials into a mid-sized diversified miner. Its focus on projects that are too large for small single commodity operators to manage but too small for the global diversified miners to bother with places Afrimat in relatively uncontested territory. It has proved extremely adept at identifying operations that have been poorly run due to a combination of poor management or lack of capital. It has achieved extremely rapid returns on its capital outlay by addressing these deficiencies.
To date, it has stuck to open cast mining, which draws heavily on the expertise it has developed over the years in the highly competitive quarrying activity for the construction industry. Sticking to its core competence has certainly limited the execution risk to date, although we note that some of its new growth initiatives will see it begin to move into underground mining – something we will have to keep an eye on. From Figure 3 below, one can see how much the business has changed from its construction materials origins, and, as we explain below, this transition will continue.
Figure 3: Afrimat 1H23 operating profit split
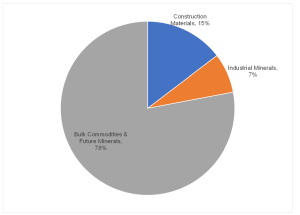
Source: Company data, Anchor Capital
Although, as we pointed out above, the Gravenhage manganese project fell away over the current financial year, Afrimat invested heavily in developing several other projects it acquired in recent years. These include (1) the Jenkins iron ore mine, close to its existing iron ore operation in the Northern Cape – Demaneng; (2) the Nkomati anthracite mine; and (3) Glenover – phosphates, vermiculite and, in due course, rare earths. Importantly, these latter two projects go some way towards achieving an important strategic objective for Afrimat – diversifying away from its current single market (China) and Transnet reliance due to the dominance of iron ore in its mining operations.
It is interesting that, for a management team that has struck us over the years as tending to under-promise vs what it ultimately delivers, the team has been notably animated about how much better the potential is turning out to be for these last two projects than its initial due diligence suggested. In fact, we think it has opted to use the current financial year, which has arguably been a rather underwhelming year for Afrimat for the reasons mentioned above, to invest more heavily across all of its projects. This may well mean that the second half of this year (to February 2023) may not attract much excitement. However, the platform will be set for robust production growth into the next financial year and beyond.
While the capital raise in the middle of the year was, in retrospect, probably unnecessary (it was intended chiefly to fund the purchase and development of Gravenhage), it places Afrimat in a strong net cash position currently. Although current projects place it in a very comfortable position from a growth perspective over the next three years, we understand that its business development team is busy evaluating a range of opportunities. These will likely continue to diversify Afrimat’s commodity exposure.
Afrimat trades on a forward P/E multiple to February 2023 of 9.7x. The projected earnings profile below (Figure 4) shows that FY23 is unlikely to set investors’ pulse racing. A weakening iron ore price, Transnet frailties, high inflation in fuel costs in particular and what we think has been a deliberate effort to spend on its projects for the future mean that earnings will likely decline slightly. The rating is certainly not as low as many other miners. However, what sets Afrimat apart is the strong production growth it is set to deliver over the next few years. Although the share price has already begun to recover since the large seller has fully exited its position, we think Afrimat remains very attractive for investors with an eye on what is set to unfold over the next few years.
Figure 4: Afrimat earnings projections
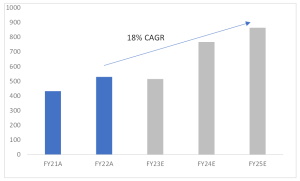
Source: Company data, Anchor Capital
Bidcorp: Market share gains, organic and acquisitive sales growth to support its growth trajectory.
Bidcorp is a leading international food service company that operates in developed and developing countries across five continents. The company was unbundled from Bidvest and was listed on the JSE on 30 May 2016. Operationally, Bidcorp is a clear market leader in its key regions. It has an excellent track record in the food services space, driven by strong organic and acquisitive growth over the years. Bidcorp delivers food service products to a diversified customer base, and fundamentals within its sector have been structurally attractive given the material shift towards the eating-out-of-home market.
Over the past two years, COVID-19 disruptions and lockdown restrictions have negatively affected sales and demand levels within Bidcorp’s operations. As most countries are emerging out of COVID-19-induced restrictions, Bidcorp’s sales progression trends have recovered strongly and are currently tracking above pre-COVID-19 levels, as discretionary spending appears to have normalised. Several sectors, such as accommodation, workplace catering, entertainment, sports events, business travel, conventions and conferences, and the cruise line industry, have started to improve but have not recovered to their pre-COVID levels.
Figure 5: Bidcorp sales progression trends – approximate 2023 revenue statistics as a percentage of 2022
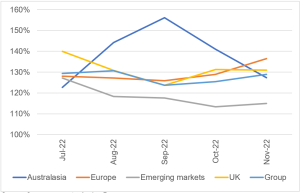
Source: Company reports, Anchor Capital
Figure 6: Bidcorp sales progression trends – approximate 2023 revenue statistics as a percentage of 2019
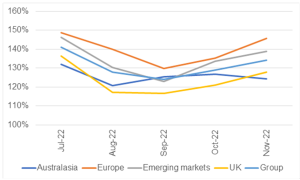
Source: Company reports, Anchor Capital
Despite the positive rebound in sales and demand, the food services industry has continued to face further post-pandemic headwinds. Recently, staff shortages, supply-chain issues, and inflationary pressures have increased costs within the food services industry. To counteract these headwinds, Bidcorp’s response has been to pass on these costs to its customers, resulting in relatively muted pressure on margins. Nevertheless, we are encouraged by Bidcorp’s ability to expand its margins in an operating environment that continues to witness increased cost pressures globally.
Figure 7: Bidcorp trading profit margins
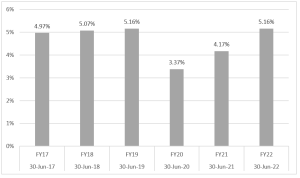
Source: Company reports, Anchor Capital
We like Bidcorp, given its attractive business model in which it delivers food products to a diversified customer mix in each country in which it operates. Independent restaurants are its largest customer base and most profitable within the customer mix. Its increased exposure to independent restaurants has driven organic sales growth and has contributed towards the expansion of margins over the years since its listing on the JSE. Bidcorp is also well-capitalised and retains adequate headroom for acquisitive growth opportunities. We expect organic sales growth to be further enhanced by bolt-on acquisitions. Bidcorp’s market-leading status and scale in each country it operates has allowed it to generate synergies from in-market acquisitions.
We remain bullish on the counter and believe that Bidcorp will continue to structurally benefit from out-of-home eating habits. The combination of market share gains and organic and acquisitive sales growth are compelling factors in Bidcorp’s continued growth trajectory. As a result, we expect Bidcorp’s diluted headline earnings per share (EPS) to increase by a compound annual growth rate (CAGR) of 12% for the next two years from a very strong earnings growth performance of 77% YoY in FY22. From a valuation perspective, Bidcorp is trading at a 17.7x 12M forward P/E multiple – below its five-year historical average P/E of 20x.
Figure 8: Bidcorp’s 12M Forward P/E valuation
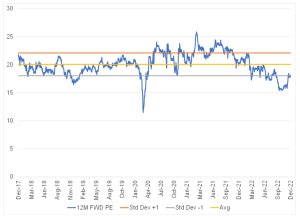
Source: Bloomberg, Anchor Capital
Bidvest: A strong balance sheet which delivers on both earnings and free cash flow
On a forward valuation multiple basis, the market continues to price Bidvest (BVT) near its COVID-19 levels despite many divisions recovering to pre-COVID levels on a sustainable basis. We believe that the market is not pricing in highly accretive international deals that can unlock synergies if integrated correctly (BVT has historically demonstrated its ability to incorporate successfully). In addition to the current portfolio, further international acquisitions could add value with an internal rate of return of 15%-20%. BVT has more than enough balance sheet capacity to execute such a strategy.
Figure 9: Bidvest Group overview
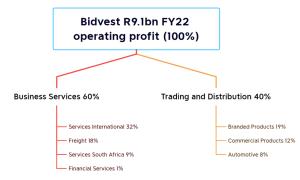
Source: Anchor, Company data
BVT had a good performance over the past four months – our interpretation is that all divisions have performed well, with no significant variance between good and poor performances. The domestic travel market has plateaued at 80%-85% of pre-COVID-19 levels. BVT management expects this to be the status quo level in the future. However, international travel shows the most improvement for 1H23f; in FY22, international travel was at c. 40% of pre-COVID-19 levels and has increased to 60% in the past four months.
BVT’s financial services segment recorded an R116mn trading loss in 2H22 compared to an R202mn 1H22 trading profit. However, management seems confident that FY23f should return to the c. R350mn in full-year trading profit. For FY24f and FY25f, management has targeted a trading profit of c. R500mn p.a. for the Financial Services division. Management aims to achieve improvement by streamlining an arduous credit application process and introducing new technology and automation. BVT acknowledges that it fell behind regarding tech in the past, and catching up is a strategic focus for the financial services segment.
Furthermore, BVT wants to offer more comprehensive asset-based financing instead of the old focus on state-owned enterprises (SOE) vehicles. The Group focuses on opportunities in the commercial vehicle space and medical equipment. From a medical perspective, BVT is negotiating with its associate Adcock Ingram to refinance various previously held loans at other institutions. Furthermore, BVT sees an opportunity in the financing of renewable projects.
From an office occupancy perspective, most employees are back at work; however, professional services firms are the exception. Professional services office occupancies in SA are at c. 20% and internationally at c. 60%. BVT PHS and Noonan in the UK are lapping a high 2022 base, with hygiene services peaking because of COVID-19. Despite this, BVT hopes to deliver a similar trading profit in FY23f as in FY22. We believe the underlying trends are good, as evidenced by new contract wins, which should offset some of the lost high-margin COVID-19 work.
Bidvest shows defensiveness in a challenging environment. Management is still looking for possible acquisitions offshore and onshore, and BVT management has avoided several possible deals. Instead, BVT drives a hard bargain, which we find reassuring from a capital allocation perspective. Figure 10 below shows that we expect a one-year total return of 23.6% by applying an exit P/E of 14x to our BVT earnings.
Figure 10: Bidvest Group forecast and valuation
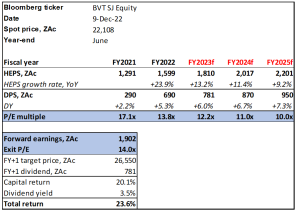
Source: Bloomberg, Anchor Capital
Capital Appreciation: A high ROE business with substantial growth opportunities
Capital Appreciation (CTA) is a relatively new company (CTA listed in 2015), but its underlying operations are well established in SA fintech. African Resonance, its largest digital payment business, was founded in 2003. CTA is the market leader in procuring, securing, managing, maintaining and repairing point-of-sale (POS) devices issued by major banks to their merchant customers. CTA has a strong balance sheet with cash of R536mn (c. ZAc41/share), no debt, and treasury shares worth c. R110mn. Therefore, CTA is in an enviable position to invest in new technologies like Halo Dot, acquire businesses at favourable terms, buy back shares and continue to pay dividends. Since Synthesis has a solid track record of delivering innovative solutions, its investment returns could significantly impact future earnings. In our view, an increase in Halo Dot’s global client base would be an essential catalyst for a rerating.
Figure 11: Capital Appreciation Group overview
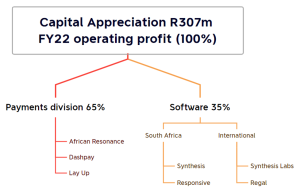
Source: Anchor, Company data
In 2017, CTA acquired Dashpay along with African Resonance. Dashpay was founded in 2013. In addition, it operates in the digital payment industry, partnering directly with merchants and acting as a bank’s intermediary. As well as traditional merchant acquiring services, it specialises in electronic payment options for small, medium and micro enterprises (SMMEs) and non-traditional merchants such as courier companies and shopping mall operators.
We believe physical POS devices have an ever-increasing role in retail commerce, and the number of devices in the SA market will grow significantly. Independent research predicts growth of 31% over the next three years, and we believe CTA is well-positioned to increase its market share (currently estimated at 35%). In addition, as retailers enter the SMME space, cashless spending continues to rise (SA remains heavily dependent on cash transactions), value-add services are offered by POS devices, and card penetration has increased.
Synthesis is another area of focus for the Group. Through its advanced status accredited by Amazon Web Services (AWS), it is a crucial cloud provider to financial services companies. Synthesis assists clients in digitising and analysing data through the internet and digital banking platforms. Mastercard, Visa, and Amex have all certified Halo Dot, the company’s in-house payment software. As a result, CTA can participate in the SoftPOS industry. For regulators such as the SA Reserve Bank (SARB) and the SA Revenue Service (SARS), Synthesis also plays a crucial role in automated reporting.
CTA recorded growth in its 1H23 terminal estate (POS devices), increasing from 277,000 to 315,000. The increase supports our optimistic outlook on terminal growth in SA as digital payments progressively replace cash, card penetration increases, and SMMEs embrace digital transacting. As expected, revenue from terminal sales declined by 8.5% YoY, given the high post-COVID-19 1H22 sales catch-up. However, maintenance & support revenue (+25% YoY) and transaction-related income (+20% YoY) increased broadly in line with terminal numbers.
We anticipate 2H23f revenue in line with 1H23 as bank terminal demand is impacted by higher terminal inflation (POS devices are imported) and low economic growth and load-shedding, delaying merchant orders. However, our view is that these are short-term challenges that will pass.
With 75% revenue growth and a strong pipeline of projects, CTA’s Software segment is gaining considerable traction from its cloud, digital, and Intelligent data. Despite its strong performance, it continues to invest in growth with significant expenditures on Halo Dot (including global marketing) and other technology innovations. There are now five Halo Dot instances up and running with more transactions on the way, including two in the UK. Since we do not model Halo Dot revenue, any deal success is positive for earnings growth since all development costs have been expensed.
A significant increase in security hardware and license fees has impacted Synthesis’s EBITDA margins – up from R2.7mn to R47.2mn. This category accounts for 21% of Software’s revenue in 1H22. Our expectations for 1H23 were far exceeded as the momentum from 2H22 continued. In Synthesis’ case, margins are significantly lower, negatively impacting the company’s overall profitability. Because of Synthesis’ competitive advantage, demand should remain high, but growth will likely be volatile since the hardware has a 5-year life cycle.
Figure 12 below shows that we expect a one-year total return of 70.8% by applying an exit P/E of 12x to our CTA earnings.
Figure 12: Capital Appreciation Limited forecast and valuation
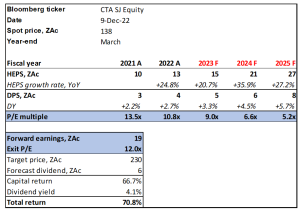
Source: Anchor, Company data
Naspers/Prosus: A much-needed humbling and better for it
Much has changed for Naspers/Prosus in the last few years. We reflect on 2019 when Naspers took what it thought was a major step to unlock shareholder value by creating Prosus. With few shares having been as singly responsible for the degree of wealth creation for SA investors as Naspers up to this point, our campaign at the time to encourage investors to use this event as an opportunity to address what had become an irresponsibly large single stock exposure for many was met with a decidedly mixed response. As things have unfolded subsequently, we often wonder what proportion of those shareholders who maintained at the time that they would not give up their Naspers shares until they were pried from their cold dead hands have had the fortitude to hold on throughout what has been a tumultuous period for the Group.
- Its initial, much-vaunted moves aimed at unlocking shareholder value – small share buybacks, the creation of Prosus and, subsequently, the share exchange of Prosus shares for a portion of shareholders’ Naspers stake did a lot to line the pockets of investment bankers. However, it also created complexity in the corporate structure that ultimately saw the discount at which the company traded to the value of its investments widen materially.
- The fact that over 80% of its net asset value (NAV) was made up of its stake in Chinese tech company Tencent, resulted in the Group being caught squarely by the dramatic value destruction that investors in large Chinese technology platform companies, in particular, have suffered. This is a result of China’s multi-dimensional regulatory crackdown on its technology sector through 2021, fears from international investors about being caught on the wrong side of the growing geopolitical tension between China and the West, the increasingly authoritarian and unpredictable policy environment in which private sector companies have been operating and what is widely seen through the eyes of western investors as a self-inflicted economic own goal in China’s insistence on pursuing an unsustainable zero-COVID policy.
- As interest rates began to rise sharply in 2022 and the vast liquidity that central banks showered on financial markets to offset the pain of COVID-19 lockdowns began to be withdrawn, several asset bubbles started to deflate rapidly. Perhaps the most savage mauling so far in 2022’s market downturn has been in the area of what is referred to as “profitless tech”. Investors have turned heavily against these cash-burning ventures. This dramatic shift in sentiment has shone the spotlight on Prosus’s portfolio of investments across a range of internet verticals (classifieds, food delivery, etail, payments & fintech and edtech) – collectively, its Ecommerce division, which has been stubbornly lossmaking throughout its history.
So much for the past; what about the future? Before we get there, though, here is a quick reminder of what the Group (81% listed assets) comprises (see Figure 13).
Figure 13: Naspers/Prosus’ listed assets
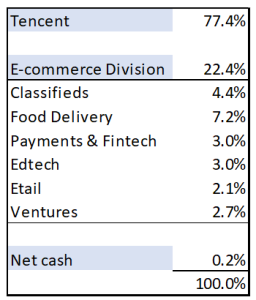
Source: Company data, Anchor Capital
Suffice it to say that, even though Prosus has reduced its stake in Tencent over recent years and will continue to do so gradually as it sells Tencent shares to fund its open-ended share buyback programme, the investment case for Prosus will continue to be dominated by Tencent for the foreseeable future. On the matter of the share buyback, though, the announcement of this open-ended share buyback programme was finally a move that management made that was unanimously seen as a meaningful step in the right direction in terms of unlocking value in the structure, and the discount narrowed in response. As one part of the investment thesis for the Group, at the current run-rate of share buybacks, because these are done at a significant discount to NAV, without any change in the underlying value of Prosus’s investments, the NAV/share will rise at c. 7%-8% p.a. Furthermore, although Tencent shares are being sold to fund the buyback, by virtue of the discount at which shares are repurchased, investors who do not sell their shares end up with a larger look-through exposure to Tencent than they had before.
Regarding Tencent, the share price has already rebounded 62% from its nadir at the end of October 2022, when Chinese equities sold off dramatically in response to investors’ disappointment at what key political appointments at the closely watched five-yearly Chinese Communist Party Congress implies for policy direction. Despite this rebound, Tencent is still 55% below its high of early 2021, just before the Chinese tech crackdown began in earnest. It currently trades on a P/E multiple of 21x earnings expected in 12 months – earnings projections which have been heavily downgraded over the past 18 months and thus likely capture, to a large extent, the impact of past regulatory changes and the weaker macro-outlook. Given that it is highly likely that what appears to be an increasingly erratic policy environment for Chinese companies will mean that a greater risk premium will be demanded by investors vs the past, much further upward rerating (anticipating it will attain a higher valuation in other words) for Tencent should probably not be assumed. However, with the regulatory reset now largely behind the sector, for the time being, Tencent benefiting from a depressed earnings base as it heads into 2023, the company set to benefit from its efficiency drive and the recent easing of China’s COVID restrictions, we think it is reasonable to expect improved operational performance from Tencent ahead. With that should come better investment performance too.
Turning to the Ecommerce division, 2022 has been marked by a clear shift towards (1) limiting investment chiefly towards supporting existing investments and share buybacks; and (2) driving the division towards profitability, with Prosus now placing a firm peg in the sand by committing to reaching profitability in aggregate for the division by 1H25 (calendar year 2024 in other words). Although investors’ current rejection of unprofitable tech means the progress Prosus has made in scaling up each of the verticals in its Ecommerce division has gone largely unrewarded, there is no denying that progress has been made. With a strong balance sheet, it has the financial muscle to support its portfolio of investee companies through a period ahead that will likely see the demise of many less well-supported competitors. With 1H23’s point of “peak investment” now behind the Ecommerce division, we expect steady progress towards profitability from here. As this division becomes self-sustaining from a funding perspective and demonstrates that it will be a source of faster growth than Tencent, we expect that the investment case for Prosus will increasingly expand beyond being seen merely as a discount play on Tencent.
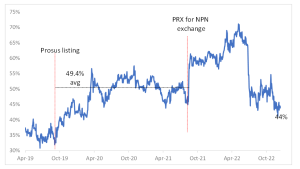
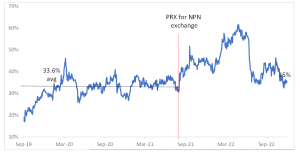
As far as further corporate action to address the discount is concerned, the South African authorities’ refusal to allow Naspers to be redomiciled offshore at the current time removes an option that we think the Group would have followed if it could – offer further Prosus shares for the remaining Naspers shares Prosus does not already own, thus eliminating the complexity of the cross-holding and achieving its desired aim of having its primary listing in a jurisdiction with a much deeper pool of capital available. With this door closed for now, another corporate action it could undertake to address the discount is not obvious. The charts below show how the discounts to the NAVs of Naspers and Prosus, respectively, compare with history. It is clear that both discounts narrowed sharply earlier in 2022 when the open-ended share buyback was announced. However, since the NAV uplift it achieves through the share buyback is a function of the size of the discount at which it can buy back shares, there is little incentive for Prosus to drive any further narrowing in the discount purely by accelerating the pace of its buyback. Thus, while the optionality always exists that there is further corporate action announced at some point, we think that, at current levels, the discount is not obviously out of line with history, and thus we do not think it is wise to base too much reliance on discount closure for investment performance in the next while.
Figure 14: Naspers discount to NAV
Source: Company data, Anchor Capital
Figure 15: Prosus discount to NAV
Source: Company data, Anchor Capital
To sum up, despite a solid rebound from their recent lows, we think investors will be well rewarded for keeping the faith with Naspers and Prosus. Initially, this is likely to be driven by a recovery in operational momentum in Tencent and a thawing in investor attitudes towards China (particularly if it turns out to be one of the few economic recovery stories of 2023!). Beyond that, however, growing acceptance that Prosus’s Ecommerce division is finally coming of age and able to sustainably drive growth in Prosus ahead of that of Tencent should begin to feature increasingly in the investment case. All the while, the optionality of corporate action aimed at unlocking value remains!
At Anchor, our clients come first. Our dedicated Anchor team of investment professionals are experts in devising investment strategies and generating financial wealth for our clients by offering a broad range of local and global investment solutions and structures to build your financial portfolio. These investment solutions also include asset management, access to hedge funds, personal share portfolios, unit trusts, and pension fund products. In addition, our skillset provides our clients with access to various local and global investment solutions. Please provide your contact details here, and one of our trusted financial advisors will contact you.