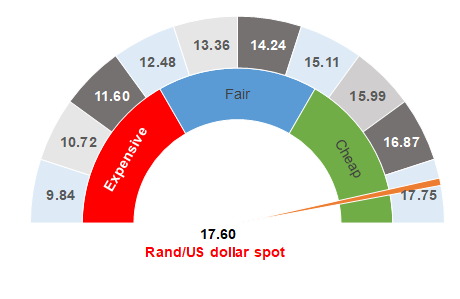
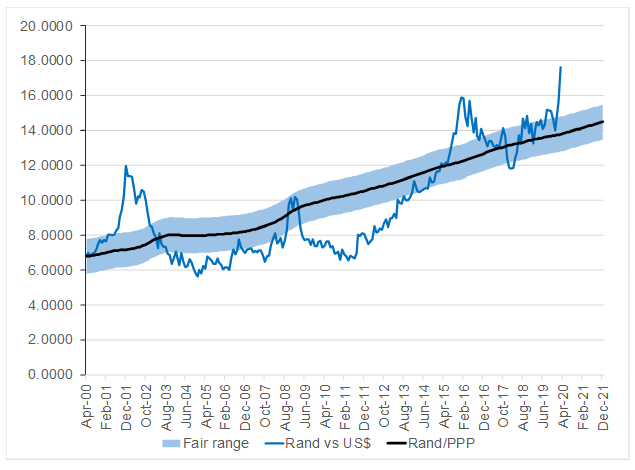
Figure 1: Rand vs US dollar
Source: Anchor
Last week was an incredibly volatile period in the markets. The weekend has given us the opportunity to reflect on the past week and, in this note, we highlight several charts for the three asset classes we monitor – the SA R186 bond yield, the US 10-year bond yield and the rand. The respective graphs speak for themselves as to how tough a week it has been and how compelling the opportunities in domestic asset classes are currently.
The world is highly unpredictable, and we cannot know when foreign selling of SA assets will stop, nor how much economic damage we will end up inflicting on ourselves. However, what we do know is that common sense will once again prevail at some point. When that point comes, domestic bonds are currently the most oversold in history and the rand is materially weaker against the US dollar vs its long-term value. From around Wednesday (18 March), we have seen some extreme volatility on local markets, although our markets have also moved more or less sideways since. We expect this volatility to continue for a while although, in the long run, we believe this is the best buying opportunity for the rand and domestic bonds that we have seen in many decades.
Figure 2: SA R186 (2026 maturity) vs Anchor fair value
Source: Anchor
Figure 3: Anchor SA bond yield monitoring
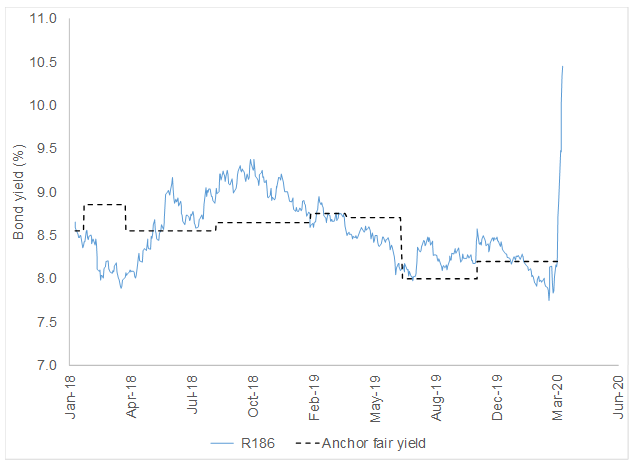
Source: Bloomberg, Anchor
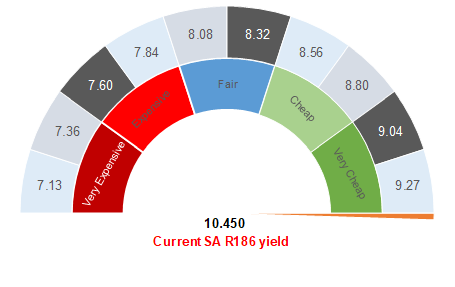
We remind our readers that the R186 SA government bond is a fixed deposit with the SA Government for a period of six years and then investors get their money back. That is what makes the current environment so bewildering – if you take a six-year view, you have a risk-free opportunity to lock-in a return of 10.30%. You can go to your access bond, borrow R1mn from your bank at an interest rate of 8.45% and lend this to the government at 10.45% for 6 years, thereby netting yourself an interest margin of R20,000 p.a. That is extremely appealing, and it shows just how dislocated our markets are at the moment.
Figure 4: US 10-year vs Anchor fair value
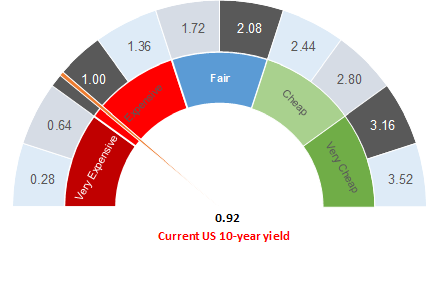
Source: Anchor
Figure 5: Anchor US bond yield monitoring
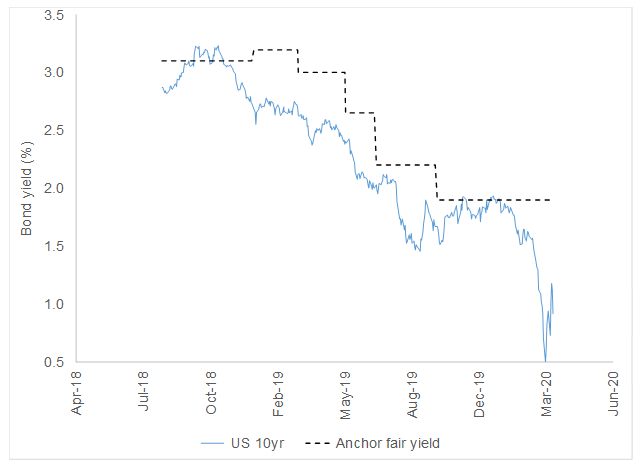
Source: Bloomberg, Anchor
The rand is trading at around R17.60/$1 and has been hovering around this level for a few days. As per the currency graph in Figure 1, this is more stressed than at the time of the global financial crisis in 2008 and Nenegate in December 2015. This stress is, however, in-line with that of the emerging market sell-off at the time of Argentina’s default on its external debt in 2002. In all instances, the rand recovered to its fair-value line – albeit on some of these occasions at a faster rate than on others. Currently, a lot of what we are seeing is US dollar strength as the rand is not much weaker against the Australian dollar or other currencies. As this develops and plays out over the coming months it is reasonable to expect the US dollar to give up some of its strength and revert towards more historic levels.
Figure 6: Actual rand/$ vs rand PPP model
Source: Bloomberg, Anchor