ECONOMICS
As we shift into the last quarter of 2025, the global backdrop remains more uncertain than ever, amid escalating US tariffs, geopolitical tensions, and growing geoeconomic fragmentation. Nonetheless, growth has proven resilient: the IMF now expects the world economy to expand by 3.0% in 2025 and 3.1% in 2026, up from April’s projections. This strength partly reflects the front-loading of global production and trade ahead of higher tariff rates, supported by easier financial conditions, a softer US dollar, buoyant equity markets, and fiscal expansion in major economies.
However, this momentum is likely to fade in the second half of 2025 as front-loaded activity unwinds, and policy uncertainty dampens investment. China’s growth is expected to slow to 4.8% in 2025 and 4.3% in 2026 amid weaker exports, fading fiscal support, and property-sector imbalances. Japan faces moderating corporate profits and investment, while the UK contends with fiscal tightening, policy uncertainty and higher trade costs. Europe’s recovery remains constrained by persistent industrial weakness and the lingering effects of its energy realignment. Nevertheless, eurozone growth should gradually strengthen next year, underpinned by easier credit conditions following European Central Bank (ECB) rate cuts, infrastructure spending in Germany, and higher defence expenditure.
In the US, tariff effects are compounded by lower immigration and shrinking public employment, even as technology-driven investment and fiscal support from US President Donald Trump’s One Big Beautiful Bill Act sustain activity. The US Federal Reserve (Fed) faces a delicate balancing act: moderating inflation vs a softening labour market. At its September meeting, the Fed lowered rates by 25 bps in a move which Fed Chair Jerome Powell framed as a “risk management” decision. Markets interpreted this as the start of a broader easing cycle, with expectations for a further 100 bps in cuts by the end of 2026. However, the Fed’s latest projections reveal a growing divide within the Federal Open Market Committee (FOMC) over the appropriate policy path, reflecting the tension between a softening labour market, resilient GDP growth, and persistently high inflation. At the time of writing, the current US government shutdown holds the potential to further complicate near-term decisions by disrupting access to key jobs and inflation data. Ultimately, the Fed’s next steps will hinge on incoming economic indicators. Still, the risk of political interference (particularly under a possible Trump-influenced Fed) adds a layer of uncertainty to the future rate trajectory.
Trade policy remains a key global risk. The US and China aim to finalise a tariff agreement by 9 November. The outcome of negotiations will significantly influence global trade dynamics and economic growth, with failure to reach an agreement likely to trigger renewed tariff escalation. The US Supreme Court is also set to rule on the legality of reciprocal tariffs —a decision that could see SA’s 30% tariff annulled. While no date has been set, a decision is expected to be handed down before year-end, although there is the possibility that it may not arrive until next year. Meanwhile, the African Growth and Opportunity Act (AGOA) expired on 30 September, with no clear timeline for renewal amid US legislative gridlock.
Domestically, South Africa (SA) is benefitting from favourable cyclical forces: Fed rate cuts, a weaker US dollar, and surging precious-metal prices are supporting a stronger rand, easing inflationary pressures, and paving the way for further South African Reserve Bank (SARB) rate cuts. We expect another 75 bps of gradual easing through 2026 to end 2027 as inflation moderates and the government endorses a lower inflation target. Still, structural constraints – primarily weak confidence, sluggish reform, and fiscal fragility- continue to cap the recovery. A key challenge lies in anchoring inflation expectations. Although at historic lows, they remain well above the SARB’s new 3% preference, underscoring how entrenched price-setting behaviour takes time to recalibrate. National Treasury’s Medium-Term Budget Policy Statement (MTBPS) on 12 November will focus on fiscal consolidation, debt stabilisation, and the formalisation of this lower target. On balance, SA’s near-term outlook is improving, aided by firmer terms of trade, progress on energy and logistics reform, and the country’s likely removal from the Financial Action Task Force (FATF) grey list. Yet, as 2025 draws to a close, risks tied to tariffs, global growth moderation, and domestic policy execution will remain in sharp focus.
SA EQUITIES
At a headline level, 2025 has been an exceptional year for the JSE. YTD (to end 3Q25), the FTSE/JSE Capped SWIX Index is up 31.0% and the MSCI SA Index, the globally recognised benchmark for South African equities, has risen by 43.1% in US dollar terms. This caps off a remarkable five-year period for the local market, which, to the end of September 2025, delivered a total return of 112.5%, only marginally behind the S&P 500’s 114.1% return over the same timeframe. Our models suggest a continued, albeit modest upside of around 10% for JSE-listed equities over the next twelve months. As a result, we maintain our neutral recommendation for the asset class.
These results are particularly impressive given the challenges SA has faced over the past five years, including COVID-19 pandemic-induced shutdowns, the July 2021 social unrest, inconsistent foreign policy, Stage 6 loadshedding, sluggish economic growth, and persistent policy inertia and corruption. Despite these headwinds, investor sentiment has been buoyed by strong corporate balance sheets, improving capital allocation discipline among the major listed companies, and an encouraging shift toward shareholder returns through dividends and buybacks.
A key factor behind the JSE’s resilience has been the ongoing reduction in reliance on domestic economic outcomes. The structure of the local market has evolved significantly. While many listed companies still have operations in SA, the most meaningful earnings growth has come from those with diversified or offshore exposure. Consequently, the “domestic” portion of the local bourse (so-called JSE Inc. shares) now accounts for less than half of the total index weighting, reflecting a gradual but persistent decoupling from the local economic cycle.
Throughout 2025, the market’s performance has been defined by a handful of dominant trends that took hold early in the year and have persisted since: the outperformance of precious metals (particularly gold and PGMs), strength in telecommunications companies, and continued momentum in the Naspers/Prosus complex. As at 30 September, a significant portion of the index’s gains has come from these sectors. While some of these firms maintain domestic operations, the bulk of their revenues are derived from exports or offshore investments, underscoring the internationalisation of the South African equity market.
Another notable feature of 2025 has been the return of foreign capital inflows into EMs more broadly, supported by expectations of global interest rate cuts and a stabilisation of the US dollar. Domestic equities have benefitted from this shift, particularly those offering attractive valuations and solid free cash flow yields.
At the start of the year, we were optimistic that the political developments of 2024 would help rebase domestic growth toward 2%, providing a much-needed lift to confidence and investment. However, it has become evident that the pace of reform implementation remains slow, and the translation of policy intent into real economic activity will likely take longer than initially hoped. Consequently, domestically oriented sectors such as retail, banking, and industrials have continued to lag, while capital has flowed toward areas experiencing cyclical tailwinds, namely precious metals and telecommunications.
Looking forward, we believe relative value opportunities are emerging across much of the JSE. Many high-quality domestic companies are now trading at compelling valuations, reflecting excessive pessimism around the local economy. Accordingly, we have begun reallocating capital away from commodity producers, particularly those whose share prices have moved ahead of fundamentals and recycled this capital into select domestic counters that offer attractive risk-reward profiles.
While we are not calling the end of the current upcycle in precious metals, we do believe that a greater balance is warranted within portfolios. It would not surprise us to see a period where market leadership rotates toward local banks, retailers, and industrials, those segments that have been largely overlooked amid the remarkable rally in commodity producers.
In our view, the outlook for JSE-listed equities remains constructive but nuanced. The combination of low valuations, solid dividend yields, and improving policy direction provides a supportive backdrop for medium-term returns. However, the lack of near-term growth catalysts and persistent structural constraints warrants a measured and selective approach to local equity exposure.
SA LISTED PROPERTY
The SA-listed property sector has recovered materially over the past two years, even though the domestic-focussed counters are well off their all-time highs. Property companies are in a much better place now, and the rental reductions initiated by the COVID-19 pandemic are now largely out of the base. Conservative management has also seen balance sheets improve, and the valuations are now at levels where capital raising is again a possibility.
The earnings base of the sector is back to a sustainable level, and growth from here forward is likely to be closer to 5% than 10%. At forward dividend yields of around 8.5% for local counters, property companies look fairly valued relative to recently re-rated bond yields. So, it is a case of comparing an 8.5% property dividend yield growing at 5%, with a 10-year bond yield of 9.5% which is not increasing.
Our 12-month forward total return projection for the sector is 11%, which comprises a slight capital increase in addition to the 8.5% dividend yield. Net portfolio growth is starting to return, and the interest cost will begin to decline further as interest rate cuts continue. Offshore portfolios are performing better, and growth prospects look reasonable. A reasonable portfolio with a dividend yield of 7%-9% and growth of 3%-5% can be constructed.
DOMESTIC BONDS
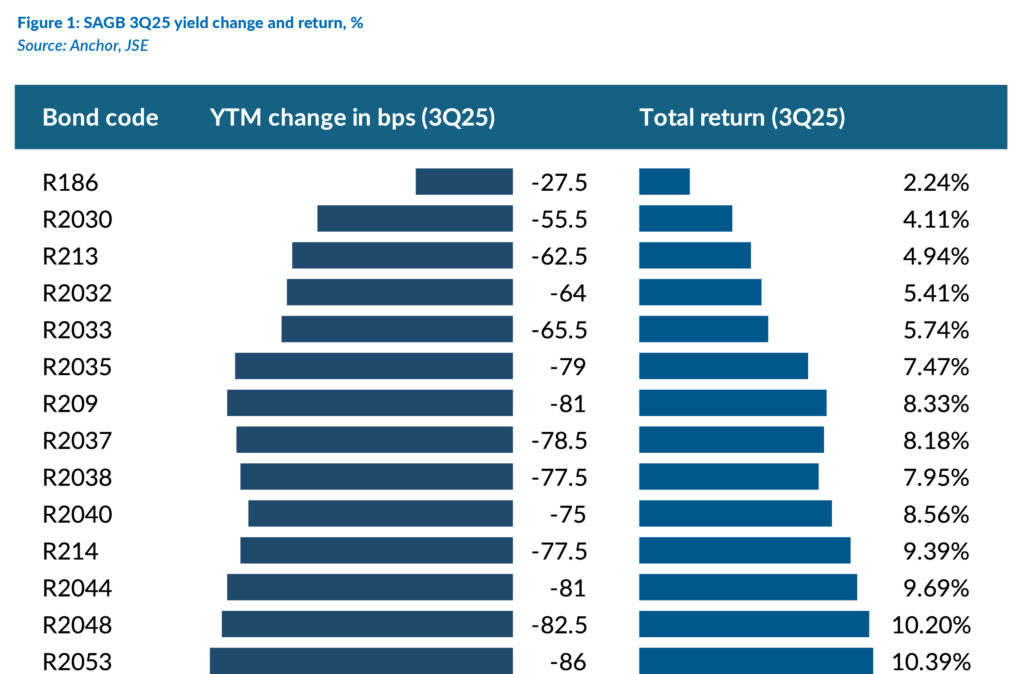
The South African Government Bond (SAGB) yield curve bull-flattened in 3Q25, as longer-dated yields declined more sharply than those at the front end (Figure 1). The SA All-Bond Index (ALBI) delivered a strong return of 6.94% in 3Q25, with longer-dated bonds driving the bulk of the performance (Figure 1). The sharp decline in yields was primarily driven by a continued recalibration of both survey-based and market-implied inflation expectations to lower levels.
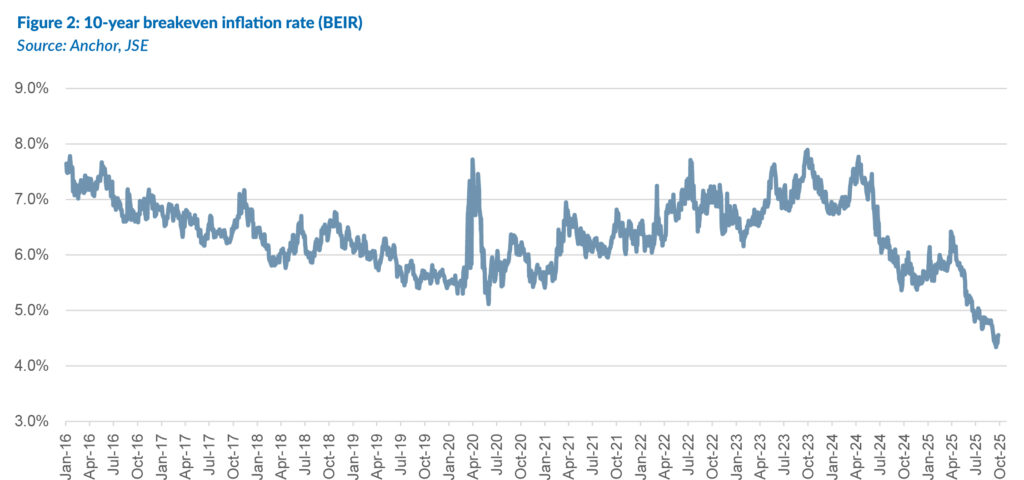
The key driver of the decline in local bond yields this year has been the adjustment in inflation expectations. Market participants have recalibrated expectations lower following commentary from the National Treasury and the SARB, both of which reaffirmed their commitment to a lower inflation target. The 10-year breakeven inflation rate (BEIR) – the average inflation rate investors expect over the next decade – ended 3Q25 at 4.5%, having compressed by roughly 100 bps since the SARB’s May meeting (Figure 2).
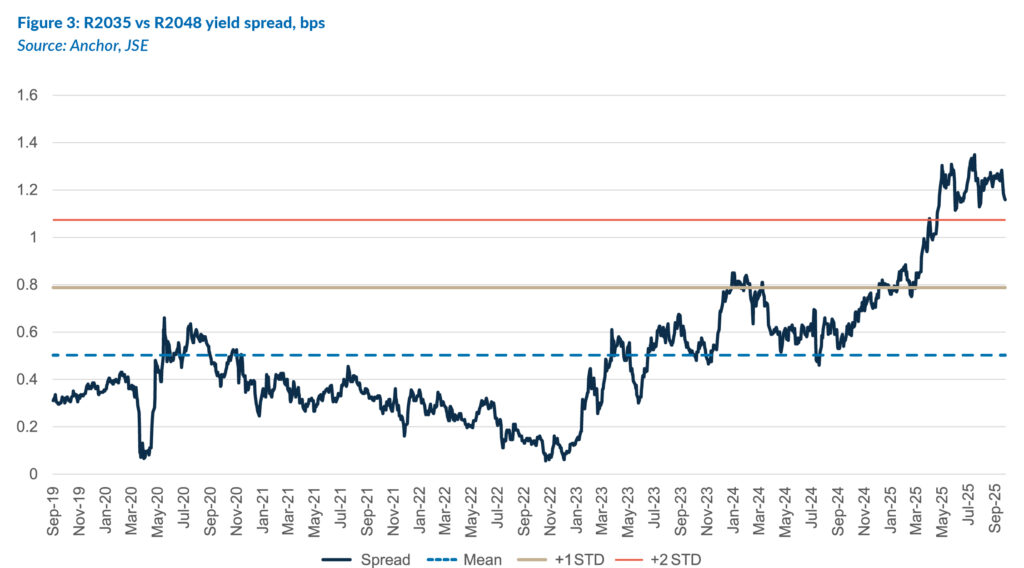
Despite the bull flattening of the SAGB curve in 3Q25, the curve remains steep, particularly from the belly (around the 10-year point) onwards. As at 30 September 2025, the R2035–R2048 yield differential (the difference in the YTM of these two bonds) was still more than two standard deviations above its long-term average. This reflects both broader trends in global bond markets and a jacked-up local term premium on longer-dated bonds, driven by ongoing fiscal and political concerns (Figure 3).
To capture declining inflation expectations, a steep yield curve, and stronger terms of trade from elevated commodity prices, our models have been flagging curve strategies like bull flatteners. We have implemented these across many of our domestic fixed-income portfolios by increasing exposure to longer-dated SAGBs.
The curve’s steepness is not only visually pronounced (more than two standard deviations above its long-term mean) but also statistically steep, suggesting limited risk of further steepening. Although many bond pairs have lost their mean-reversion characteristics, we believe flattener trades continue to offer a favourable asymmetrical risk-reward profile.
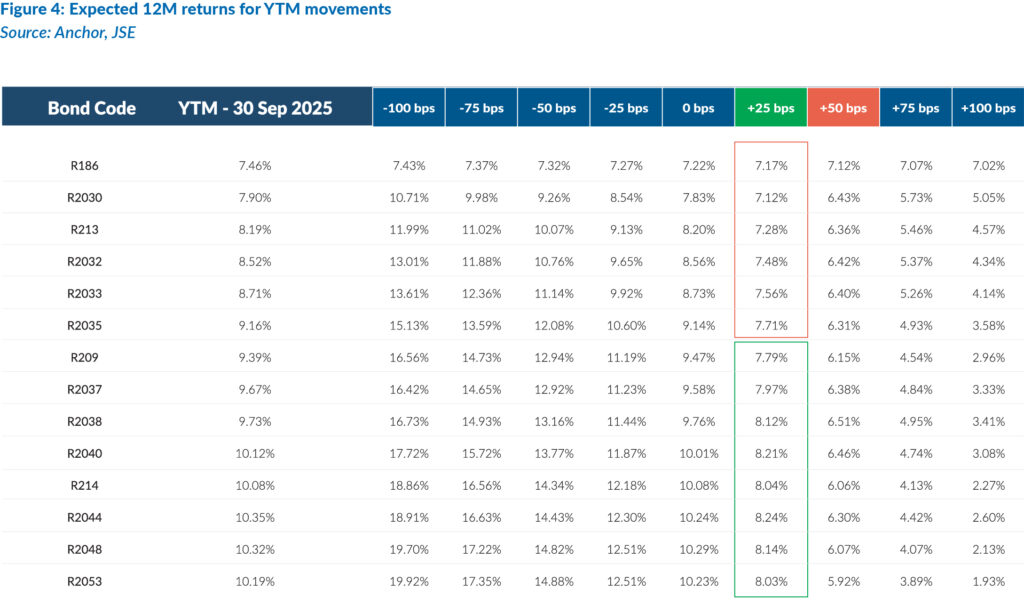
The elevated long-end yields also provide meaningful protection against upward parallel shifts in the curve. Even under a +25-bps parallel move higher in yields, longer-dated bonds are expected to outperform shorter maturities over the next 12 months (Figure 4). In some cases, the return advantage holds even under a +50-bps parallel curve shift. On this basis, we continue to see compelling value in the 15–30-year maturity segment, and we therefore maintain our constructive view on domestic bonds.
SAGBs continue to offer some of the highest yields in the emerging market (EM) universe, in both nominal and real terms. However, these elevated yields also reflect persistent concerns about SA’s fiscal sustainability. With politics on a knife-edge and without credible, sustained commitments to expenditure reduction and broader fiscal consolidation, a meaningful decline in SAGB yields appears unlikely. We estimate domestic bonds could deliver returns of around 9.2% over the next 12 months, equating to a real return of roughly 6%.
THE RAND
Anchor subscribes to a purchasing power parity (PPP) model for the long-term value of the rand. Any such model clearly shows that the local unit is cheap, as is evident from Figure 5 below. Our modelled fair value of the rand is in the R13.67-R15.67/US$1 range. The currency usually trades away from its “fair value”, and it is reasonable to expect it to remain cheap for the foreseeable future.
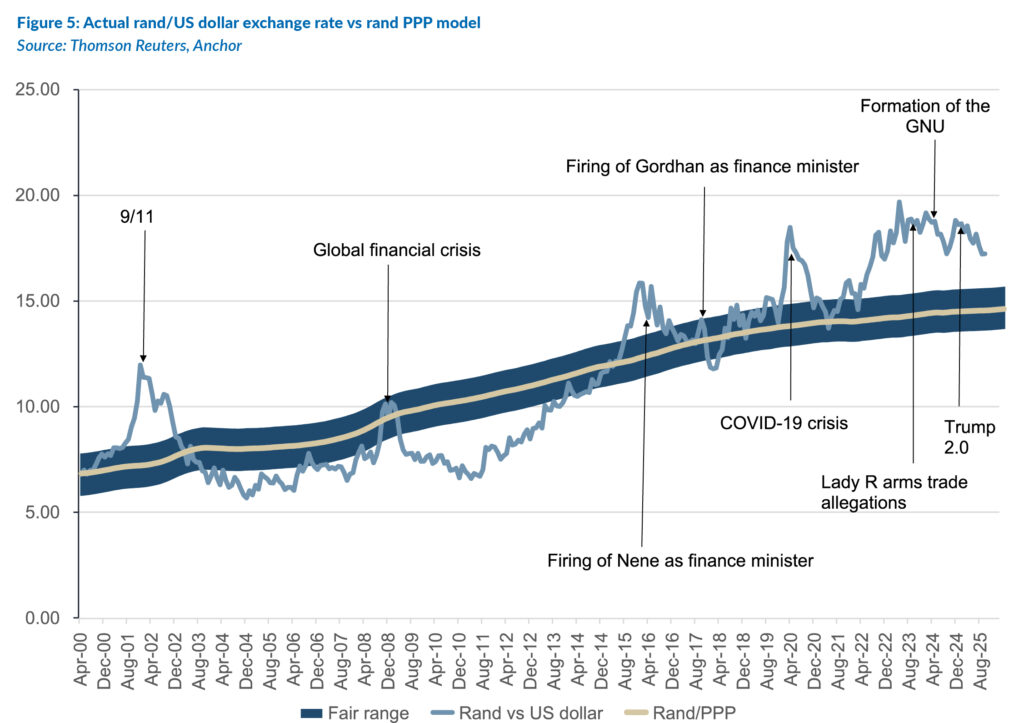
The rand continues to benefit from the lower oil price, with our terms of trade (which measure the ratio of a country’s exports relative to imports) being positive. It is reasonable to expect a strong trade surplus and some support for the rand. Simultaneously, the US dollar has been weakening as the US heads into its interest rate-cutting cycle, and the US Fed is signalling a significant number of interest rate cuts over the next year.
We see continued support for the narrative that the US dollar will likely weaken further. Some analysts expect the euro to strengthen by another 3% to 5% against the dollar.
Nevertheless, this remains a volatile time, and many risk factors could weaken the domestic currency. However, we believe that a gradual further recovery in the rand is the more likely outcome. Our base case assumes the rand will end the next twelve months closer to R17.00/US$1 and we have modelled this exchange rate for the report to reflect our expectation of a continued modest recovery for the rand.
We also note that as the SARB moves toward a 3% inflation target and US inflation remains marginally elevated, the inflation differential between SA and the US is expected to narrow, implying a far more gradual depreciation of the rand in future. We note that the rand has weakened by less than 1% p.a., on average, over the past five years. It is reasonable to expect that this long-term trend will continue.
GLOBAL EQUITIES
The global equity market remains in a three-year bull market, and conditions are intact for this to be sustained. We expect an 8% return from global equity markets in the next 12 months, following double-digit returns in 2025 YTD.
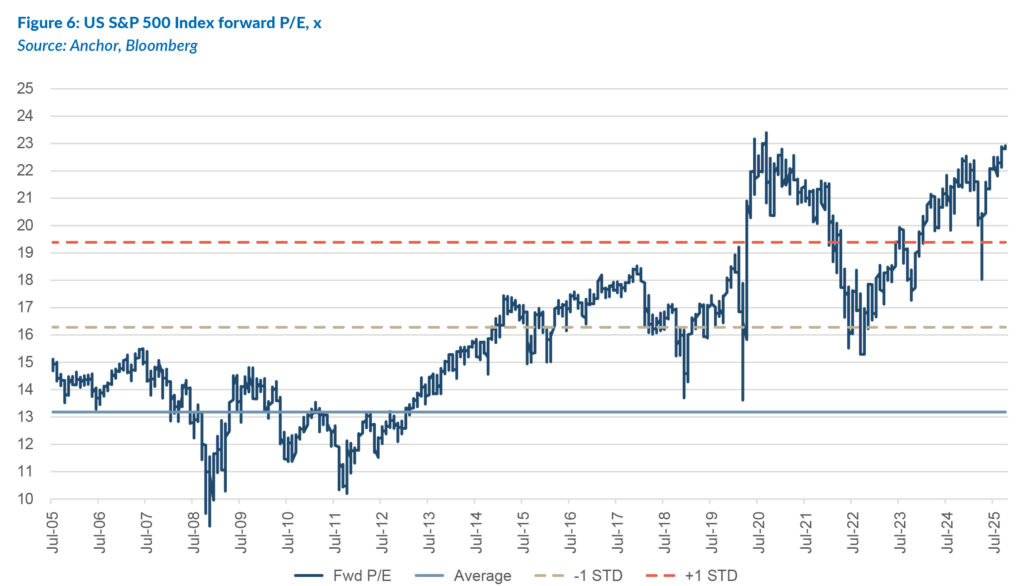
This return projection mirrors an average return from global equities. Economic conditions and the earnings outlook are well above average, but the market has progressively got more expensive over the last few years. As shown in the chart below, at a forward 23x P/E multiple, the US S&P 500 Index is close to the most expensive it has been in over 20 years.
So, while prospects are good, one could argue that this is priced into the market. Consequently, we expect some de-rating over the next 12 months as the 14% projected earnings growth materialises. We are cautious with new money, as the ride can get bumpier when the starting point is elevated. History tells us there will be corrections coming, but we would view these as entry points.
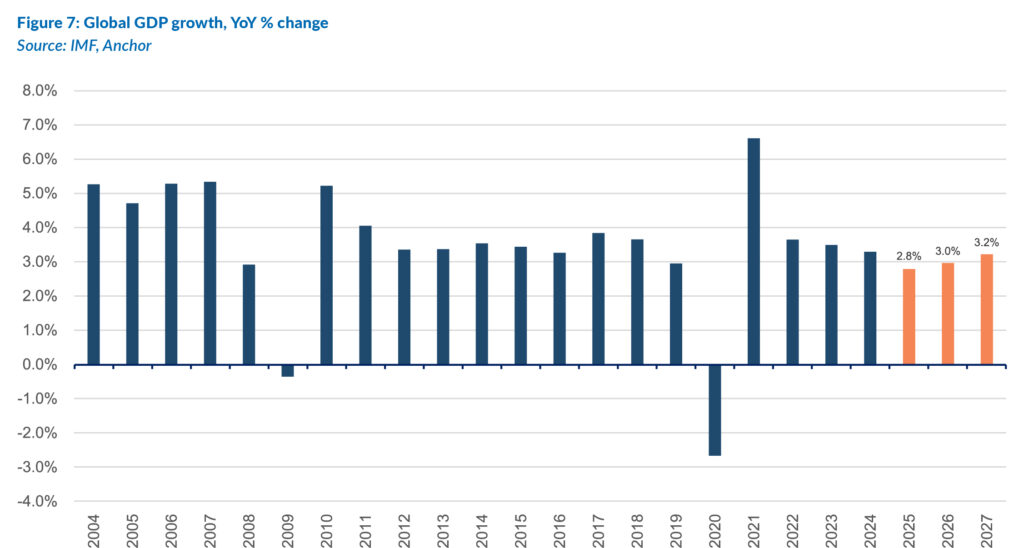
The two simplest graphs to illustrate what the market is seeing are Figures 7 and 8. The first chart is the expectation that global GDP growth will accelerate into 2026 and beyond (at a 3%-plus rate) following a tariff-fuelled growth slowdown in early 2025.
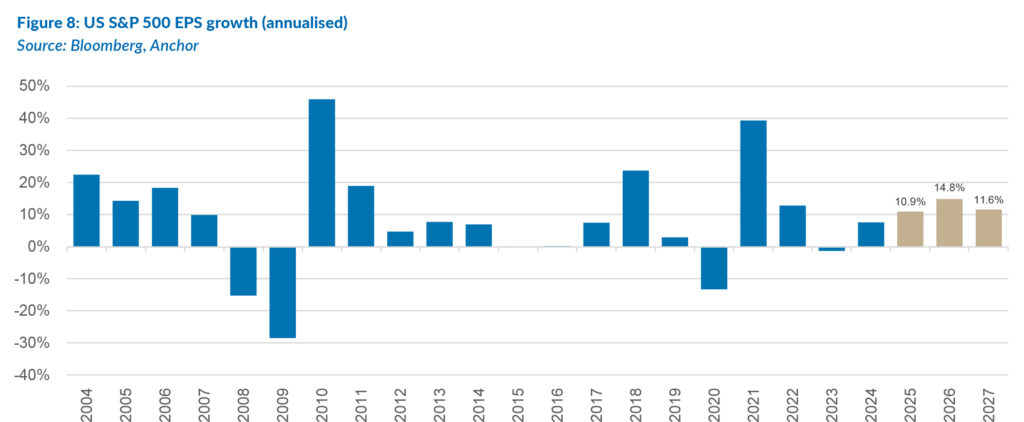
The second graph shows historic and projected annual earnings growth for the US S&P 500. Market consensus is for two consecutive years of double-digit earnings growth from the US market, following 14% US earnings growth in 2025.
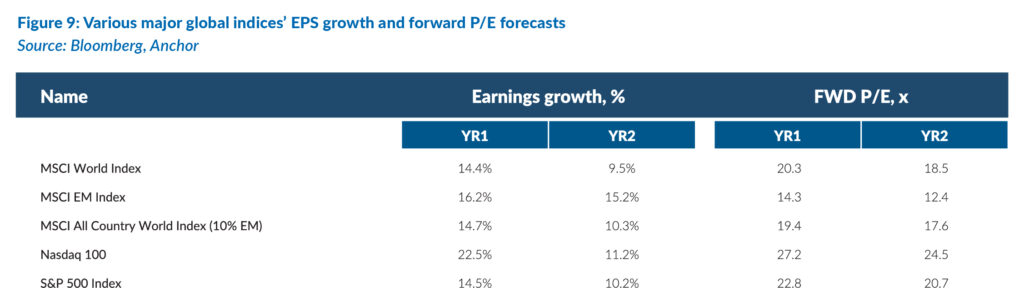
The table below shows the earnings growth and forward P/E multiples of various global indices.
The key reasons we remain optimistic about the outlook are as follows:
- Economic growth is strong. Despite the recession predictions of 12 and 24 months ago, the global economy remains strong, and US employment is solid, albeit showing recent signs of weakening slightly.
- AI spending: A key reason for the strong economy is unprecedented capex spend on AI capacity and the related energy needs. The projected US$400bn spend in 2024 (and 20%-plus growth in 2025) is close to 2% of GDP and is feeding through into many sectors of the economy.
- Strong earnings growth: This spending is driving strong earnings growth forecasts, as shown above.
- Interest rates are high: US interest rates remain high and will be reduced further, which will stimulate the economy. The heavily publicised anticipated inflation impact from tariffs is not materialising to any great extent, and this will be closely watched in the coming months.
- The dollar is weak: US dollar weakness (down over 10% YTD, but recently stabilised) is positive for US dollar earnings and will continue to have a positive impact for around another six months.
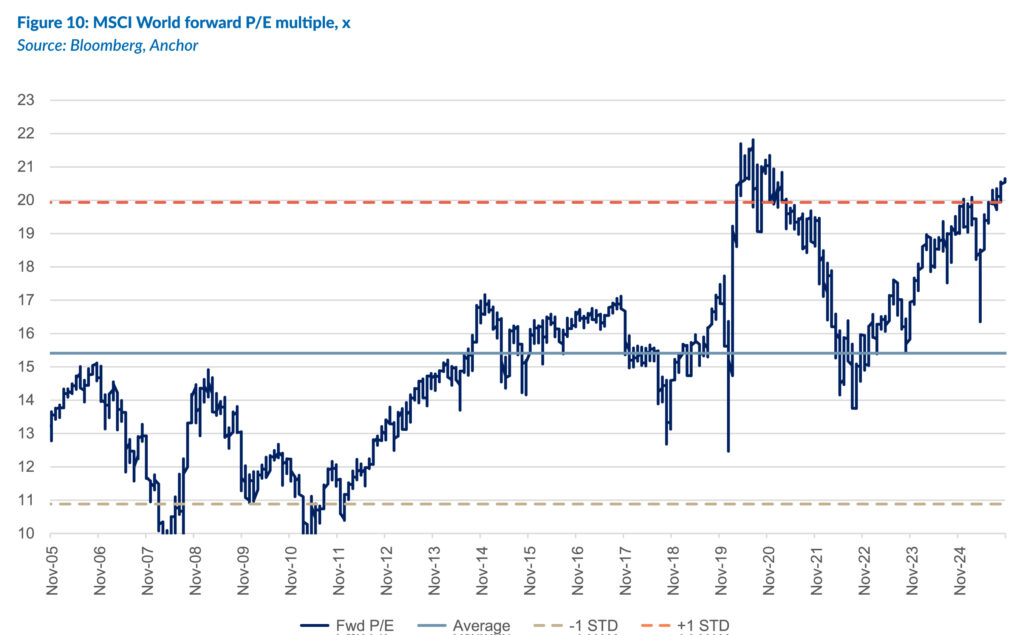
Non-US equity markets have offered a cheaper entry point into developed markets (DMs) for the last few years, but the outperformance of the non-US shares has also seen the MSCI World reach expensive territory, at a forward 20x P/E.
The market backdrop is positive, but faith has to be sustained at these valuation levels. As always, market corrections are a possibility if economic conditions decline. The economy has been very strong considering the tariff uncertainty, and these signs will be closely monitored.
We would increase our allocation to alternative investments, which include private equity, property, private debt, structured products and hedge funds. In times of uncertainty, these more stable asset classes become increasingly attractive, and declining interest rates make the returns even more relatively attractive. Anchor has a range of private capital alternative funds, which are ideal for times like these.
GLOBAL BONDS
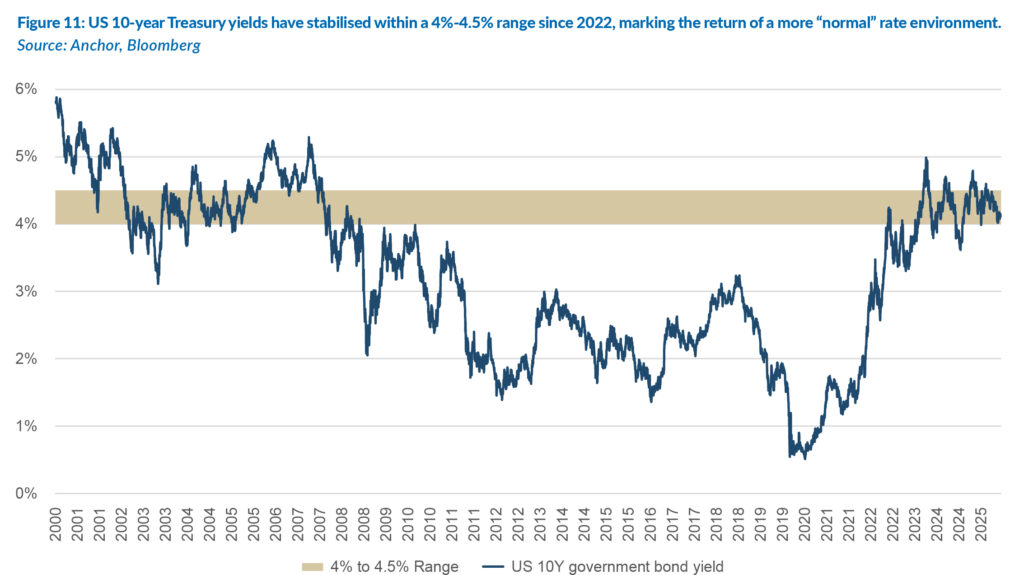
The US government’s 10-year borrowing rate has spent most of the past three years trading in a relatively narrow range between 4% and 4.5% p.a., with the current yield of 4.1% sitting comfortably within that band. After several years of sharp swings, this stability marks the return of a more predictable US rate environment — one that reflects the balance between moderate economic growth, contained inflation, and manageable fiscal dynamics.
Investor conversations remain dominated by familiar themes: the sustainability of US government borrowing, persistent fiscal deficits, and the risk that inflation could reaccelerate. While each deserves attention, none appear likely to push US yields materially higher from here.
Concerns over the US fiscal outlook are understandable given the ongoing need for substantial government financing. Yet fears that bond buyers might demand materially higher yields to absorb Treasury issuance are likely misplaced. The US remains the world’s primary reserve currency issuer, and Treasuries are still the most liquid and systemically important asset class globally. Domestic and foreign institutions alike continue to hold them as the cornerstone of collateral and risk-free benchmarks.
Similarly, US inflation has recently stabilised and continues to trend towards the Fed’s 2% p.a. target. The most persistent elements of inflation — services such as housing and insurance — are normalising gradually, and recent data suggest that the disinflation process is continuing. Importantly, the renewed tariff measures from the current administration should have a muted impact on the overall inflation path. Goods make up a much smaller portion of US consumption than services; many categories will likely be exempted or rerouted through jurisdictions with lower tariffs, and a meaningful portion of the costs will be absorbed along the supply chain by manufacturers, exporters, and importers rather than being fully passed on to consumers.
The Fed’s policy stance remains a central focus for markets. After a prolonged tightening cycle, the Fed has delivered 1.25% of cuts in the past year. It is expected to deliver two further 0.25% rate cuts before year-end and three more 0.25% cuts over the course of next year, taking the fed funds rate to around 3% by the end of 2026. That trajectory implies a gradual return toward a neutral policy setting consistent with moderate growth and near-target inflation. Despite the current US administration’s attempts to influence Fed monetary policy decisions, the checks and balances to maintain political independence at the Fed remain firmly in place and supported by the US legal system. The Fed has seven governors, with three having been appointed by Trump. The three Trump appointees have acted prudently, focusing on their dual mandate of keeping inflation stable at around 2% p.a. and maintaining full employment. Given that the 10-year yield already reflects expectations of easing policy, we see limited scope for meaningful yield movement from here. The equilibrium around 4% remains plausible: strong enough to compensate investors for duration risk, yet not so high as to signal macro stress.
In this environment, the 12-month total return outlook for US 10-year government bond investors is c. 4% in US dollar terms, entirely driven by coupon income. The range of likely outcomes is positively skewed — with limited downside unless inflation expectations rise sharply, and moderate upside if US economic growth stalls.
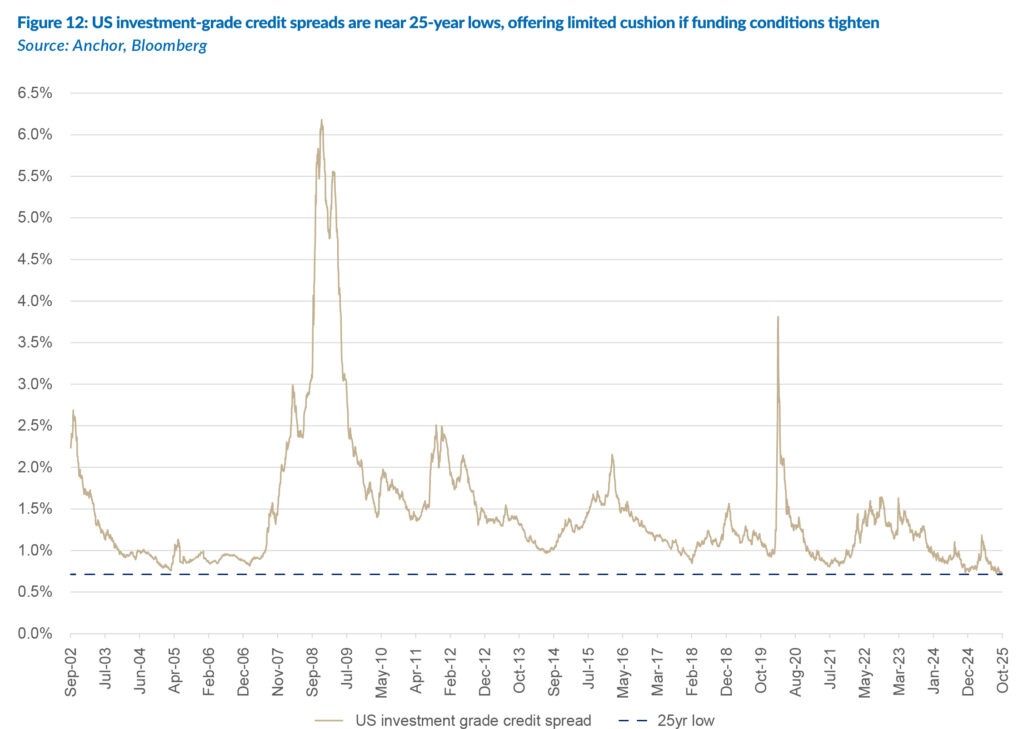
The story for US investment-grade corporate bonds is slightly less appealing. Yields around 4.8% p.a. remain attractive in absolute terms, but the credit spread over US Treasuries (0.73%) is near historic lows. Investors are therefore being compensated very little for taking corporate credit risk in an environment where funding costs remain high and refinancing volumes are starting to pick up.
Corporate balance sheets are generally solid, but the combination of slower revenue growth and elevated borrowing costs is gradually eroding some of the resilience built up during the past decade. We anticipate that investors will demand slightly higher compensation for risk over the next year, resulting in a modest widening of spreads to around 0.9%. That widening should offset part of the coupon income, leaving a total return expectation of roughly 4% over the next twelve months. This reflects a valuation asymmetry rather than a concern about widespread defaults: corporate fundamentals remain sound, but with spreads this tight, the margin of safety is slim.
GLOBAL PROPERTY
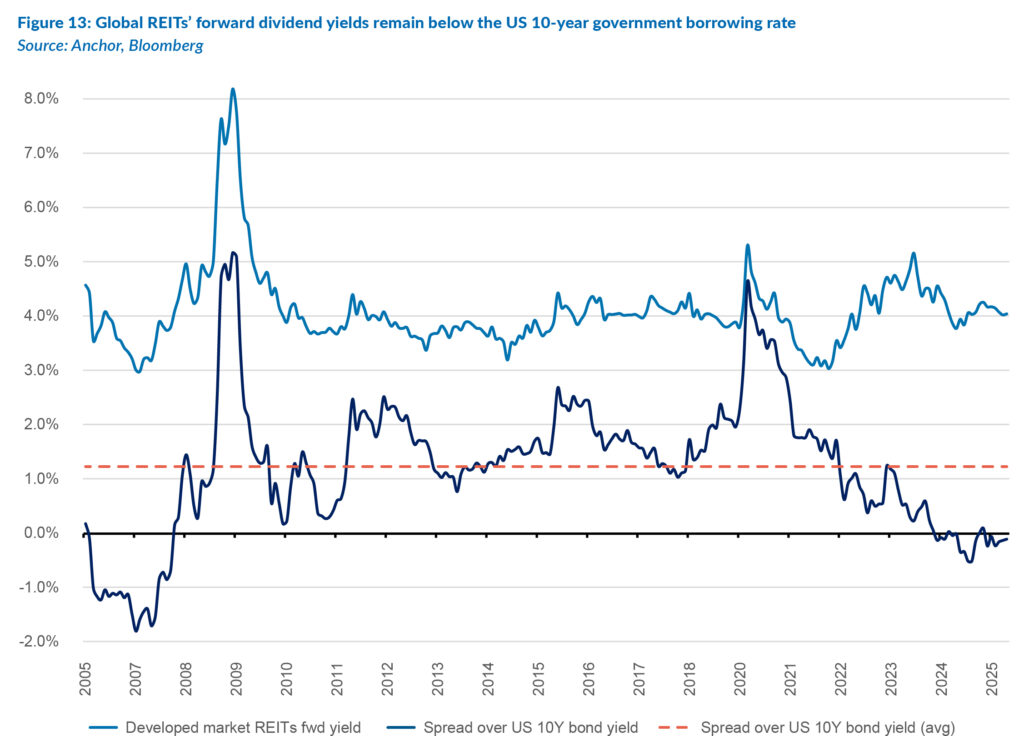
US real estate investment trusts (REITs), which account for the bulk of the global DM listed property universe, have settled into a more stable pattern after several volatile years. The asset class continues to trade at valuation levels that reflect a higher-for-longer rate environment, but without any apparent signs of distress. Forward dividend yields on global DM REITs are around 4.1%, which remains marginally below the 4.13% yield on the US 10-year government bond, leaving little room for a valuation re-rating in the near term.
Over the past decade, the composition of the REIT market has changed significantly. Traditional sectors such as office, retail, and residential property have gradually lost market share to newer ‘digital economy’ segments such as logistics and data centres. This shift has altered the behaviour of the asset class — it now offers a lower yield and lower correlation with the broader business cycle, but also less sensitivity to short-term shifts in monetary policy.
The challenge for REIT investors has been that the income premium over government bonds — which historically compensated for their higher risk profile — has largely disappeared. That narrowing spread does not necessarily mean that REITs are unattractive. Still, it does mean that investors must now rely more heavily on dividend income and modest earnings growth rather than capital appreciation to generate total returns.
Beneath the surface, the valuation picture is far from uniform. The range of forward dividend yields across REIT sectors is historically wide, reflecting the diverging fortunes of the ‘old economy’ and ‘new economy’ segments:
- Data centre REITs (forward dividend yield 2.7%) remain at the expensive end of the spectrum, supported by continued demand for cloud storage, AI-related infrastructure, and hyperscale data capacity.
- Retail REITs (forward dividend yield 4.9%) are showing signs of stabilisation, with foot traffic and rental collections back at pre-pandemic levels, while balance sheets remain in generally good health.
- Office REITs (forward dividend yield 5.6%) remain the clear laggards, weighed down by persistently high vacancy rates and the need for capital-intensive refurbishments to attract tenants back into city centres.
The wide dispersion between sectors illustrates the continued structural change within the property universe. For office and retail, the path to normalisation will likely remain gradual. Rental reversions in both sectors have stabilised but remain well below long-term averages, and the cost of funding still constrains near-term growth. By contrast, the growth trajectory for data centres and logistics remains underpinned by secular demand from digitalisation and supply-chain reconfiguration. However, valuations in these areas already discount much of that optimism.
The attraction of listed property remains primarily its income component, which continues to account for the bulk of expected returns. With forward dividend yields around 4.4%, REITs provide a steady stream of income in an environment where nominal yields on government bonds remain elevated but stable. The near-term total return profile is therefore largely dependent on income growth, rather than valuation changes. We expect the sector’s aggregate earnings and dividend growth to run at around 1.5%–2% over the next twelve months, reflecting moderate rental growth and slightly lower financing costs as US policy rates move down. Under our base case — where the Fed funds rate declines gradually to around 3% by the end of next year and the US 10-year yield remains anchored between 4% and 4.5% — we anticipate a total return of around 6% in US dollar terms, comprising:
- 4.1% from dividend income, and
- 1.9% from income growth,
- with valuations (price-to-FFO multiples) remaining broadly stable.
Dividend coverage across the sector remains healthy, and payout ratios are broadly sustainable given current cash flow levels. REIT balance sheets are in better shape than many feared at the onset of the rate-hiking cycle, with refinancing activity manageable and most listed entities having termed out a large portion of their debt at fixed rates. The gradual easing of policy rates should begin to relieve some pressure on funding costs through 2026.
Investor sentiment toward listed property remains cautious, with concerns centred around three ongoing themes:
- Structural vacancy in office space — persistent hybrid work trends and corporate downsizing continue to weigh on office demand, with vacancy rates in major US markets still near multi-decade highs.
- Retail adaptation — the better-quality retail REITs are stabilising, but the sector continues to evolve toward mixed-use and experiential formats, limiting near-term growth but improving long-term resilience.
- Technology-driven growth in data centres and logistics — these sectors are capturing a growing share of capital inflows. Still, high valuations and regulatory scrutiny over energy usage and zoning have introduced new uncertainties.
In aggregate, these structural dynamics are likely to keep the asset class’s overall rating stable — neither cheap enough to invite a broad re-rating, nor expensive enough to trigger meaningful derating.
Global DM REITs, led by the US, now operate in an environment of normalised yields, steady income, and moderate growth. While the era of outsized valuation gains is over, the current mix of income stability and predictable fundamentals supports a measured return outlook.