Anchor clients who have read some of my previous articles will know that over time, I have tilted to focus more on business and management quality, with valuations a crucial but more secondary part of the overall stock evaluation process. I have become a lot more open-minded about “optic valuations”. Many global shares I have followed have appeared “optically” expensive at times (e.g., high 12-month forward P/E multiples). Yet, investors have been making excellent returns on some of these shares over many years.
So much of traditional valuation work is done bottom-up to reveal a set valuation number. Below that number, the share is a Buy, and above that, it is a Sell. A potential flaw with the bottom-up approach is that no one can really see the future. Inputs into a bottom-up model can end up being off by an order of magnitude.
Furthermore, a rigid number of what a stock might be worth leaves the investor in a quandary as to what to do when the stock price hits that pre-determined level. We know from history that a significant part of successful investing is holding world-class companies for many years rather than trying to time in and out of the shares. Holding a quality stock for extended periods will invariably mean hanging on through periods when the share appears optically expensive and one is tempted to sell. Imagine if Amazon founder Jeff Bezos had sold his Amazon shares every time a bottom-up model suggested it was a bit overvalued.
Despite the flaws I have highlighted, there is nothing inherently wrong with doing bottom-up valuation analysis on stocks as part of the overall process. I have always done so myself in the past and will continue to do so in the future. However, in this article, I propose an additional way of evaluating stocks by inverting the process. Rather than a bottom-up approach, one can attempt to back out what future is being implied by a company’s market valuation.
Inverting the analysis involves the following:
- Finding businesses you really like, e.g. management, moats, business model, strong balance sheet, free cash flow (FCF), good capital management, secular tail winds, etc.
- Backing what future is being implied by the stock price and deciding whether that is a plausible outlook for the future.
Inverting the process provides a test for valuation reasonableness. It warns of valuations that will be very hard to grow into, no matter how good the quality of the business is. It also highlights company valuations that set a low hurdle to jump over.
What inverting does not do:
- Provide short-term trading signals.
- It is not a valuation black box generating rigid buy and sell signals.
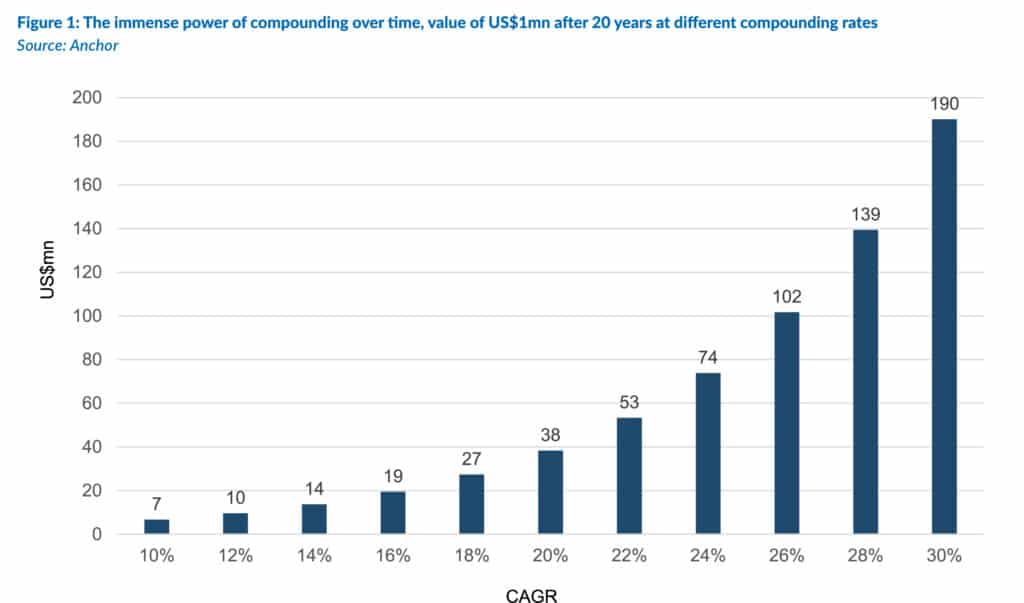
On a 20-year view, a company that can compound its stock price by over 30% p.a. is incredibly rare. Even above 20% p.a. is uncommon. The US market has averaged about 10% p.a. in US dollar terms in the very long run. Very simplistically, that remains the base hurdle for any US company over time.
The power of compounding is immense. The difference between two companies growing at 12% and 16% in any given year may not seem significant. However, that relatively small gap compounded over 20 years can lead to significantly different valuation outcomes.
As we demonstrate in the chart below, a 30% p.a. compounder is worth 27x more than a 10% compounder after 20 years. A 20% compounder is worth 5x more than a 10% compounder after 20 years. An 18% compounder is worth double a 14% compounder after 20 years. This partly explains why a world-class business might trade on what seems like an optically high trailing P/E ratio of 40x, while a somewhat inferior company in the same industry trades on a 20x multiple.
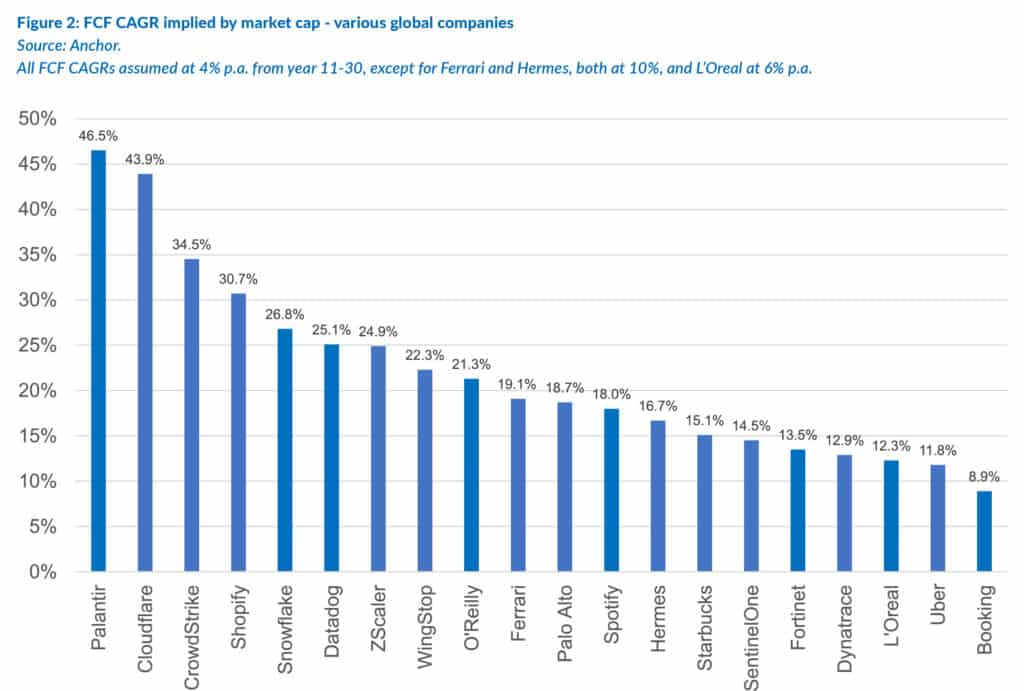
In Figure 2, we have worked out what compound annual growth rate (CAGR) is required from years 1 to 10, to get the future discounted FCF of each company to equal its current market capitalisation. We adjust for net cash/debt, and from years 11 to 30, we assume each company achieves a terminal CAGR of 4% p.a. The only exceptions are Ferrari and Hermes at 10% p.a. and L’Oreal at 6% p.a. This is to subjectively adjust for the very long history of delivering excellent returns that these companies have. The point with this exercise is not to rely on our own forecasts, but rather to create a picture of the 10-year FCF CAGRs that the market is assuming for each company. There are many thousands of listed companies in the world. Therefore, our sample size here is a somewhat random list of interesting companies that should be recognisable by most global investors.
So, what stands out to us in this sample of companies (Figure 2 below)? The first must be Palantir on the extreme left of the chart. It has been an amazing performer of late, with its stock price up by c. 400% over the past 12 months. The company has been at the forefront of the AI software market. It is very profitable and has been executed flawlessly. While generally topline momentum has slowed in the past couple of years for US software companies, Palantir has bucked this trend and accelerated its topline growth. All of this has seen the company enter the S&P 500 Index for the first time.
Notwithstanding all the above, it seems that Palantir has to compound its FCF at a rate of c. 46.5% p.a. for the next ten years to justify its current stock price. As we mentioned earlier, very few companies have compounded at over 30% p.a. in the long run (ignoring situations where the starting point was at a very depressed level). We cannot conclusively say that Palantir is a sell. However, our analysis suggests that its current market valuation is setting an extremely high bar that the company must deliver against over the next 10 years.
When a company has to deliver 40% to 50% p.a. FCF growth over the next 10 years (assuming a normalised starting base), that starts to feel like a valuation bubble. Companies discounting a FCF CAGR of 20%-30% p.a. look like “market darlings”. These are typically well-loved companies that are richly valued but not necessarily in a valuation bubble. This cohort includes stocks like CrowdStrike, Shopify, Datadog and Ferrari.
Companies discounting a 10%-20% FCF CAGR over the next 10 years is a range I feel very comfortable with. Many of these are good companies that have been set an achievable valuation bar by the market. I am typically happy to buy a company in this range if I really like its qualitative factors. These would be companies like Spotify, Palo Alto, Hermes and Fortinet on this chart. I am not suggesting they are all buys right now!
My approach is to do a lot of work on the quality of these companies and get my valuation comfort if the market is pricing them in this 10%-20% p.a. I prefer this to trying to nail the valuation down to a rigid, hard-and-fast number. The reality is that valuations are more art than science.
On the right-hand side of the chart are three companies that stand out as relatively cheap. These being Booking, Uber and L’Oreal. They are all discounting FCF CAGRs in the 9% to 12% p.a. range. Given the quality of these three companies, this looks like a very achievable bar. As always, all other qualitative factors must be weighed against these relatively cheap valuations.
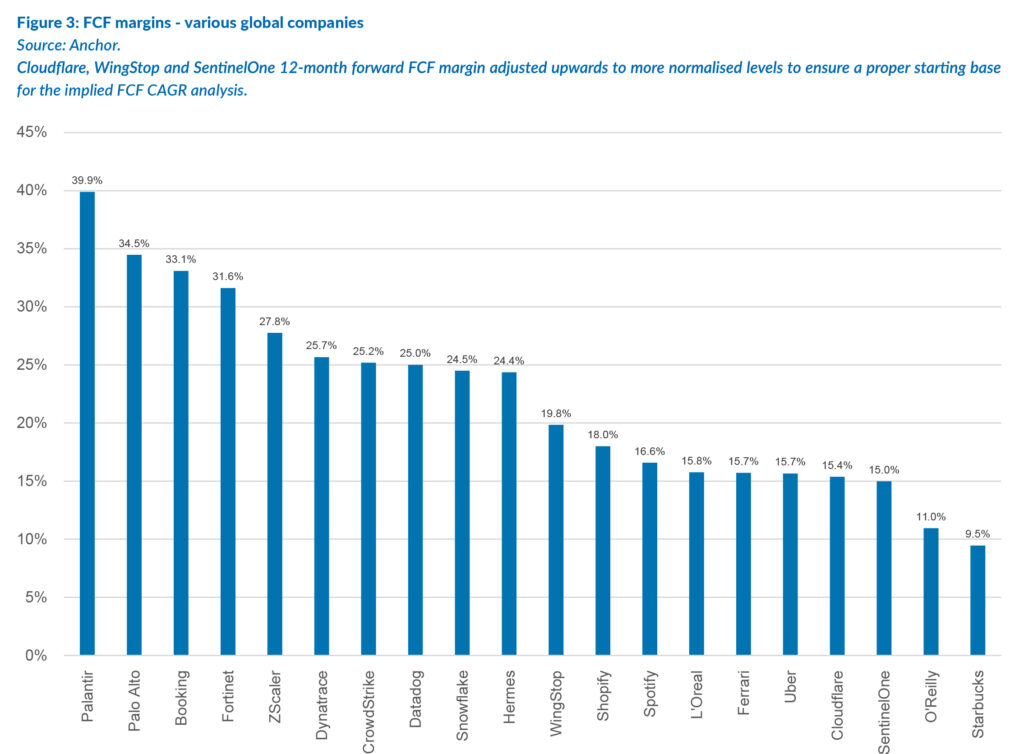
It is always good to read the implied FCF CAGRs against the actual FCF margins that the companies are currently achieving. If a company has a very low current FCF margin, it is potentially easier to grow that at a faster rate off that low base. However, quality companies would typically have higher FCF margins.
Palantir is interesting in that it already has a very high FCF margin of c. 40%. While that is a margin typically associated with a high-quality business, having to compound its FCF from that already high base level at c. 47% p.a. for the next decade is a very high bar set by its stock market valuation. So, the issue with Palantir is not the quality of its business, but rather the very high valuation bar set by the market.
Companies like Palo Alto, Booking and Fortinet stand out in this chart as being very high-quality companies based on their FCF margins of over 30%. The only material negative for Palo Alto vs the other two companies is its relatively high stock-based compensation that results in some equity dilution over time.
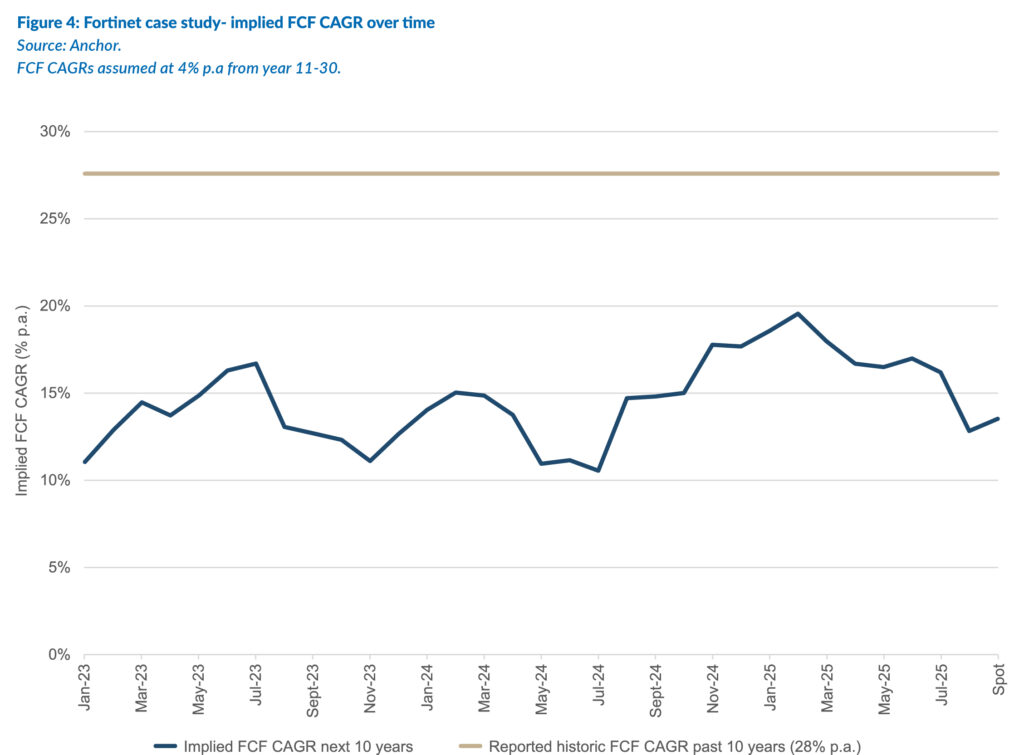
In the implied FCF CAGR chart earlier in this report, we showed that Fortinet (one of the world’s leading cybersecurity companies) is currently discounting a CAGR of 13.5% p.a. over the next decade. In the next chart, we track this implied FCF CAGR over time. At the peak of market optimism around Fortinet earlier this year, the share was discounting a FCF CAGR of c. 20%. At that point, it was nearly starting to enter the “market darling” camp. It has since fallen back on concerns about the durability of the current cybersecurity hardware restock cycle. At the recent trough, when the share sold off post its 2Q25 results, the implied FCF CAGR fell to 12.8%. The current implied FCF CAGR of 13.5% looks like a decent value, in our view.
It is worth noting that over the past 10 years, Fortinet grew its reported FCF at an actual CAGR of 28% p.a. Thus, the market is pricing in a material slowdown for the next 10 years. That is probably fair to some extent, given that Fortinet is a more mature company now.
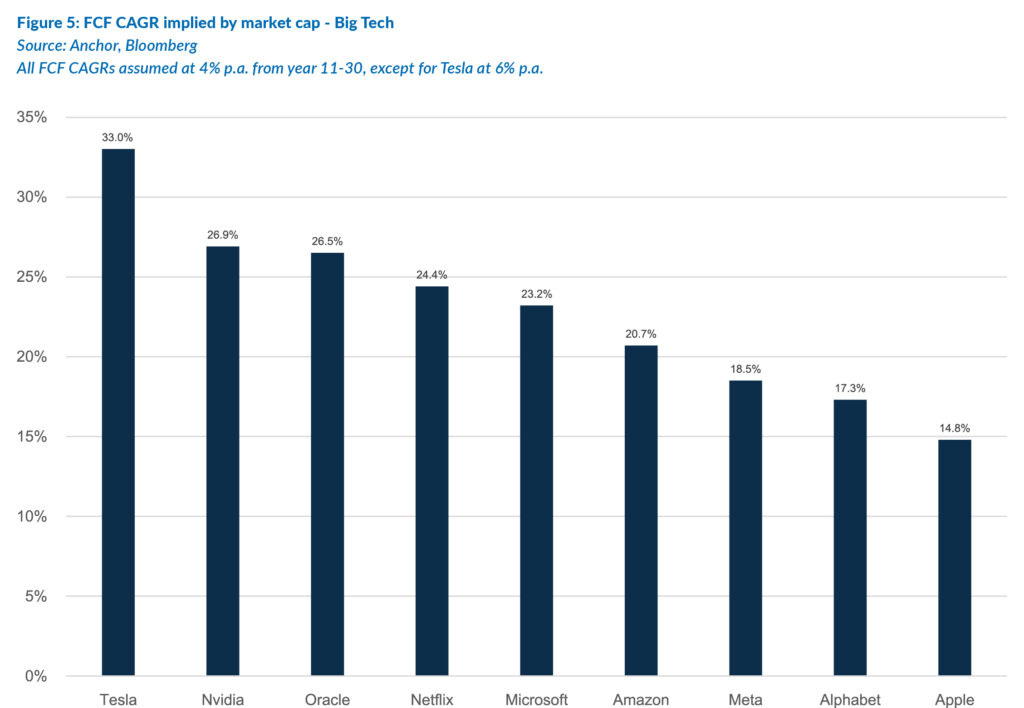
We have also done this implied value exercise for the US-listed Big Tech companies. We have included Oracle in this cohort, given its recent resurgence as a hyperscaler and AI play. Apple has been struggling to gain a credible AI thesis and has become the cheapest Big Tech stock by far, based on this methodology. A few months ago, Alphabet was also pricing in a very muted future as the market worried about the threat that OpenAI was posing to its core search business. However, as the market has become more comfortable that Alphabet has a credible AI pedigree, it has started to rerate closer to the other Big Tech companies. Its implied FCF CAGR of 17.3% is still far from expensive.
The other Big Tech stocks fit more into the “market darling” camp with implied FCF CAGRs of 20% to 30%. A looming issue is the massive capex that many of these companies are going to be spending on AI over the next few years. At least temporarily, their FCF margins could come under a lot of pressure and even turn negative for a couple of years (as in the case of Oracle). That might make our analysis more difficult to do accurately for a while. Tesla appears very expensive, although it does offer a lot more optionality to new revenue streams than the other companies.
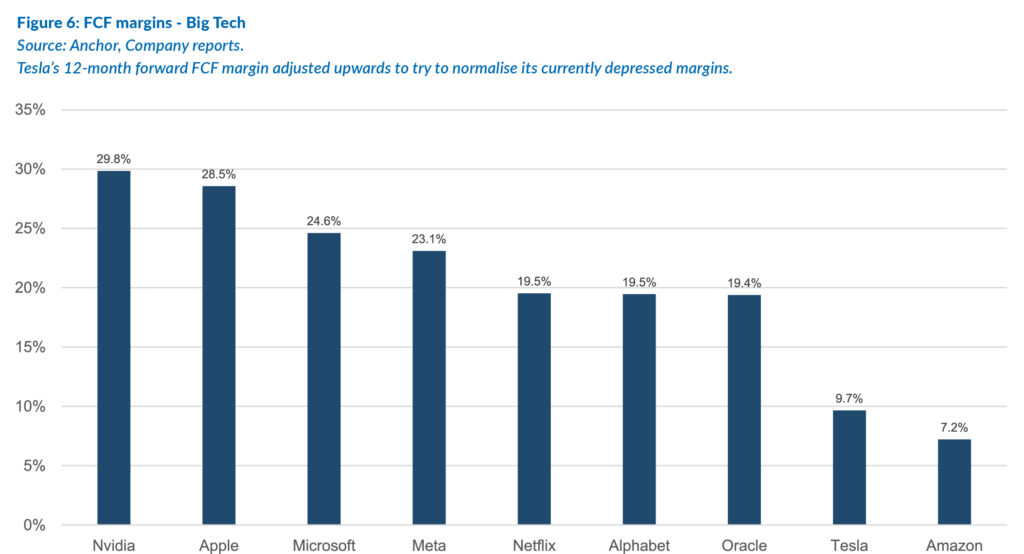
The current FCF margins of the Big Tech companies show they are mostly very profitable. However, as mentioned previously, this profitability is likely to come under pressure even if it is only temporarily.
Amazon’s profitability always appears low due to it including the gross merchandising value (GMV) of all the goods sold through its website in its own reported revenue. Most will agree that this is misleading as to the true profitability of the e-commerce part of its business.
Although Tesla’s share price is discounting a relatively high FCF CAGR of c. 33% p.a., the current FCF margin is low, so the base is easy to grow from. The Tesla investment thesis is complicated and sits in a “category of one”, in our view. We follow Tesla closely at Anchor, but our views are a discussion for another day.
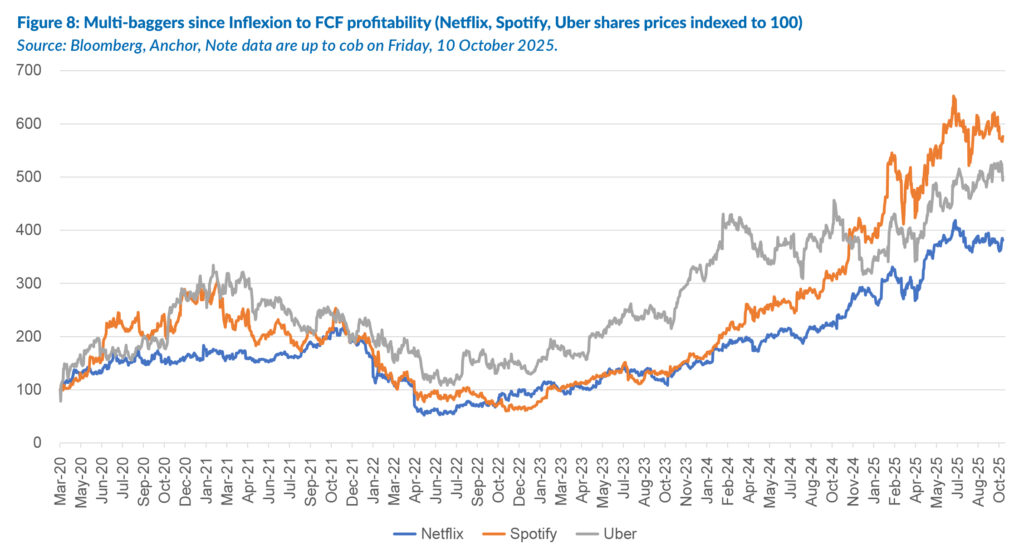
The inflexion to FCF profitability can be a material catalyst for a company’s share price. Netflix, Spotify and Uber have been excellent examples of this in recent years. Many growth companies purposefully plough their cash flow back into the business while they are in a hyper-growth phase on the revenue line. This can sometimes last for years. Eventually, they start to open the taps on FCF, at which point it grows exponentially.
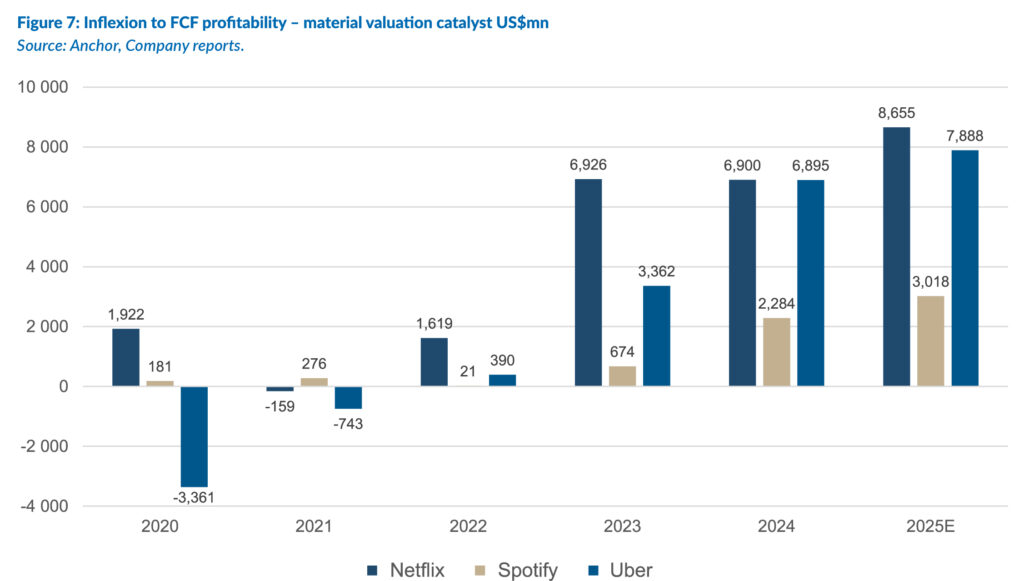
Investing in these three companies around the time of their inflexion to FCF profitability resulted in multi-bagger opportunities from about 2022.
Valuing listed companies is not a perfect science. Rather than pinning it down to an exact bottom-up value, inverting the analysis shows what the market is pricing in for the long term. It is a good test for valuation reasonableness. My thinking on stock valuations is that it does not have to be perfect – it just has to be good enough! If you hold a good stock successfully for 10 years, it is highly unlikely you will look back and say, “wow, did I nail this one with my spreadsheet 10 years ago?”. What you would have likely got right is your initial assessment of management and business quality. And then a small dose of good fortune never hurts either.