Summary
Much has changed over the course of May 2019, with UK Prime Minister Theresa May resigning and the South African (SA) national elections seeming to give President Cyril Ramaphosa enough of a mandate to calm the local market. However, with politics and trade war angst (once again) coming to the fore, changes in the global inflation outlook and the implication for interest rates has been getting relatively less attention. This past month, we have been looking at global inflation expectations, which seem to be on a downward trend, pulling interest rates and yield curves lower at the same time.
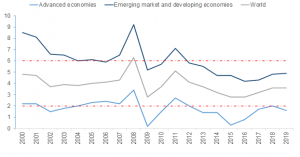
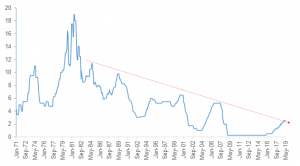
In this report, we highlight how inflation rates have been below targeted levels in both developed markets (DM) and emerging markets ([EMs], see Figure 1). This is even more evident if you look at US personal consumption expenditure (PCE) inflation (the US Federal Reserve’s [Fed’s] preferred measure) vs the Fed’s target level. In fact, since 2012 (the introduction date for the Fed’s 2% inflation target), inflation has, on average, been well below target. Consequently, interest rates have been trending lower for several years (Figure 4).
The inflation outlook remains benign
Global inflation remains at the lower end of target levels, particularly in DMs, where we see inflation trending significantly below target. Inflation expectations are also more biased towards the lower end of the target range in the G3 economies (US, EU and Japan). Historically, inflation expectations averaged 2.5%, but global markets have seen a drastic shift since 2013.
Figure 1: Global inflation
Source: Thomson Reuters
The asymmetric behaviour of inflation has cemented expectations of a move towards the lower end of the inflation target level. Although one of the challenges to inflation has been its lack of responsiveness to tightening labour markets, we anticipate that policy makers will continue with the rhetoric of tight labour markets, thus reducing their propensity to cut rates. Given the above view, we expect a more stable interest rate environment with an increasing probability of a hold-for-longer on global rates vs market expectations of an interest rate cut.
Meanwhile, inflation behaviour across the G3 economies has been supressed below or closer to the target range. In addition, using the Fed’s barometer for inflation (PCE), it is evident that inflation has been on the lower side of the inflation target.
Inflation-targeting mandate: Has it worked?
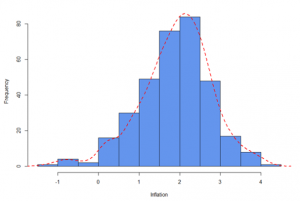
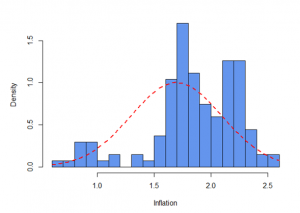
Looking at a long history of the Fed’s preferred measure of inflation targeting (PCE), it is easy to see why 2% inflation targeting has been a plausible choice. However, since adopting this 2% inflation target seven years ago (2012), the Fed has not achieved this convincingly. We note that inflation has been asymmetrically distributed around the 2% level, with inflation averaging significantly below 2%.
Figure 2: US PCE distribution over time
Source: Thomson Reuters
Figure 3: US core CPI distribution over time
Source: Thomson Reuters
Yields biased to trend lower rather than push upwards
A fear of runaway inflation has resulted in policy makers being biased towards hiking rates in order to curb inflation and thus the peak of each hiking cycle has been lower. Although the US has been able to break above the secular downward trend in rates, the bias towards a cutting cycle has forced yields to continue a downwards trend.
In both DMs and EMs, we have seen a dovish pivot on the expected trajectory of interest rates. In the US, the Fed turned quite dovish on the trajectory of future interest rates as the dot plot shifted lower.
Figure 4: The US Fed fund rate
Source: Thomson Reuters
The Philips curve paradox
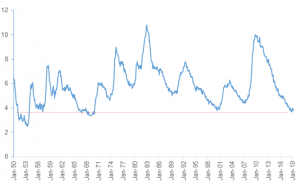
The Philips curve is the supposed inverse connection between the level of unemployment and the rate of inflation. In recent times, the challenge has been the lack of inflation responding to tight labour markets. We expect that policymakers will take the view of allowing the labour market to push inflation higher, rather than cut interest rates, given where rates are at currently.
Figure 5: US unemployment rate
Source: Thomson Reuters
Oil price effect remains muted
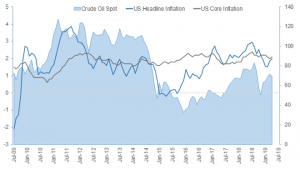
The impact of oil prices on US inflation has been muted and we expect this to continue in the short term. After recording robust gains in April, the oil price slumped c. 12% in May – its biggest monthly loss in around six months. This was once again due to the deepening US trade wars fanning fears of a global economic slowdown.
Figure 6: Effect of oil prices on US Inflation
Source: Thomson Reuters
Valuations
The US Dollar Index remains elevated
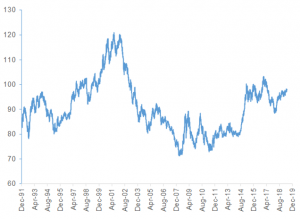
In terms of valuations, the US/ China trade war has seen the US Dollar Index remain at elevated levels, which has been one of the holdbacks for risky assets, particularly EM economies.
Figure 7: US Dollar Index
Source: Thomson Reuters
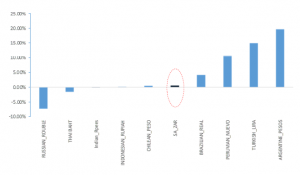
EM currencies have also been relatively flat YTD, but the rand has outperformed vs most other EM currencies (for the year to end May).
Figure 8: EM currencies performance, YTD
Source: Thomson Reuters
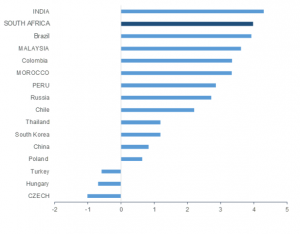
SA showing value on real yield basis
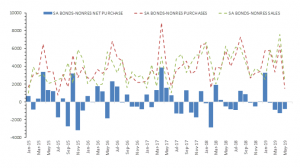
Real yields remain very attractive locally, which should be supportive of the local bond market. However, we also highlight that foreign flows have not been supportive over the past few months. While we have seen positive sentiment from SA fund managers, as they pushed a rally in the bond market, foreigners were net sellers of bonds during May.
Figure 9: SA vs Other EM real yields
Source: Thomson Reuters
Figure 10: Net purchases of SA bonds by foreigners:
Source: Thomson Reuters
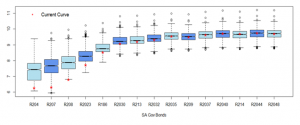
SA yield curve fair valuation
The SA yield curve continues to steepen as the short end becomes well bid, pricing in a possible rate cut by the SA Reserve Bank (SARB).
Figure 11: Bond yields summary statistics
Source: Thomson Reuters
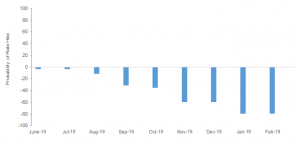
Probability of interest rate moves
According to the forward rate agreement (FRA) curve, the next move by the SARB’s monetary policy committee (MPC) will be to cut interest rates. At its most recent MPC meeting (held on 23 May), the SARB kept the repo rate unchanged at 6.75%, but transmitted a dovish tone on future rate moves, while citing receding inflation pressures. April headline CPI (released in May) came in at 4.4%, which is well within the SARB’s target range of between 3% and 6%. The SARB last hiked rates in November 2018 (by 25bpts, which took the rate to 6.75%). The MPC kept rates on hold following scheduled meetings in January and in late March 2019.
Meanwhile, in the US, the market not only removed future expected hikes but went all the way to pricing in interest rate cuts as inflation expectations dropped.
Figure 12: Probabilities of a rate hike at MPC meetings implied by 3-month FRAs
Source: Thomson Reuters
While local bonds are slightly expensive in comparison with their recent history, we believe that a dearth of inflation and the gradual dawn of a recovery in SA should keep our fixed income instruments well supported. In our view, US policy makers will likely remain focused on the tight US labour market and we expect a reluctance on their parts to cut rates. This, in turn, will create a positive environment for bonds, with SA bonds, in particular, looking very attractive on a real yield basis (see Figure 9 above).


