At KAP’s FY18 results presentation, management described a year to forget. The collapse of Steinhoff in December 2017 not only left the business without a corporate services function virtually overnight, but also naturally became a significant distraction for management as ill-founded concerns of potential contagion drew concern from shareholders, funders, suppliers and customers. Additionally, the primary equipment supplier for the group’s major expansion of the Hosaf polyethylene terephthalate (PET) plant (c. 11% of group operating profit in FY17) filed for bankruptcy mid-project, leading to cost overruns and delays that resulted in a 81% decline in operating profits from that division over the last year (equating to a 9% drag on group operating profits).
Despite what can absolutely be defined as extenuating circumstances, the group reported a commendable performance for FY18 – growing revenue by 16% YoY, operating profits by 14.7% YoY and HEPS by 9% YoY. This represents the seventh straight year of earnings growth from KAP after the injection of Steinhoff’s industrial assets in 2012.
Looking forward, we expect this rate of growth to increase materially into FY19 as the various expansion projects in the Diversified Industrial and Diversified Chemical segments are now complete and should drive both volume growth and operating margin expansion.
Importantly, the group’s balance sheet remains relatively flexible – with net debt: EBITDA at just 1.5x presenting management with significant optionality to effect a combination of acquisitive and organic expansion as, and when, opportunities arise.
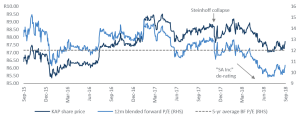
Despite the improved FY19 outlook, the share hasn’t been immune to weakening sentiment towards businesses geared to the SA economy. Additionally, the potential sale of Steinhoff’s 26% stake in the business has also likely weighed on the counter (see Figure 1). We believe these factors have created an opportunity for investors, with the current valuation of KAP Industrial Holdings undervaluing the growth prospects of the business and undervaluing its ability to convert profits into cash.
Figure 1: KAP share price vs 12m blended forward P/E
Source: Bloomberg
Diversified Chemical: Hosaf recovery will be meaningful
Following the integration of recently-acquired Safripol with Hosaf, the Diversified Chemical segment has now become the largest in the group – accounting for 38% of group operating profits (see Figure 2). Backing out the contribution from Hosaf and Woodchem for FY18, we estimate that Safripol grew operating profits at around 20% for the year – a positive indication that the integration has gone well.
Figure 2: FY18 operating profit contribution by segment

Source: KAP FY18 results
Although this segment demonstrated 38% in absolute operating profit growth for FY18, this was largely driven by the inclusion of Safripol for a full year (previously included for 6 months in FY17). The segment’s profitability was meaningfully offset by delays and cost overruns of the capacity upgrade at Hosaf, where the business was forced to import finished PET resin (its primary output) for resale to maintain customer relationships.
Of course, this meant foregoing most of the margin on the product – essentially destroying the business’ profits (Hosaf operating profits were down 81% YoY in FY18 – see Figure 3) and pulling the segment’s overall operating margin down from 12.3% in FY17 to 11.5% for FY18. As Hosaf operations return to normal in FY19, we expect the Diversified Chemical segment’s operating margin to recover meaningfully to 13.8% (see Figure 4).
Even before accounting for the volume growth resulting from the Hosaf plant expansion, a simple recovery in margins will represent a positive swing in group operating profits of c. R220m (+8.8% on FY18) or HEPS of around ZAc6 (+10% on FY18) – a significant driver of group earnings growth for FY19.
Figure 3: FY18 operating profit growth per segment

Source: KAP FY18 results presentation
Figure 4: Progression of operation margin by segment

Source: Anchor
Going forward, the Diversified Chemical segment is well-placed to grow as the local market for the collective product set remains underserved. Imports currently service the market’s supply deficit, and this remains a structural opportunity for Hosaf (see Figure 5). The now-complete expansion project has increased Hosaf’s capacity by 85%, and we expect this to be fully utilised quickly (within 18 months). To put the expansion into context, we estimate full utilisation could contribute up to R235m on operating profit – or 9.5% at group level based on FY’18 numbers.
It is also important to note that the Diversified Chemical segment’s revenues and input costs are US dollar-denominated. Given the average exchange rate realised over FY18 of R12.84/$1, the current weakness of the rand could well serve as a significant tailwind for this segment’s operating profit growth should it sustain throughout FY19.
Figure 5: Import replacement a structural opportunity

Source: KAP Industrial Holdings investor presentation
Diversified Industrial: Driving operating margin expansion
The Diversified Industrial segment posted yet another year of operating margin expansion to 16.2% (FY17: 14.8%), led by the timber and integrated bedding businesses.
Recent investments into PG Bison’s production capabilities and capacity have underpinned an active drive to shift this division’s sales mix in favour of more profitable “value-add” products (i.e. high-gloss and textured decorative panel products). The resultant margin expansion has become a significant driver of profit growth, with 7% revenue growth driving operating profit growth of 20%.
The integrated bedding business – still run by the energetic founding family – also benefitted from the investment in a state-of-the-art integrated bedding plant in central Johannesburg. Higher levels of vertical integration, improved efficiencies and positive operating leverage have resulted in 20% YoY operating profit growth on the back of just 12% YoY revenue growth for FY18 – a trend which we expect to continue in FY19.
Going into FY19, we expect the annualisation of the benefits of investments in this division to continue to drive operating margin expansion in this segment – albeit at a slower pace (see Figure 4). The automotive components division, which experienced flat revenues in FY18, also stands to benefit from any pickup in new car sales – although this is contingent on an improvement of the prevailing macroeconomic backdrop in SA.
Diversified Logistics: operating environment remains challenging
In contrast with the positive operational momentum in the other two segments, the Diversified Logistics segment’s operating margins have been impacted by competitive market conditions, a subdued operating environment and material cost push inflation.
Management are focusing on retaining the long-term contractual revenue base despite some resultant margin erosion, allowing the business to retain the critical mass that will be necessary to fully leverage a potential economic recovery. The recent BEE deal concluded within the contractual logistics divisions will also assist in customer retention efforts.
We do not expect this division to materially contribute to earnings growth over the medium term.
Balance sheet optionality
Management have guided to a year of consolidation in FY19, given the numerous expansionary projects undertaken in FY18 and the recent integration of Safripol and Hosaf. While we expect these initiatives to drive meaningful growth in FY19, there remains a material level of optionality in the balance sheet.
Assuming a leverage ceiling of 2.5x net debit : EBITDA (below management’s previously communicated maximum) and an average deal multiple of 8x, we have illustrated the potential impact on FY18 earnings were this capacity to be deployed (see Figure 6). The incremental impact on earnings is significant.
Despite the recent cost overruns in the Hosaf expansion project, we still back management to allocate capital effectively. The numerous expansion projects across the group have improved group returns over time, and Safripol is evidence of successful M&A execution.
Figure 6: Group balance sheet capacity over time

Source: Anchor
Temporary setbacks yielding an opportunity
Over time, KAP has enjoyed a rerating that has reflected its consistently improving return on equity profile (see Figure 7). We believe the recent dislocation between the share’s rating and improving RoE profile is a function of several shorter-term influencing factors, which include:
- Generally negative sentiment towards companies geared to the South African economy;
- The overhang of a potential sale of Steinhoff’s 26% stake in the company; and
- Temporary pressure on group operating margins due to the loss of Hosaf profitability in FY18
Naturally, this presents investors with an opportunity. We believe the KAP structural margin expansion story remains intact, with the group’s return on equity profile set to resume its rising trend from FY19. Earnings growth is also expected to accelerate meaningfully into FY19 as the Diversified Chemical segment’s profitability normalises and the benefits of the group’s various expansionary investments annualise.
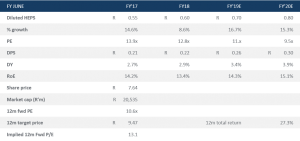
On a discounted cash flow (DCF) basis, we estimate that the share currently trades at a discount of 22% to its fair value – which we estimate to be R9.47/share. We expect the primary catalyst for a rerating to be the group’s 1H19 results, which should exhibit a return to operating margin expansion. Certainty around Steinhoff’s potential disposal of its 26% stake in the group, and improved sentiment towards the South African economy would also likely drive a positive rerating over the coming months.
We find the prospective total return of 25.6% over the next 12 months to be attractive on a relative and absolute basis, and hence we find this to be an attractive investment opportunity.
Figure 7: KAP’s 12m blended forward P/E vs ROE

Source: Bloomberg; Anchor
Figure 8: Forecasted metrics
Source: Anchor

