In this note, the Anchor investment team highlights a selection of global equities worth keeping an eye on in the year ahead. Keep in mind that these individual stock ideas may not necessarily be reflected in all client portfolios (as our portfolios have different mandates and risk-return profiles). However, we did try and find stocks that indicate how we pick our shares and that mirror our philosophy in this regard.
Global inflation has been at the core of this year’s market meltdown, driven by easy money and supply pressures from clogged supply chains and Russia’s war on Ukraine. We think US inflation could subside to 3% within a year, easing pressure on central banks to act in a restrictive manner. During the height of the volatility and market declines, it is important to remember that it is an economic cycle, and we are well past the halfway mark. It is also vital to remember that markets move long before economies turn – they look forward and price-in the aggregate view of the future. By the time the economy is on the up again, markets will have already run away.
So, the playbook sounds simple, but the shorter term is far more complex, and market participants and commentators are on edge trying to work out when rates will peak, how long rates will remain high, and how deep the economic impact will be. These are all factors that will determine the short-term trajectory of markets. As we enter 2023, it is widely expected that the first half of the year may still have some bumps in store for investors due to these uncertainties. However, it should be kept in mind that this bear market is already becoming quite extended by historical standards and, with each passing month, becomes more so. During bouts of intense selling pressure, all shares typically fall as investors’ urge to exit risk assets tends to make the individual investment cases of companies of limited importance. For those with the ability to move against the herd, this can be a wonderful opportunity to enhance one’s offshore portfolio. Below are some suggestions to keep an eye on.
Citi: Simplicity is good for returns.
We see Citi as a compelling “self-help” story, trading at a significant discount to other players in the market with potential material upside to the share price (although we note that there is some execution risk). This “self-help” story was laid out by CEO Jane Fraser and her executive team at Citi’s capital markets day in March 2022. By the end of 2022, Citi still appears to be on track with these plans, despite several disruptive macro events since early March 2022. Briefly looking at the history of Citi over time, at the end of 1999, Citi had one of the largest market values of all the US banks. However, the onset of the 2007/2008 global financial crisis had a significant negative impact on the bank. Since then, banks such as JP Morgan Chase, Bank of America, Wells Fargo, and Morgan Stanley have overtaken Citi (<$90bn in mid-December 2022) in terms of market value. Citi’s share price performance has also been unexciting over the past five years.
Although Citi was previously a leader in the banking sector, the bank has now largely fallen from the spotlight. Jane Fraser, the current CEO, has been working on simplifying the business and focusing on Citi’s five key strategic areas. The transformation at Citi will benefit the bank and its share price over the next few years. An improvement in the return on tangible common equity (ROTCE) is a key goal for Citi and will be a key metric to monitor going forward. Within its Institutional Client Group (ICG) segment, Citi aims to gain market share. They will build on the success of their Treasury and Trade Solutions business (TTS) which services some 5,000 multinationals around the world. This is a unique asset in the banking world. The current ROTCE for the ICG segment is 16.6%, which is solid and ahead of the returns in the other major segment at Citi (i.e., PBWM).
Citi has been adding staff to its Personal Banking and Wealth Management (PBWM) segment. A key intention here is to increase market share in Wealth Management. Although these moves will increase costs in PBWM in the short term, Citi has implemented this move as a necessary step to build up this segment over the long term and improve its current ROTCE figure of 6.8%.
The tangible book value per share is US$80.34, and the current share price is c. US$46. Citigroup is trading at about 0.57 of its tangible book value (TBV) and has the biggest discount to TBV of the large US banks. Its ROTCE was 8.2% for 3Q22, and we expect this to increase to c. 11%/12% over the next two years, highlighting that this is the primary investment case for Citigroup. By comparison, JP Morgan Chase generated a vastly higher ROTCE of 18% in 3Q22 and is trading at 1.9x TBV.
In 3Q22, TTS revenue was up 40% YoY, driven by 61% YoY growth in net interest income. The wealth management segment is an area of prospective future growth for Citigroup. In 3Q22, client advisors increased 5% YoY; as noted earlier, this is an area it is looking to expand. Citigroup is simplifying its business worldwide by exiting many of its retail banking operations. Once it has exited the various countries (such as Mexico, China, Russia, and India), it will only remain in retail banking in the US. Citigroup’s ex-US strategy is to provide support for corporate multinationals around the world. This will help to lower its cost base and increase ROTCE.
In FY22, management expects low single-digit growth in total revenue (excluding the impact of divestitures). We expect expense growth to start slowing into the second half of next year, which should reflect positively in the share price. As the ROTCE improves over the next 24 months, we expect the share price to increase above the tangible book value. We view Citigroup as the cheapest of the big US banks. Citigroup is trading on a P/E of 6x to December 2022, and we have a price target of US$129, with an upside of 184% on a two-year view.
Constellation Software: An attractive investment opportunity
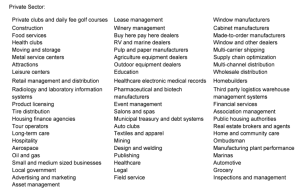
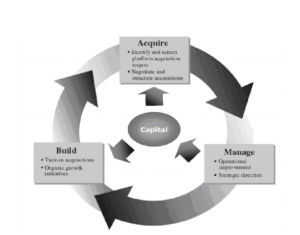
Constellation Software (CSU) is an acquirer of vertical market software (VMS) businesses. VMS businesses usually provide mission-critical software for customers in their particular segment. Constellation aims to be a perpetual owner of VMS businesses. It seeks to purchase, manage, and operate these businesses over time. Constellation focuses on this sector because it offers the opportunity to own asset-light operations with competitive moats. Constellation’s VMS businesses are in industries ranging from healthcare to marine asset management to parking to food services. Constellation typically focuses on private software businesses but has invested in public companies. For example, over the 1995 to 2011 period, it made sixteen public company investments (all in the software industry).
Figure 1: Public and private sector software markets for CSU businesses

Source: Constellation Software 2019 annual report
Constellation is a Canadian-domiciled business with headquarters in Toronto. The geographic split of its revenue, however, is more global. Canada contributed only 11% of revenue in 2021. The US and Europe accounted for 40% and 38%, respectively.
Figure 2: CSU revenue contribution by geography

Source: Company reports, Anchor Capital
Importantly, Constellation does not issue shares or overleverage its balance sheet to finance its acquisitions. Instead, acquisitions have been funded by the free cash flow generated by Constellation’s businesses. Since its initial public offering in 2006, Constellation has never issued any shares, keeping its share count flat. On 30 September 2022, its net debt balance could be completely paid off with a year of free cash flow (i.e., net debt to free cash flow is just below 1x).
Figure 3: CSU shares outstanding (mn)

Source: Company reports, Anchor Capital
The CEO, Mark Leonard, has been in that position since founding the business in 1995. He is long-term oriented and shareholder-friendly (interestingly, one of the reasons that Constellation does not repurchase its shares is that management feels such a practice exploits departing shareholders who naturally will have less information than the company).
Competition to acquire software businesses is intense, of course. In addition to larger software companies looking to take out smaller operators, Constellation competes with software-focused private equity firms like Vista Equity Partners and Thoma Bravo. There are also a plethora of more generalist private equity companies with sizeable asset bases and good track records within software.
The company’s acquisition-driven model has allowed it to grow revenue at a 21% compound annual growth rate (CAGR) over the past ten years. Over that same period, free cash flow margins have improved, rising from 17% in 2011 to 25% in 2021. Free cash flow per share has grown 26% p.a. over that same period. Constellation does pay a dividend, but it is small. The 2021 dividend equated to 27% of earnings and 5% free cash flow. Most free cash flow is retained for future acquisitions. Over the past five years, 63% of free cash flow has gone towards acquisitions. Of course, the business now operates off a much larger base than it did ten years ago. Revenue, for example, was only US$773mn in 2011 but stood at US$5.1bn in 2021. The larger base will make growth harder to achieve.
Figure 4: CSU’s model – acquire, manage and build
Source: Constellation Software 2013 annual report
Equity valuations have moderated over the past two years. This is particularly true in the software industry. That valuation backdrop should be supportive of Constellation’s strategy. That may be evident in the increased scale of Constellation’s investment. Before 2021, CSU had never spent much more than US$500mn in any given year on acquisitions. That changed in 2021 when it spent over US$1.2bn. In the first nine months of 2022, Constellation has spent just over US$1.3bn on acquisitions. Given the decline in software business valuations, the step-up in investment from the company is encouraging. At 25x free cash flow per share, with the potential to compound free cash flow per share at a mid-teens rate over time, we believe Constellation is an attractive investment.
Fortinet: Exceptionally well-run company with a significant focus on shareholder returns
Fortinet is the second largest independent, pure-play cybersecurity company when ranked by revenue. It was founded in 2000 by brothers Ken and Michael Xie, who run the company to this day. It is based in California, US and was listed in 2009. Its current market capitalisation is US$41bn.
Cybersecurity is considered the most defensive part of the global tech sector. Given the dramatic increase in cyber hacks and ransomware, corporate cybersecurity spending is not an option but a necessity. Purchases of the latest cyber protection can be delayed, but only for a short while. The shift to the cloud is the other key secular theme in global tech. In many respects, this cloud theme overlaps with the cybersecurity theme. The move to the cloud has dramatically raised the attack surface that has to be protected. This has spawned a whole new wave of cloud-native cybersecurity solutions. Rising global geopolitical tensions have also heightened the risk of cyber warfare.
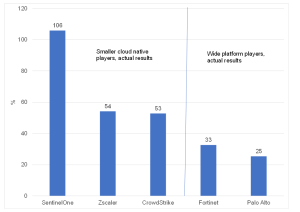
Estimates of the annual cost of cybercrime range between US$1trn and US$6trn. An IBM study showed compromised credentials as the biggest cause of cyber breaches. The same study showed that the average cost of a data breach had risen to US$4.2mn in 2021. Five key listed cybersecurity companies have continued to report strong revenue growth in the most recent quarter (3Q22).
Figure 5: Cybersecurity reported revenue growth in 3Q22, US$ YoY % change
Source: Company reports, Anchor Capital
Revenue growth beating consensus expectations remained a key characteristic of the cybersecurity sector in the most recent quarter.
Figure 6: Cybersecurity revenue growth beat vs consensus in 3Q22

Source: Company reports, Anchor Capital
The vendor offerings in cybersecurity are diverse, with many large corporates using 40 to 60 vendors for their cybersecurity needs. This has made protection complex and costly, with a wide range of solutions that do not always talk properly to each other. One key theme that has been developing in cybersecurity is the consolidation of these solutions down to fewer, wide platform vendors.
Fortinet arguably has the most comprehensive platform of cybersecurity solutions in the world. This makes Fortinet a one-stop shop for corporates. Fortinet is considered best-in-class in several areas of cybersecurity, such as firewalls, SD-WAN and OT security. This is all brought together by its proprietary single operating system called FortiOS. The issue with a comprehensive platform is that if a vendor is best-in-class in several areas, it does not have to be the absolute best in its other offerings. These just have to be good enough. Small, point solution vendors have no choice but to be the absolute best in what they do.
Figure 7: Fortinet material gainer in firewall market share

Source: Fortinet
Fortinet is an exceptionally well-run company with a significant focus on shareholder returns. It has low equity dilution from stock-based compensation compared to most other tech companies. It is in a net cash position and uses most of its free cash flow to buy back its shares. As such, it has reduced its shares in issue by about 10% over the past five years. Also, Fortinet has a proud record of internal innovation rather than conducting multiple smaller bolt-on acquisitions to gain leadership in cybersecurity.
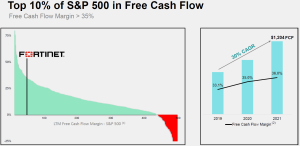
Fortinet’s free cash flow margins of c. 35% are extremely high and put it within the top 10% of all the companies listed in the S&P 500 Index on this measure.
Figure 8: Fortinet free cash flow margins are world-class
Source: Fortinet
(1) Source: Nasdaq IR Insight and company filings. Data based on most recently reported financials as of 4 May 2022. Free cash flow for the period shown is calculated as operating cash flow minus capital expenditures.
(2) Free cash flow is a non-GAAP financial measure.
Companies like Fortinet seldom go on sale from a valuation perspective. We can hardly make a case for Fortinet being a value stock. However, it has an excellent track record of delivery. Fortinet has several best-in-class products in the cybersecurity industry. This is an industry with strong secular tailwinds.
We would point out that very few sectors are unlikely to be negatively affected by the macro headwinds brewing in 2023. Even the cybersecurity industry is likely to see revenue growth rates slow in 2023 from the very high rates achieved in recent years. However, this sector should still be relatively attractive in a world more starved of growth options. Fortinet is on an EV/12-month forward sales multiple of 7.7x. This is significantly lower than the 20x-80x multiples that the US high-growth tech companies traded on during the 2020-2021 valuation bubble.
Fortinet is currently on a one-year forward P/E of 37x. While this is high, it is not uncommon for US growth tech stocks to sustain these multiples. The Fortinet share price is about 30% below its all-time high. This decline and strong historical earnings growth have brought the one-year forward P/E down from about 70x to 37x.
L’Oréal: A world-class business of enduring quality
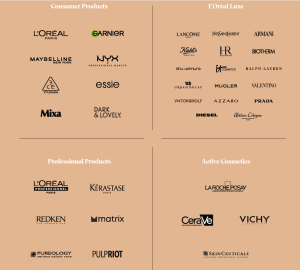
L’Oréal is the world’s premier beauty company with a c. 13% global market share. L’Oréal is a family-controlled (fourth generation) business with c. 35% family ownership. Nestlé has owned a strategic stake in the business since the 1970s to ward off nationalisation/state takeover threats in France. Its current stake is 20%. The current CEO (Nicolas Hieronimus) is only the sixth CEO in L’Oréal’s history. The company has been in existence for about 113 years.
L’Oréal has a rich history of research innovation and strong brands. It carries very low single-product risk. Although its headquarters are in France, its sales are spread worldwide in 150-plus countries with c. 35 brands. It sells about 7bn products, p.a.
Figure 9: L’Oréal split into four divisions in 2004, with 35 brands
Source: L’Oréal
L’Oreal achieves about 18% of its sales in China. Although it has not been as badly affected by China’s strict COVID-19 lockdowns as some of its competitors, it nevertheless stands to benefit from the eventual reopening of the Chinese economy.
Figure 10: L’Oréal sales by geographic region

Source: L’Oréal
(1) South Asia Pacific, Middle East, North Africa, Sub-Saharan Africa.
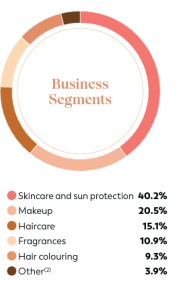
L’Oréal has a diverse product mix, with make-up typically its most cyclical category.
Figure 11: L’Oréal sales product mix
Source: L’Oréal
(2) “Other” includes hygiene products and sales by American professional distributors with non-Group brands.
Although not totally immune to the macro headwinds looming in 2023, L’Oréal’s beauty business is relatively defensive. Furthermore, L’Oréal’s global leadership in its industry has meant that its sales have grown at 1.5x the global beauty market over the past 20 years. L’Oréal’s digital-first and leadership in Beauty Tech have made it resilient in 2021 and 2022. About 25% of its sales are achieved through e-commerce channels, the highest of any major beauty company worldwide.
L’Oréal’s current market capitalisation is c. US$200bn. The share price has declined by 21% in US dollar terms, YTD (to 9 December 2022). It is on a one-year forward P/E of 31x. Although this is not cheap, it represents a material derating from the c. 60x trailing P/E it peaked in 2021. It is on a forward dividend yield of 1.8%. L’Oréal’s euro dividends have grown at a CAGR of 13.3% p.a. over the past 24 years. It has averaged a return on capital employed (ROCE) of 17% over the past decade. This is a world-class business of enduring quality.
Mercado Libre: Commanding a front seat at the table for investors over the next year
Latin American (LATAM) e-commerce player Mercado Libre (Meli; Bloomberg code MELI US) has been a core holding in our emerging markets (EMs) portfolios since their inception over four years ago. The share has produced some stellar returns that peaked along with many other high-growth names during 2021. As with many of our core EM holdings, we have had to set very long-term investment horizons when assessing the appropriateness of each investment, which helps to remove the distraction of focussing on the volatility of short-term price swings. As the last few years have shown us, macro and geopolitical forces have had outsized influences on share price performance – so much so that one could be forgiven for drawing some fundamental inference from the wild gyrations in these stocks. It is, therefore, always a good exercise to take a step back and assess where the business finds itself in its current business cycle and how that compares to what we were expecting when we made the initial investment all those years ago. Our conclusion is that Meli deserves a spot on our list of stocks to own over the next 12 months.
Meli is a pan-LATAM e-commerce business, with its origins in Argentina and its biggest market being Brazil. The company was started in 1999 by Argentinian-born Stanford graduate Marcos Galperin. What began as a marketplace business (similar to eBay) has now evolved into direct e-commerce (Amazon), payments, and lending. When we first started looking at Meli in 2017, we were very impressed with how the business had evolved over the years. However, our chief concern was the threat businesses like Amazon would ultimately pose to a smaller player like Meli. Over the years, we have been surprised by Meli’s operational excellence and the resulting moat its eco-system presents in the Group’s given markets. As a result, the higher-level fears have so far been dispelled. Even with the emergence of the more aggressive ‘Shopee’ offering from Asian competitor SEA Limited, it appears that Meli has been able to maintain its market position and, ultimately, come out even stronger. This is a great test of a business model and management – which we always fear could become complacent in such a dominant market position.
Operationally, we expect more of the same from Meli over the next 12 months. When we first looked at the business, it was doing US$1.2bn in revenue, with marginal operating profits, while still investing heavily in increasing capacity and adding new pillars of growth such as payments and lending. Fast forward to 2022, and the business is expected to record nearly US$11bn in revenue and an operating margin of 11.5%, proving that its business model is more than just customer acquisition and marginal profitability.
Figure 12: Meli revenue and profitability, US$mn unless otherwise indicated

Source: Bloomberg, Company filings, Anchor Capital
While the COVID-19 pandemic most likely sped up the adoption of e-commerce globally, with Meli no doubt a beneficiary of this, we have also seen front-loading of revenue for many businesses globally. This has resulted in fairly loose capital allocation from management teams who thought they would be given the benefit of the doubt no matter the short-term profitability impacts. Thankfully, the team at Meli did an excellent job of balancing reinvestment and profitability with no significant deviation from previously stated CAPEX plans and, as a result, a less punitive outcome for shareholders.
From an operational perspective, we are satisfied shareholders of Meli, although the ride has been somewhat volatile over the last few years. We can only hypothesise what caused the large spikes in valuations of many e-commerce businesses during the pandemic, but near the top of the list would be a very low-interest rate environment increasing the terminal valuation for companies with high medium-term growth prospects.
Figure 13: Meli share price, US$

Source: Bloomberg, Anchor Capital
What we experienced from a valuation perspective and subsequently saw unwind soon after is what long-term investors would regard as added noise. We never incorporated central bank policy and ultra-low interest rates into our thinking on why we found Meli an attractive long-term compounder. The last few years have tested our resolve on this long-term mentality. Huge swings in the share price on the way up (no doubt reducing the attractiveness of long-term returns) and on the way down (the current down leg is a clear overshoot, in our view) have called into question the appropriateness of certain investments in long-term, quality-biased mandates.
While that might be the case in companies that have also experienced breaks to the investment case via a change in the direction of the company, or thesis creep, where investors continuously have to pivot their thinking into why they hold the investment, the outcome thus far at Meli has been ahead of our expectations. We feel more confident about the future outlook for its operations. And as a result, Meli commands a front seat at the table for investors over the next year (and hopefully many years after that).
Shopify: Long-term sustainable growth
Shopify is an e-commerce business that enables merchants to sell their products online by acting as both an online platform and a fulfilment company. Its goal is to offer merchants an all-in-one service, including website construction, capital raising, payments, invoicing, fulfilment, advertising, analytics, etc. The company’s business model is to hook merchants with a cheap monthly subscription and then ratchet on more services and offerings for an extra fee as the merchant becomes more successful. Hence the company is well aligned with its customers’ success. Shopify’s e-commerce platform currently holds a 32% market share in the US. It has over 2mn merchants, 55% in the US, with 65% of its revenue being generated in the US. Thus, Shopify is well-diversified internationally, and its US concentration continues to decrease over time.
Figure 14: Shopify business model

Source: Shopify
Shopify undoubtedly did exceptionally well during the pandemic. Although it has experienced a slowdown in gross merchandise value (GMV) traded through its online business, as consumers return to brick-and-mortar shopping, it has still managed to grow its overall revenue by over 20% this year. It has done this by offering superior offline services such as point-of-sale (POS) devices for physical stores. This technology helps retailers with their inventory management in addition to facilitating payments. This is nothing revolutionary, but the offering is simply an easy-to-use service that works seamlessly offline and online, further empowering merchants who seek exposure across multiple channels.
Figure 15: Shopify POS device

Source: Shopify
Lately, Shopify has been focussing on integrating social media with e-commerce. It recently showcased the seamless interactions between YouTube and its online store. A consumer watching a live stream of their favourite influencer on YouTube can interact with the video and almost immediately purchase directly from the store on Shopify. And on top of this, Shopify now offers a two-day delivery service for much of the US, further improving the customer experience.
By purchasing the logistics platform Deliverr earlier this year, Shopify’s business model has morphed from an asset-light platform business to an e-commerce fulfilment giant. This purchase has made it somewhat difficult to analyse whilst it undergoes the transition from an asset-light, highly scalable, low debt levels, high margins and high cash flows business into something that, on paper, looks less attractive. Shopify previously focused on the software and services side of e-commerce and left the merchants to deliver goods using various third-party logistics companies. Now it has brought that service in-house, allowing for increased control and better performance but at the cost of moving away from this cleaner and highly profitable business. Shopify management was forced to make these sweeping changes in its business model to remain competitive with Amazon and its similar offering called Marketplace. This is because Amazon has been offering more Shopify-like services to its Marketplace merchants, and thus, Shopify has had to move into logistics to meet them head-on in the middle. Although we foresee increased competition going forward, we believe that Shopify has a large enough market share to remain competitive and share the e-commerce space with Amazon over the coming years. While it will no longer be as asset-light, it will make its moat even greater, further blocking any new incumbents.
Figure 16: Shopify revenue growth and capital employed, US$mn unless otherwise indicated

Source: Bloomberg, Anchor Capital
Despite a slowdown in revenue growth post-COVID-19, Shopify’s revenue generation from the capital it employs has improved during 2022.
Shopify recently published a record-breaking Black Friday weekend, with global sales from its independent businesses reaching US$7.5bn. That is a 19% YoY increase from the US$6.3bn recorded in 2021. More than 52mn consumers purchased from brands powered by Shopify, which was an 18% YoY increase. It also wrote that consumers approached the holiday with intentionality, seeking out good deals from their favourite brands. These data show a stronger-than-expected global consumer in the face of increased fear of a recession, but this can quickly reverse if we see a deterioration in employment over the coming quarters as a result of the US Federal Reserve (Fed) having to increase interest rates more aggressively than expected.
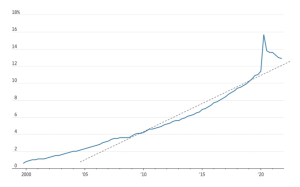
Figure 17: Ecommerce growth normalising as a percentage of retail sales
Source: The Wall Street Journal, 16 April 2022; US Census Bureau
Despite COVID-19 disruptions over the past three years, we expect the e-commerce percentage of overall sales to normalise and continue to grow in line with its long-term trend over the coming years. The heightened spending during the pandemic resulted in Shopify doing exceptionally well in FY20 and FY21, and it is now lapping a very high base. We expect revenue growth to be depressed for the next year as disposable income comes under pressure from inflation and recession impacts. Still, we believe it is well positioned to take advantage of long-term e-commerce adoption as the world stabilises over the coming years.
The Shopify share price has been a rollercoaster ride over the last few years, from shooting up to extreme valuations when global bonds fell to zero and investors flocked to COVID-19 beneficiaries and then collapsing by 80% over the past two years. You would think the stock would be cheap after such an enormous fall, but the price collapse has only brought the valuation back to fair territory. It is simply a testimony to how expensive these mid-cap growth businesses became (see the blue line in Figure 18 below).
Figure 18: Shopify share price and EV/sales over time, US$

Source: Bloomberg, Anchor Capital
The company is not currently earnings positive; hence, we cannot look at earnings multiples. However, if we examine its ratio of enterprise value (EV; overall company value) to its sales, we can determine that we are trading at close to all-time low valuation levels. However, we are cognisant that since the business has morphed into a somewhat asset-hungry e-commerce fulfilment company, valuations seen in the past are no longer strictly comparable, and it will likely take longer for the business to become profitable than previously estimated. Nevertheless, revenue is still growing at over 20% p.a. in a tougher environment, and we believe the company is making the correct capital investment decisions to remain competitive and allow for long-term sustainable growth.
At Anchor, our clients come first. Our dedicated Anchor team of investment professionals are experts in devising investment strategies and generating financial wealth for our clients by offering a broad range of local and global investment solutions and structures to build your financial portfolio. These investment solutions also include asset management, access to hedge funds, personal share portfolios, unit trusts, and pension fund products. In addition, our skillset provides our clients with access to various local and global investment solutions. Please provide your contact details here, and one of our trusted financial advisors will contact you.


