Summary
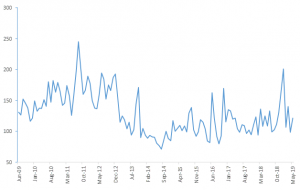
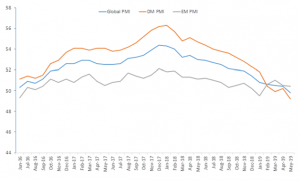
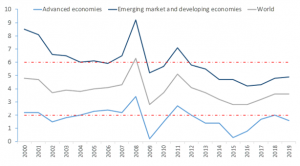
The theme for 1H19 has been slowing global economic growth for several reasons. Purchasing Manager’s Index (PMI) data, which measures the direction of economic trends in the manufacturing and services sectors across the globe, have continued on a downward trajectory, weighing heavily on emerging markets (EMs) as economic growth continues to trend downward. We attribute some of the slowdown to policy shocks, with the US and the UK doing their bit to spike the Economic Policy Uncertainty Index (Figure 1) earlier this year. The slower economic growth has also dampened inflation for most regions (Figure 5) and policy makers have begun to shift towards more dovish stances with major central banks suggesting they were ready to provide support in the form of lower rates. We have seen this policy shift towards more monetary policy accommodation in the US, Europe, China and South Africa (SA). These moves toward a cutting cycle should provide some support on growth.
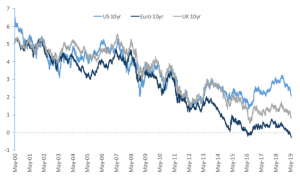
Bond yields have been lower as markets begin to price in rate cuts (Figure 4). We note that lower rates are supportive for commodities and EMs, although all eyes remain on China (Figure 8). We believe that a recession will be averted, and a continuation of the gradual economic expansion is the more likely outcome.
EM fixed income continues to be attractive, with SA bonds relatively cheap (Figure 11). The shift towards a dovish environment has been swifter than we had anticipated, and we have reduced our yield expectations going forward as set out in The Navigator – Anchor’s Strategy and Asset Allocation 3Q19. SA bonds are also pricing in a rate cut.
Global uncertainty easing
The uncertainty index has eased back to normal levels following a major spike in 1Q19. This was particularly so post the G20 summit, from where it appeared that the US/China trade war might be closer to a resolution than we had previously thought. This should provide some certainty on global trade and policy.
Figure 1: Economic Policy Uncertainty Index
Source: Thomson Reuters
Growth still trending lower
Figure 2: Global Manufacturing PMI
Source: Thomson Reuters
Although the Economic Policy Uncertainty Index has been improving, global growth and production remains lacklustre.
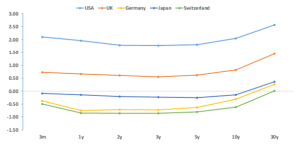
Yield curves in developed market (DM) economies remain flat
Figure 3: Nominal yield curves of various advanced economies
Source: Thomson Reuters
Yield curves across DMs remain flat as fears of low growth and possibly a recession continue to weigh on market participants.
Markets are expecting interest rate accommodation going forward
It is difficult to say that a new downward trend has resumed in yields as a soft landing/ no recession environment could see yields recover quickly.
Figure 4: Global interest rates
Source: Thomson Reuters
The inflation outlook remains benign
Figure 5: Global inflation
Source: Thomson Reuters
Low inflation should help avoid stagflation globally. Although low inflation is a challenge for central bankers, we view this as a positive occurrence in avoiding a stagflation scenario especially given the low-growth environment that we are experiencing. Moreover, should upside risks for inflation remain muted, we expect that this will provide leeway for growth to be reignited without the risk of a global recession.
Furthermore, low inflation should provide time for growth to reset and recover. This outcome will be supported by a declining Uncertainty Index.
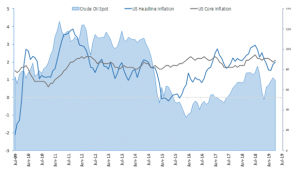
Oil price effect continues to be muted
A suppressed oil price should also help keep inflation anchored at lower levels.
Figure 6: Effect of oil prices on US inflation
Source: Thomson Reuters
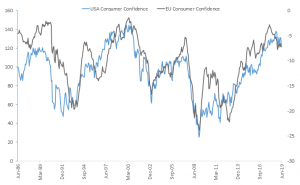
Consumers remain optimistic
Figure 7: Consumer Confidence Indicators
Source: Thomson Reuters
Although there has been a slight fall in global consumer confidence levels, these nevertheless remain optimistic with the trend continuing to be upward.
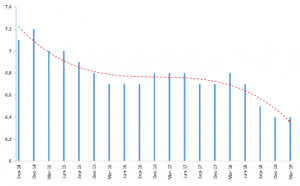
China – the elephant in the room
Perhaps the biggest threat to global growth currently is the slowdown in China. June manufacturing PMI fell to levels below 50 (the level which separates expansion from contraction) suggesting a contracting economy.
Figure 8: China GDP YoY
Source: Thomson Reuters
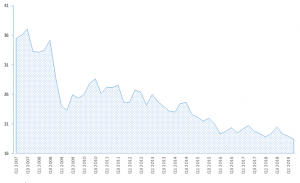
Figure 9: China exports (as % of GDP)
Source: Thomson Reuters
Business confidence in China also fell to a seven-year low in June 2019, while exports have been muted for the past three years. We note that perhaps a slight change may occur as the trade-war talks get closer to a resolution.
Valuations
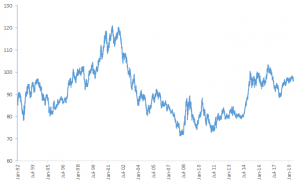
The US Dollar Index remains elevated
The US/China trade war has seen the US Dollar Index remain at elevated levels. However, the temporary trade war truce agreed upon at the G20 summit has seen the US dollar come down, while most EM currencies have gained c. 2%.
Figure 10: US Dollar Index
Source: Thomson Reuters
EMs continue to show value
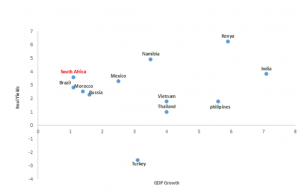
We highlight that most EM economies continue to have attractive real yields, although growth remains a challenge.
Figure 11: Growth vs real yields
Source: Thomson Reuters
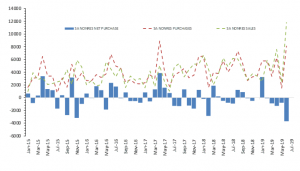
However, foreign flows have not been supportive for SA.
Figure 12: Net purchases of SA bonds by foreigners
Source: Thomson Reuters
As global uncertainty clears, EMs have gained support, particularly on currency and fixed income. We have also seen positive sentiment from SA fund managers as they pushed a rally in the local bond market, while foreigners were net sellers. However, given our view on global growth, inflation and the impact thereof on SA fixed income, we continue to view SA bonds as expensive, while our fair yield has been revised downwards to 8.30%.
SA yield curve fair valuation
The yield curve continues to steepen as the short end becomes well bid in anticipation of domestic interest rate cuts.
Figure 13: Bond yields summary statistics

Source: Thomson Reuters

