A case for lower-volatility hedge funds
A sure way to get me excited is to give me a good novel to read – if the author happens to be Jeffrey Archer then so much broader the smile. Recently, I read his latest, Heads You Win and, as with all his books, the premise is very thought provoking. The protagonist has to flee Russia by making an instant decision on which of two ships to board – one heading to the UK or the other going to the US. To decide the protagonist flips a coin and the story follows his life in two alternate realities, highlighting how great an impact that one moment of chance had on his life.
By now you might be wondering why there is a book review in the Anchor Strategy report. Well, there is indeed method to the madness. The book started me thinking about how frequently chance impacts our lives and, more relevant to this discussion, how often it impacts our financial wealth.
There are many fronts where chance has a significant impact on financial markets, but in this piece, I would like to focus on time. By time I mean the random chance that affects all of us i.e. when we start saving and when we need to withdraw our savings. I will investigate how significantly this random piece of luck affects the savings amount of many investors. I will also highlight how available investment information often neglects to accentuate how severely an investor will be impacted by these chance events and why investors must pay much closer attention to the volatility of a product’s returns.
The problem with performance data
I am a statistician. Numbers get me excited as they allow you to do many wonderful things, but numbers are also dangerous. When numbers are used incorrectly and not considered in the right context, the solutions offered by these numbers can be misleading and cause great harm. Quite often those providing the numbers and solutions are not intending to mislead, in fact they might provide all the information an investor will require, but by focussing on the wrong information investors, and their advisors, may come to an erroneous conclusion.
A key performance metric that can lead to some very dangerous allocation decisions is the return metrics of a fund. Often, fund factsheets highlight the performance of a fund over various periods, usually one-year, three-years, five-years and since inception. These returns are important in evaluating whether a fund manager is worth his/her salt but, taken out of context, they are also very dangerous.
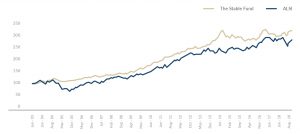
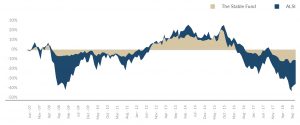
Figure 1: Performance summary of the Stable Fund and the ALSI since inception (June 2003)
Source: Bloomberg, Maitland Fund Services (Pty) Ltd
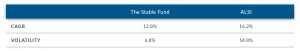
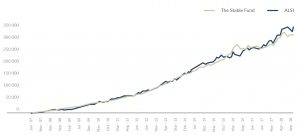
Figure 2: Performance of the Stable Fund and the ALSI since inception (June 2003)
Source: Bloomberg, Maitland Fund Services (Pty) Ltd
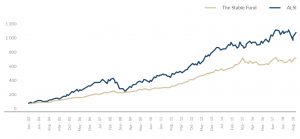
However, Figure 2 is a very misleading to the investor experience. The only investor that will be lucky enough to experience this compounding performance will be the person who invested a lump sum on 30 June 2003 and never invested or withdrew another rand from their investment since. The odds of being that investor is tiny. And the odds of experiencing a similar investment performance are even smaller.
The key statistic which we have ignored in our assumption, that the ALSI was a better investment than the Stable Fund, is the volatility of the two options. The Stable Fund has generated its return with less than half the volatility of the ALSI. Does this matter? Yes, especially if you, like many other investors, contribute monthly towards your investment portfolio.
Meet Nelson and Jonathan
So, let’s consider two ‘normal’ investors, Nelson and Jonathan. Nelson was born in 1978. By the age of 25 (2003), Nelson got his first well-paying job and, being a very diligent individual, he started saving R1,000/month in June 2003, increasing his monthly contribution by 6% in January of each year.
Nelson’s investment portfolio had two key contributors to the overall value of the performance – his monthly contribution and the performance of his selected fund. Initially, Nelson’s monthly contribution was by far the greater contributor to the value of the portfolio but, over time, as his portfolio value grew the performance of the selected fund becomes more important. Figure 3 provides an example of how the portfolio value will change over time.
Figure 3: Nelson’s portfolio value when investing in the Stable Fund
Source: Maitland Fund Services (Pty) Ltd
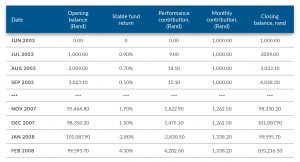
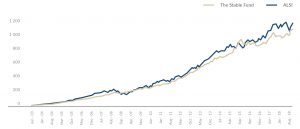
Nelson’s portfolio value is very different to Figure 1. We can see that for Nelson the low volatility of the Stable Fund meant that every contribution he made compounded at a similar rate, causing the Stable Fund to only slightly underperform the ALSI.
Figure 4: Nelson’s investment portfolio value over time
Source: Bloomberg, Maitland Fund Services (Pty) Ltd
Next let’s consider Jonathan. Jonathan was born four years later in 1982. He was also appointed to his first well-playing job at the age of 25 and started saving R1,000/month in June 2007, increasing his contribution by 6% in January of each year. Nelson and Jonathan are investing in the same prudent manner; the only difference being that Nelson is four years older than Jonathan and could thus start saving four years earlier.
Jonathan was unfortunate (or perhaps fortunate) to start investing at the back-end of a bull market. The performances of the funds were thus markedly lower than that experienced by Nelson, with the return statistics as follow:
Figure 5: Performance summary of the Stable Fund and the ALSI since June 2007
Source: Bloomberg, Maitland Fund Services (Pty) Ltd

Figure 6: Performance summary of the Stable Fund and the ALSI since June 2007
Source: Bloomberg, Maitland Fund Services (Pty) Ltd
Ironically, Jonathan did not suffer that greatly from the 2009 bear market. At that stage of his investment journey, his monthly investments contributed much more to his portfolio than the performance of the market. His investment experience would thus have been very similar regardless of whether he invested in the ALSI or the Stable Fund.
Figure 7: Jonathan’s investment portfolio value over time
Source: Bloomberg, Maitland Fund Services (Pty) Ltd
When the rainy day arrives
But again, I believe that we have missed the crux of why people invest. Prudent investors will have a long-term objective and attempt to match the return profile of their investment portfolio to the return required to achieve their objective. It is thus important to measure the success of an investment portfolio relative to where the investor would expect his/her portfolio value to be at that point in time.
Let’s assume that Nelson and Jonathan both acquired the services of the same investment advisor, John. John has a very consistent view of the world and believes that the expected returns of the various investment options will remain the same over time, especially when considering that you are a long-term investor (we can debate this view in more detail in a later strategy document).
John believed in 2003 and in 2007, respectively, that investors in the ALSI can expect a 14% return (inflation +8%) and investors in the Stable Fund can expect an 11% return (inflation +5%). Nelson and Jonathan thus had a reasonable expectation of where their investment portfolio should be at any point in time.
This is where the very real impact of ‘Lady Luck’ comes to the fore. Nobody can predict when their rainy day will arrive and thus a key measurement of an investment portfolio is how much it is deviating from your expectation. And this is where the volatility of a fund can cause some real havoc with the financial wellbeing of an investor.
Let us first consider Nelson’s reality vs his expectations. Nelson was very fortunate to start his investment journey at the beginning of a strong bull market. For the first five years of his investment journey his portfolio outperformed his expectation considerably, especially if he invested in the ALSI. It is after the GFC in 2008 that the picture started to change and by the end of 2018 his portfolio value was 26% below what he would have expected. If Nelson was unfortunate enough that he had to withdraw his investment at the beginning of December 2018, he would have been 26% short of his desired outcome, which he would have had to top up from somewhere, or he would have had to reduce his benefits. Had Nelson invested in the Stable Fund his portfolio value would have been, at worst, 7.24% below his expectation. This is a much more palatable situation.
Figure 8: Nelson’s portfolio value when investing in the Stable Fund
Source: Maitland Fund Services (Pty) Ltd
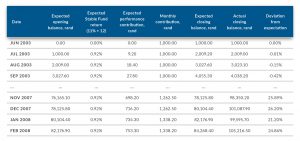
Figure 9: Nelson’s investment portfolio value relative to expectations
Source: Bloomberg, Maitland Fund Services (Pty) Ltd
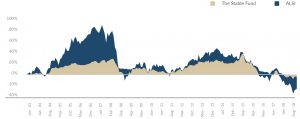
Jonathan’s journey was even more precarious. Because Jonathan started investing at the height of a bull market, his portfolio value quite often performed below expectations. Jonathan’s investment into the ALSI frequently underperformed his expectation by close to 40%. Had a chance event occurred at those critical times, Jonathan’s financial well-being could have been seriously impaired. If Jonathan was wise enough to rather invest in the less volatile Stable Fund, he could also have found his portfolio value below his expectations, however, importantly, the level of underperformance would have been much more palatable. His underperformance relative to expectations would have been limited to only 14%.
Figure 10: Jonathan’s investment portfolio value relative to expectations
Source: Bloomberg, Maitland Fund Services (Pty) Ltd
Conclusion
The above has been a very simplistic example of how important market volatility is in portfolio construction. We are fully aware that we have made some very simplified assumptions: for example, Nelson and Jonathan having only two investment options and only being able to invest in one and the pair never having follow-up meetings with their investment advisor to discuss the portfolio performance and re-align their expectations.
We are also aware of the pitfalls of using past market returns to highlight the investors’ experience, as a historic series of events will definitely not recur. But we do believe that this very simple example highlights just how important it is for investors to consider the volatility of a fund or a portfolio.
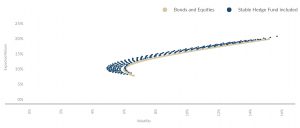
Diversification is key in lowering volatility and it is therefore critical for an investor to optimise their portfolio on the risk/ return spectrum. It is in this portfolio construction where hedge funds can again play an important role in optimising your portfolio. Due to the low correlation of hedge funds to the other main asset classes (i.e. equities and bonds), an optimal portfolio in SA will almost always benefit from adding some hedge-fund exposure. This is clearly evidenced in Figure 11 below, depicting the efficient frontier graph.
Figure 11: The efficient frontier for bond, equities and the Stable Fund
Source: Bloomberg, Maitland Fund Services (Pty) Ltd
Hedge funds are very useful investment alternatives available to investors. They should be well understood and not be entered into without some very good guidance and research. However, ignoring the benefits of hedge funds will almost definitely make an investment portfolio suboptimal.