As an active manager[1], Anchor naturally believes in the power of a considered investment decision-making process to deliver positive investment outcomes for its clients over the medium term. However, as the debate around active vs passive investment strategies continues (with quite extreme views in some instances), one key question to the discussion is often left out. Is the market efficient or not? Without a firm view on this cornerstone of the debate, we believe it is difficult to create a solid foundation to confidently build one’s case, either way.
As a result, the intention of this article is not to try to add to this emotive debate in the context of a binary one vs the other position but rather to look at the genesis of active management. Is there evidence to suggest that markets are, in fact, inefficient? If one can answer ‘yes’ to this question, the debate revolves around the difference between ‘good’ and ‘bad’ active managers – an entirely different discussion.
Unsurprisingly, this issue has been explored in detail by academics and market practitioners alike. While theoretical frameworks such as the efficient market hypothesis (EMH) have received considerable attention over the years, only some, if any, seem to effectively provide a framework that reasonably explains the real-world variance that investors experience over time. Equities’ prices can swing wildly; mispricing can appear to exist for extended periods in multiple areas, all within the context of an efficient market. How?
Various attempts have been made to discredit the notion of the EMH, with strong contributions from areas such as behavioural finance theory, which essentially deals with why investors often make behavioural mistakes and act against their best interests (think fear and greed, lack of self-control, etc.). While this area of finance makes a strong case, my personal favourite is a paper written by George Soros for the Journal of Economic Methodology in January 2014. The paper is entitled Fallibility, Reflexivity and the Human Uncertainty Principle. For those unfamiliar with Soros, he is one of the US’ most successful investors and philanthropists, probably most famous for making a US$1bn profit in a single day in 1992 when he ‘broke the Bank of England’. His Quantum Fund achieved annual returns of 30% from 1970–2000, an undeniable alpha generator.
In his paper, Soros explains why pursuing dogmatic empirical frameworks (as found in physics) in the social sciences leads to oversimplified frameworks, which lack credibility and fail miserably in real-world applications, particularly in financial markets. He firmly believes that, while pursuing empirical testing of social science constructs remains important, they should not be held to the same level of scientific cause and effect proofing as something like the laws of gravity. My take is that their role is not supposed to be purely mathematical but rather to facilitate deductive decision-making in the investment process.
What seems evident is that there is significant value to be added by understanding ideas that provide more nuanced outcomes when trying to map out the actions of thinking participants rather than looking to produce universal and timeless generalisations with symmetrical and reversible explanatory and predictive powers (Soros’ words, not mine, but this would be the type of criticism that the pure sciences would direct at social science).
You may be asking, what are fallibility and reflexivity in the context of investment philosophy and the EMH? Quite simply, with these two principles, Soros takes dead aim at short-term market efficiency and shoots it right between the eyes – a headshot. EMH is as dead as disco.
These two principles work in tandem. Soros’ definition of fallibility contends that where you are involved in trying to understand the actions of thinking participants in financial markets, the participants’ views of the world will never correspond with the full extent of reality. Participants can gain knowledge of individual facts, but when they roll these into forming theories or views, they are bound to be biased, inconsistent, or both. That is fallibility in its most simple form.
Once they have formed their views, participants act based on these imperfect views. These actions can change the nature of the market they participate in (though not necessarily making it more efficient). To make this construct a little less nebulous, here are a few examples to chew on:
- Rare-coloured wildlife: Approximately seven years ago, black impalas sold for around R750k per animal. With high demand and limited supply, prices rocketed, causing more speculation. According to Huntershill Safaris, in 2022, these black impalas could be hunted for R1,500 each.
- Bitcoin: Who knows what Bitcoin’s value should be? But when prices go up, people chase it higher even though they have no clue what the value of bitcoin should be. And when it gets some downward momentum, people run for the door. Greater fool theory … efficient?
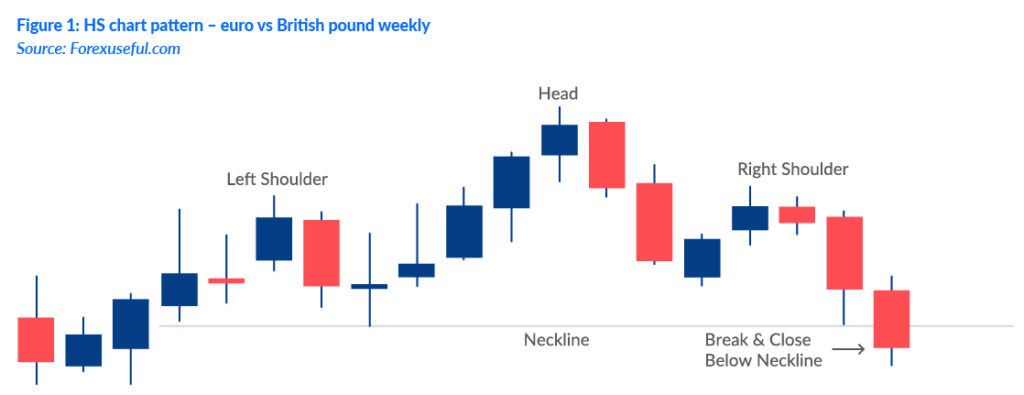
- Technical analysis: What does a head and shoulders (HS) chart pattern have to do with a stock’s underlying value? Zero. However, suppose enough people believe in technical analysis (which tens of millions of participants do – I am certainly not knocking technical analysis) and trade these patterns and their associated trading rules. In that case, the nature of their buying and selling in accordance with that pattern will shape the outcome.

See above for an example. A HS pattern is a signal for a change in direction. If the neckline breaks, the expectation is that the trend change is confirmed, and the target price to the downside is the difference between the top of the head and the neckline, subtracted from the neckline. If everyone believes that outcome, they sell for profit, with more selling bringing lower prices. Once the target is reached, they begin to buy to lock in their profits. As buying comes in, falling prices abate, and the pattern is confirmed. For no other reason than participants shaped the outcome by the sheer weight of their expectations and the actions they took based on those expectations – reflexivity.
In a genuinely simplistic form (and I am nowhere near doing justice to the depth of thought that has gone into Soros’ paper), from my perspective, more buyers than sellers mean prices go up. Higher prices reinforce the subjective view that a stock’s price should be higher based on some explicit or implicit assumptions, bringing further conviction to these ideas. So, the higher prices, which have been caused by initial changes in expectations but not necessarily by a fundamental shift in the investment case, are being used to reinforce the view that prices should go higher. And so, the virtuous cycle begins, and a reflexive system takes hold.
When does it recalibrate? Remember, in the market, all investors’ expectations are doing is shaping the price of a listed instrument. In the case of a company, the buying and selling of shares in the secondary market has zero impact on its ability to earn a profit. The system recalibrates when the disconnect between perception (this company is going to quadruple in three years, so that I will pay 100x earnings for it now) and reality (it reported compound EPS of 10% p.a. instead) stretches too far apart, expectations change, and prices adjust accordingly. Invariably, given imperfect information and fallible participants, markets are very rarely in equilibrium where expectations match pricing. Soros illustrates it nicely below.

The key to any reflexive system is the participation of thinking and interacting participants, which is exactly what a financial market represents. Millions of participants bring their ideas, thoughts, and imperfect views of the world to bear on the price of financial instruments. Therein lies the opportunity. In fact, I would go one step further and say that as investor participation broadens (a much larger retail presence than ever before), investment time horizons shorten, investor patience wears thin, and the degree of analysis taking place has more to do with price moves and news headlines than fundamental analysis, the bigger the opportunity becomes to take advantage of the gap between expectations and reality.
I mentioned earlier the need to loosen the hurdle rate for empirical proof of social science constructs. However, if all we have is theory, what value does it add to actually managing money? Without a practical use case, all we have is philosophical musings, which may be intellectually stimulating but do not pay the school fees.
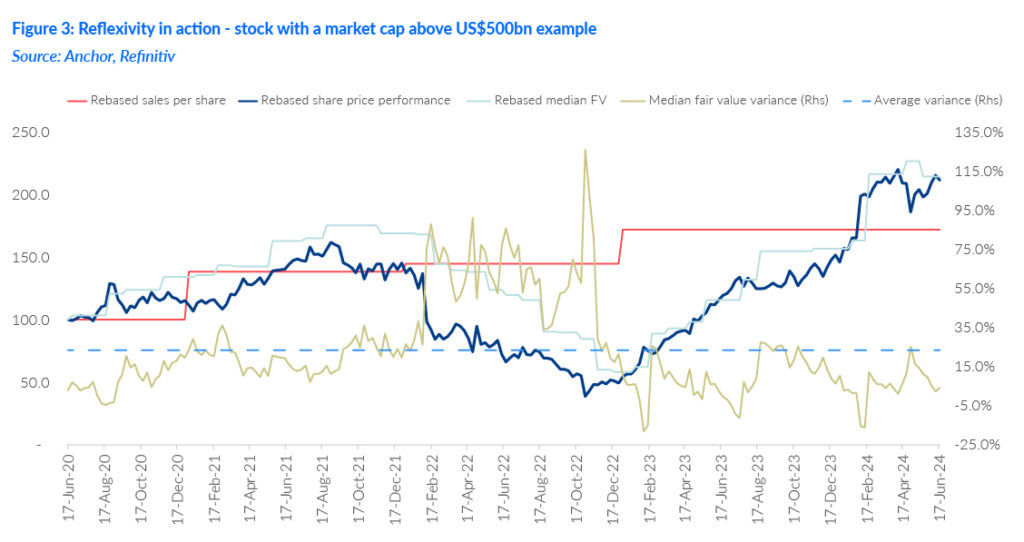
I will conclude this discussion by looking at reflexivity in action by analysing one of the largest stocks in the world. The name is irrelevant for this exercise, but the scale certainly is. The company has an enormous market cap, well over US$500bn. On Refinitiv consensus analysts’ forecasts, more than 60 of the top analysts in the world are submitting their estimates. It catches all the global headlines, sometimes for the right reasons, sometimes for the wrong reasons. It is a household name heavily held by managers worldwide and has ample liquidity. If there was a stock where the collection of fallible ideas would ultimately offset each other with the various gives and takes to settle on a short-term equilibrium fair value (think EMH), this would be it. Figure 3 below paints an interesting picture over the past four years.

The red line is sales per share. Notice how sales have gone up YoY. The black line is the performance of the share rebased to 100 in June 2020. If you had held the share during this period, with sales stable and growing, you would have been up 60% in the first year. Then, one year later, if you measured your performance, you were down 65% in total. Only to wake up two further years later and realise that you are actually up 115% from inception! What a ride. For a company with growing sales during the period, an enormous change in circumstances (or perception) has had to occur to justify the move. Daily active users during the period hardly budged …
The last three lines on the chart in Figure 3 are as follows:
- Green: Analyst median assessment of one-year fair value (FV). In 18 months, the smartest minds in the business cut their FV by 65%, only to backtrack 18 months later, taking that cut number back up by 259%.
- Solid blue line: The difference between the stock price and the share’s ‘supposed’ FV.
- Dotted blue line: The average weekly variance between stock price and the median FV.
You should always expect a premium between FV and current prices in aggregate for bull stocks as analysts submit one-year target prices. Still, it is interesting how big the variance between FV and price can get during dislocations: +100% and -25% at extremes. That does not look like efficient pricing to me.
While thousands of financial theories abound, the idea that investor expectations can shape a pricing outcome for a period until they are eventually weighed by the reality of earnings resonates with me. It resonates intellectually with my experience of managing money for the past twenty years on exchanges around the world. Disconnects can routinely occur idiosyncratically and structurally across sectors, regions, and at stock levels, which are all part of the investment journey. But, if you can get a handle on when the disconnects are at actionable levels, therein lies the opportunity.
[1] Active portfolio management entails frequently buying and selling equities to outperform a specific benchmark. This management style strives for superior returns but with greater risk. Conversely, passive management requires replicating an index or benchmark to match your investments’ performance.


