Global wealth continued to expand in 2024, with average wealth per person rising 4.6% YoY. As the UBS Global Wealth Report 2025 underscores, however, the distribution of this wealth remains far from uniform across countries and regions. Average wealth is calculated by dividing total household wealth by the adult population; yet this metric can be distorted by extreme concentrations at the top of the wealth ladder. Even so, it remains a valuable starting point. By this measure, Switzerland again tops the global ranking with average wealth per adult of US$687,166, followed closely by the US (US$620,654) and Hong Kong (US$601,195). Many of the highest-ranking nations are small but globally influential financial hubs, such as Hong Kong and Luxembourg. Notably, the US jumped from fourth place in 2023 to second place in 2024, reflecting the strong performance of financial markets and a stable US dollar.
Nonetheless, averages only tell part of the story. Median wealth (a more representative measure that identifies the midpoint of wealth distribution) offers more profound insight into inequality. Here, the gap between countries becomes more pronounced. The US, for example, ranks second globally in average wealth but slips to fifteenth in median wealth, reflecting its deep internal wealth disparities. By contrast, Luxembourg takes the lead in median wealth at US$395,000 per adult, followed by Australia at US$268,000. This contrast illustrates how wealth is distributed much more evenly in some countries than in others, despite similar headline averages.
Despite the disparities, the broader global picture reveals a world that has become steadily richer since the turn of the millennium. With a compound annual growth rate (CAGR) of 3.4% in real terms since 2000, wealth accumulation has shown remarkable resilience. Even after adjusting for inflation and debt, total wealth has consistently expanded, and the lowest wealth band (under US$10,000) continues to shrink year after year. While growth momentum shifted from Europe, the Middle East, and Africa in 2023 to North America in 2024, the long-term trajectory remains one of steady expansion.
One of the most striking developments in the UBS report is the rise of the “Everyday Millionaires” or EMILLIs – individuals with US$1mn-US$5mn in assets. Their numbers have more than quadrupled since 2000, reaching 52mn worldwide and collectively holding US$107trn by the end of 2024, almost equal to the wealth of the world’s ultra-high-net-worth individuals (UHNWIs, those with over US$5mn). While the pace of growth varies across regions, the upward trend is nearly universal, signalling the increasing prevalence of millionaires in societies once dominated by far lower wealth brackets. The millionaire population continues to expand, with 680,000 new entrants added in 2024 alone – a 1.2% YoY increase. Türkiye recorded the fastest percentage increase, while the United Arab Emirates (UAE) also posted robust gains. In absolute terms, the US remains dominant, creating over 1,000 new millionaires per day last year, far outpacing Western Europe and Greater China combined. Mainland China also contributed significantly, adding c. 380 new millionaires daily. Looking forward, UBS projects that by 2029, another 5.3mn people will join the ranks of global millionaires, a nearly 9% increase from 2024.
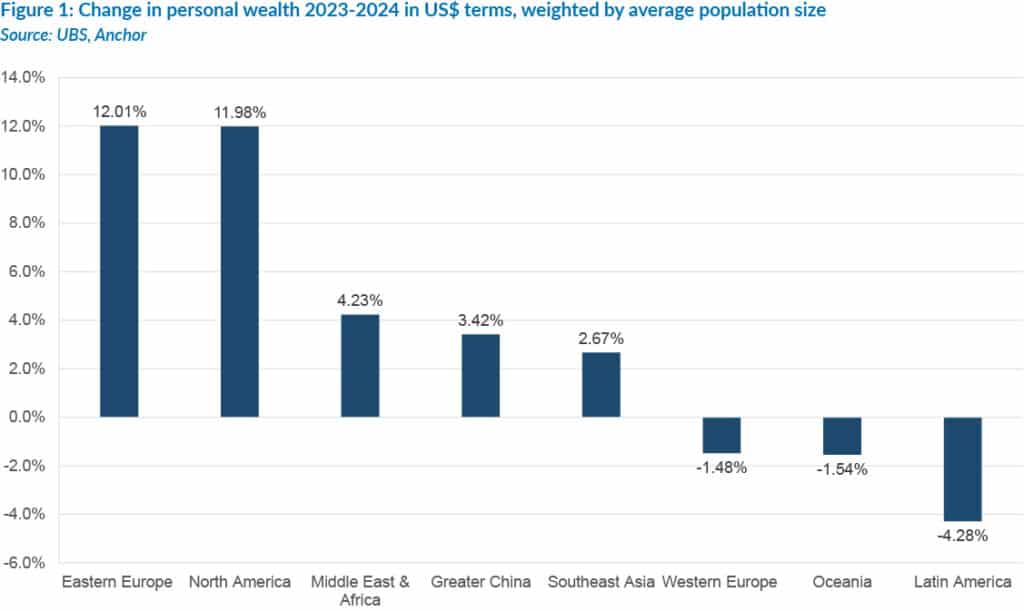
Regionally, Eastern Europe led wealth growth in 2024 at over 12%, followed closely by the US. Greater China and Southeast Asia posted more moderate increases, while Western Europe, Oceania, and Latin America experienced a relative decline compared to the previous year. Over the next five years, UBS expects North America and Greater China to remain the primary engines of global wealth creation, while smaller markets continue to benefit from niche growth opportunities. The report also points to long-term structural shifts shaping the future of wealth. Chief among these is the “great wealth transfer”: an estimated US$83trn expected to change hands globally over the next two decades. Women stand to benefit significantly, with US$9trn of that figure projected to transfer between spouses, further amplifying their role in wealth management and investment decisions.
Yet measuring wealth is not without its challenges. Currency fluctuations can distort comparisons, while many countries still lack robust mechanisms for regularly capturing wealth data. In addition, individuals are often reluctant (or simply unable) to provide accurate valuations of key assets such as property. Subsequently, while wealth measurement may lack pinpoint precision, it remains invaluable for identifying broader trends and shifts in the global economy.
EMs: The quiet force behind shifting global wealth
While the UBS Global Wealth Report focuses primarily on household assets, demographics, and the rise of new wealth cohorts, an important complementary trend shaping global wealth dynamics is the growing macroeconomic resilience of EMs. This resilience has increasingly enabled households in developing economies to accumulate wealth more steadily across economic cycles, narrowing (though not eliminating) historical gaps with advanced economies.
Over the past decade and a half (spanning the global financial crisis [GFC], COVID-19, and the post-pandemic inflation surge), most EMs have shown a remarkable ability to withstand global risk-off shocks. While favourable external conditions (such as stronger US growth, supportive commodity prices, or accommodative global financial conditions) helped, the deeper transformation has come from the strengthening of EM policy frameworks. These improvements have bolstered monetary-policy credibility, enhanced fiscal responsibility, reduced imbalances, and created more stable environments for saving and investment.
Monetary frameworks have advanced significantly: central banks are more insulated from fiscal pressures, inflation expectations are better anchored, and proactive tightening has helped to prevent persistent price surges. Many EMs also rely less on foreign-exchange intervention, as stronger macro fundamentals reduce the need for costly market operations. Fiscal frameworks have improved as well. Whilst EMs still grapple with elevated debt-service costs, many have adopted more countercyclical policies and become more responsive to sustainability concerns. Macroprudential tools have also helped reduce vulnerabilities from currency mismatches and excessive leverage- historical triggers for damaging capital-flight episodes.
These institutional improvements have delivered quantifiable macroeconomic benefits. Comparing pre- and post-GFC risk-off episodes shows that stronger EM policy frameworks contributed roughly 0.5 ppts to higher growth and 0.6 ppts to lower inflation in the year after a global shock. Meanwhile, benign external conditions boosted growth but did little to curb inflation pressures- underscoring the importance of domestic policy credibility.
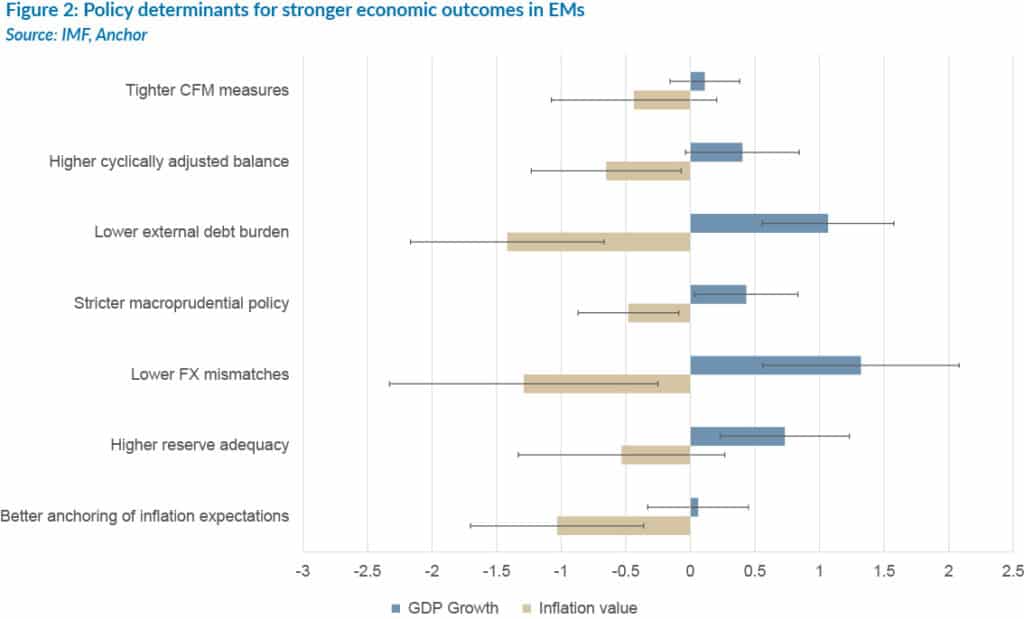
This relationship is clearly illustrated in Figure 2 below, which shows that EMs with stronger policy fundamentals (such as lower FX mismatches, well-anchored inflation expectations, or higher reserve adequacy) experience much better economic outcomes after global shocks. For example, a country with low FX mismatches (75th percentile) typically experiences around 1.3 ppts higher growth than a country with high mismatches (25th percentile) during risk-off periods. Similarly, well-anchored inflation expectations significantly reduce post-shock inflation.
In essence, EMs with stronger frameworks enjoy easier policy trade-offs, lower risks of capital flow reversal, and less need for emergency FX intervention. By contrast, EMs with weaker frameworks often face harsher consequences, including larger output losses, de-anchored inflation expectations, and steeper policy adjustments.
These developments matter profoundly for global wealth dynamics. As macroeconomic volatility declines and financial systems mature, more EM households have been able to accumulate durable assets, such as property, savings, pension contributions, and financial investments. This trend has contributed to the rise of middle-wealth cohorts in countries like Türkiye, Brazil, India, SA, and Indonesia. It has also supported the rapidly expanding millionaire populations in several EM regions, as economic cycles become less destabilising to household balance sheets.
Taken together, the evidence points to a clear conclusion: the world is getting progressively richer, but in uneven ways. The widening gap between average and median wealth highlights stark and persistent inequality. The expanding pool of EMILLIs reflects a world where middle-wealth cohorts are gaining ground even as UHNWIs retain vast concentration at the top. At the same time, the growing resilience of EMs- rooted not in luck but in stronger policy frameworks- has become an increasingly important force shaping global wealth creation.
With new millionaires emerging at a rapid pace and the most significant intergenerational transfer of wealth in history already underway, the global financial landscape is entering a period of profound transition. North America and China will remain the main engines of wealth creation, but the growing strength of EMs ensures they will play a far more influential role than in the past. For policymakers, investors, and households alike, understanding these dynamics is crucial- not only for navigating today’s wealth distribution but for preparing for the shifts of tomorrow.