At its meeting on 16 March, the US Federal Reserve (Fed) hiked rates by 0.25% and committed itself to chase inflation over the next two years. While much has been made of the ‘dot plot’ that shows six US rate hikes in 2022, with more hikes next year, in some ways, this was the Fed catching up to what the market was already saying. Inflation forecasting has been particularly difficult and the US Fed, along with most other forecasters, has been hopelessly inaccurate over the past year or so. We expect that current US inflation forecasts may also prove to be inaccurate. If you cannot forecast inflation, then you also cannot forecast the direction of interest rates. Much of the Fed’s dot plot and market pricing are influenced by current inflation and economic dynamics as the future is uncertain. Therefore, we need to accept that the Fed’s projections are best estimates, fraught with uncertainty. It is quite likely that the actual number of rate hikes might be higher, or lower, than the Fed’s current projections.
The US bond market has seen yields a little higher following the Fed’s announcement, although not to the extent that would be implied if all the hikes that the Fed is projecting do indeed occur. The pace of US economic growth is likely to slow somewhat in 2H22 and the market is essentially suggesting that, if the Fed does proceed with all the hikes, it projects we are at risk of a recession in the next few years. We have also seen the yield curve flatten and, in some places, it has inverted meaning that short-term rates are higher than the long-term rates. The traditional recession indicator is the inversion of the term premium on the 2-year vs the 10-year bond. At present, the term premium is a positive 0.22%, however, it has been trending lower for some time as yield curves have flattened.
For now, what we do know is that the Fed is likely to pay the price for increasing money supply over the COVID-19 period and that US interest rates will be on a steady path upwards for a while yet. Action on reducing the size of the Fed’s balance sheet might also reduce the extent of interest rate hikes required. This tighter monetary policy will likely spill across borders and influence the South African Reserve Bank’s (SARB’s) policy decisions.
The initial reaction from the SA bond market on the Fed’s interest rate hike has been positive and, at the time of writing, local bonds have rallied in the 24 hours since the Fed announcement.
The SARB did not print money during the COVID-19 crises and SA’s inflation rate (5.7% YoY) is currently below that of the US (7.5% YoY). We expect that local inflation will skirt the upper-end of the SARB’s target band (3% to 6%) for the next few months, before dropping toward the middle. Our best estimate is that annual headline inflation, as measured by the consumer price index (CPI), will average 5.5% in 2022 and 4.8% in 2023. The US needs to chase inflation, we do not. That said, the US does set the price of money on a global basis, and we believe that its rapid rate hikes will make the SARB more trigger happy when it comes to SA’s own rate hikes. We think that SA needs c. 1% more of rate hikes for 2022 and a further 1% of rate hikes in 2023, taking the repo rate to 6%. If we see oil prices push towards US$150/bbl, then we expect SA to get an extra 0.5% of rate hikes in each of 2022 and 2023. The SARB will be more inclined than not to hike for the next while and we should expect a hawkish statement at the conclusion of its Monetary Policy Committee (MPC) meeting which will be held from 22-24 March. SA consumers are under pressure and the rate hikes that we project will likely put the local economy close to a recession. We may also find that SA inflation falls faster than in other regions.
In terms of local bonds, the number of hikes that we are talking about (even in the oil-price-at-US$150/bbl scenario) are already in bond prices. We therefore expect that a gradual rate-hiking cycle will prove to be bond positive as the market absorbs rate hikes that it already expects, and uncertainty is reduced.
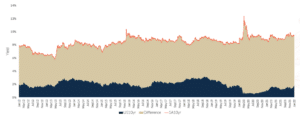
In Figure 1 below you can see the blue band at the bottom, which is the yield on the US 10-year bond over time. The red line on top is the yield on the SA 10-year bond. The shaded area between the two is the spread between SA and US bonds. Note how that spread widened dramatically over the period from around February 2020. As the world normalises, we expect that spread to narrow back down towards historic levels. This means that US yields rising will likely see the brown-shaded area compress rather than SA yields rise. In fact, this is how it has played out for much of 2022, where the Anchor BCI Bond Fund has a positive return for the first two months of this year (and is also positive YTD), while US bond yields have risen dramatically.
Figure 1: SA vs US 10-year bonds

Source: Anchor, Thomson Reuters
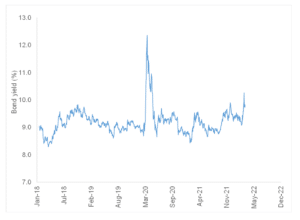
While rate hikes in the US will be a headwind for domestic income, we expect that SA bonds will continue to perform. In fact, if we look at Figure 2 below, which shows the yield over time on the SA government bond maturing in 2030, what stands out is that it has seldom been cheaper than it is today. We expect that the high yields on offer will continue to insulate our bonds from US bond yields maybe rising a little further and local bonds will remain interesting to investors.
Figure 2: Anchor SA bond yield monitoring – R2030 bond

Source: Anchor, Thomson Reuters


