In this article, we examine the nature of stock market returns. We conclude that the distribution of stock market returns is highly concentrated in a tiny number of stocks with sizeable positive performances that drive total returns for entire indices. We believe public equity returns resemble venture capital returns far more closely than investors would believe to be the case. Most individual stocks also underperform Treasury Bills over the short and long term.
A small proportion of index constituents generate significant returns and drive overall returns for the entire index. This phenomenon is true across time periods in the US. J.P. Morgan Asset Management published a fascinating study that examined the distribution of stock market returns from 1980 to 2014 (34 years). The study focused on the Russell 3000 Index, a US equity index that includes the 3,000 largest US stocks by market capitalisation. Over the 34 years, 40% of these stocks lost 70% or more of their value and never recovered. A small group of just 7% of the stocks in the index generated essentially all of the index’s returns. This small group of stocks outperformed the overall index by at least two standard deviations.
Hendrik Bessembinder, a US professor of finance and economic analyst, observed similar findings in his paper for The Journal of Financial Economics, entitled “Do Stocks Outperform Treasury Bills?”. The report studied all stocks listed on the American Stock Exchange (AMEX), the New York Stock Exchange (NYSE) and the Nasdaq from 1926 to 2016. There were 25,967 stocks in total in the universe studied over the period. Five companies out of a universe of 25,967 shares accounted for 10% of the total returns generated over 90 years. Put another way, 0.02% of the companies accounted for 10% of the total returns generated over 90 years. Even more surprisingly, just 4% of the companies accounted for all the returns generated. The J.P. Morgan Asset Management study and Bessembinder’s paper demonstrate that a small number of stocks generate significant returns and drive total returns for entire market indices.
Most stocks deliver returns that are worse than bonds. Again, this is counterintuitive considering old investment adages such as “stocks outperform bonds” or “stocks outperform bonds due to their higher degree of risk”. According to Bessembinder, of the 25,967 stocks studied over 90 years, 57.4% of monthly returns were lower than the returns on one-month US Treasury Bills for the same month. This was found when looking at each stock’s return over its listed lifetime until it either delisted or at the end of the period. This was true even with the reinvestment of dividends. Despite this underperformance of most stocks in comparison to US Treasuries, stock market indices do, in fact, outperform bonds in total because exceptionally strong positive performances from a small number of shares in those stock market indices more than compensate for the mediocre performance from the rest of the index. Bessembinder found this to be true when looking at one-month and ten-year returns. Returns over a decade are lower for most stocks than those over a decade for Treasury Bills.
The degree of concentration of stock market returns in a small number of stocks appears to be increasing over time. Bessembinder established that the percentage of stocks underperforming US Treasuries has increased over time. From 1947 to 1956, 87% of stocks outperformed US Treasuries. From 1957 to 1966, 62% of stocks outperformed. By the time we reached the 1977 to 1986 period, just 32% of stocks outperformed US Treasuries. Astonishingly, since 1977, the median stock has had a negative return and underperformed Treasuries.
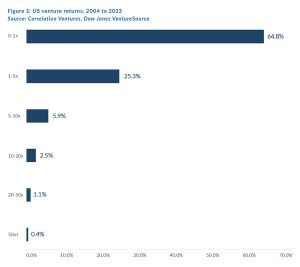
We believe public equity returns resemble venture capital returns much more closely than investors believe to be the case. Investors generally accept that a small number of investments drive the entire portfolio’s performance in venture capital investing. For example, Correlation Ventures studied US venture returns from 2004 to 2013 and found that 64.8% of US venture investments did not have positive returns over the period. Twenty-five percent had 0% to 400% returns, and just 0.4% of venture investments returned 50x their investment. This small group of investments would have been a significant driver of returns for the portfolios in which they were included. It is noteworthy to see how similar this distribution of returns is to the studies by J.P. Morgan Asset Management and Bessembinder.
Several implications can be drawn from these findings on the nature of stock market returns. First, most stocks in equity indices generate small to negative returns. The large positive returns generated by a few stocks more than offset these mediocre to poor returns from the majority. A second implication is that the driving factor behind frequent investor underperformance of equity indices is the failure to identify ex-ante (based on what is expected to happen, i.e., based on forecasts) this small group of winners. Conversely, market-beating portfolios are likely to contain an above-average proportion of the small group of winners. These findings also have implications for the degree of concentration or diversification investors should pursue in their portfolios. Highly diversified portfolios increase the likelihood of investors owning the small group of winners over the period in question but also increase the probability of poor performance being contributed by most mediocre-performance stocks.
Portfolio concentration increases the stock picker’s responsibility to identify ex-ante the future small group of winners. It may also, however, give the stock picker the ability to avoid the large group of mediocre-performance stocks, assuming the portfolio concentration leads to more stringent filtering for any stock to be included in the portfolio.
To conclude, we note that stock market returns are naturally counterintuitive and much more right-skewed than we, as investors, naturally perceive. Furthermore, this phenomenon has increased over time. Despite general convictions to the contrary, public equity market returns may be much more akin to venture capital returns than we would otherwise have believed to be the case.