Global Backdrop
The extent of the rot in the SA state sector is only now becoming apparent, far exceeding what we had feared. In this context, the rebuilding of SA is going to be a protracted task as the state works to recreate its ability to provide basic services and infrastructure to its citizens. Fixing Eskom and other SOEs is a step in the right direction, but this is in and of itself not enough to kickstart our economy. A trust deficit has been established at job creators as political policies and utterances have generally sought to tilt the playing field away from business and job creation. Policies have been focused on taking the pie from business and giving it to other segments of our country.
Policies have been focused on taking the pie from business and giving it to other segments of our country.
The surprise factors of prescribed assets and the proposed National Health Insurance (NHI) continue to incentivise the upper middle class to focus on income and job creation outside of our borders and as such the country’s tax base is being exported. The continued pressure from government on business and the upper middle class means that the RMB/
BER Business Confidence Index is currently at its lowest level in two decades (3Q19’s reading stood at 21 – well below the 50-point mark separating expansion from contraction).
That being said, we do think that we are in a better place than we were a quarter ago. The direction of change is an improvement, albeit gradual. We are also pleased to see that economic policy is coming to the forefront of discussions and that sensible proposals are being discussed. We expect this trend to continue for a while and, accordingly, we remain more positive on SA’s longer-term outlook.
The global environment is also coming under pressure as isolationist and nationalist policies are taking hold. Trade and growth are slowing, whilst uncertainty is rising. We have seen particularly disappointing manufacturing numbers out of most developed countries, which portends a further slowdown of their economies. Europe has been pushed to restart its bond buying programme (quantitative easing [QE]) less than a year after having terminated it, and the US has cut interest rates twice already this year. Perhaps the only bright spot currently is the US consumer, who is still benefitting from strong balance sheets and earnings growth. We think that they will be enough to keep the US economy grinding on, albeit at a slower pace than before.
Overall, the world economy has been slowing and is likely to bumble along at its current pace for the remainder of 2019.
South African Equities
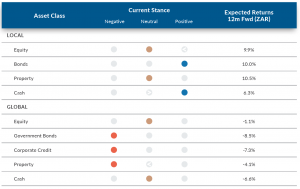
We head into the last quarter of this decade with the domestic market still in the doldrums. The SA market is in cheap territory but is lacking the growth required to kickstart a sustained upturn. With sentiment and expectations at low levels, the potential exists for some resolution of the SA macro issues to boost equities.
Hence, on a 12-month view, we maintain a moderately overweight position, but our conviction levels in the shorter term are not particularly high. Our 12-month return projection for domestic equities is 10%. On balance, we believe investors should remain patient, as valuations already reflect a very slow recovery. We hope to be positively surprised.
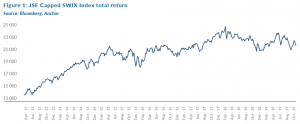
Figure 1 below shows the total return of the JSE Capped SWIX Index. The relatively flat performance should be seen in the context of positive returns from resources and Naspers, but a sharp decline of domestic counters.
The direction of global markets and, more specifically, emerging markets (EMs) are important for the local market. However, global macro conditions have worsened over the past quarter and EMs are reflecting this.
We are comfortable owning these equities at current valuations, although we acknowledge that the next 12 months could produce returns below historical trends.
When assessing the SA market, one must always bear the drivers in mind. This is shown in Figure 2 (measured with reference to the FTSE JSE All Share Index).

The SA economy drives roughly 40% of our share market. Earnings have been under pressure locally and a low-growth environment means that this is likely to continue over the next 12-24 months. However, shares already reflect this and the share prices of many big companies are down 20%-50% since their highs. In the case of Anchor portfolios, the shares that we own in this category are, in aggregate, trading at less than a forward 9x PE and greater than a 4.5% dividend yield.
A recovery in the local component of the index is unlikely to be earnings driven, but good news on the political front could spur a share price recovery, which is why we are still comfortable holding higher-quality counters. Among these are Bidvest, FirstRand, Rand Merchant Investment Holdings (RMI), Clicks, Dis-Chem and The Foschini Group. Some decisive actions by government on Eskom and the economy, as well as evidence of the National Prosecuting Authority (NPA) acting against corrupt individuals in the public and private sectors could see an improvement in confidence. Within the next month we should also see announcements on the new Eskom turnaround plan, a growth plan for the economy, the medium-term budget policy statement (MTBPS) and the Moody’s rating review.
Naspers (characterised as Chinese gaming in the pie chart above) is the second-biggest driver of market performance. The Naspers/Prosus combination will largely be driven by the performance of Tencent. It seems evident that the recent Amsterdam Prosus listing is unlikely to be the key to a discount unlock. Tencent growth fundamentals look great for the next 3-5 years and the recent share price pressure is largely due to macro pressures on EMs, rather than the underlying company. Tencent tends to be fairly volatile and it is generally a good time to buy when the price is materially off its highs (currently 30%). We note that Tencent is currently trading at close to its low for the year.
20% of our share market is driven by the global consumer and economy (with a further 20% driven by Chinese gaming). We are moderately positive in this space, although less so than a few months ago, after a marked slowdown in global growth. Company specific factors tend to dominate share price moves here. We are cautious on Richemont in the short term after Hong Kong retail sales took a dive following domestic protests and unrest.
Another c. 21% of our market is commodity price driven. Gold and platinum shares have been the stars this year and we continue to hold platinum exposure, with the increased demand being driven by carbon emission standards outweighing the reduction in global car sales. In the very short term, the risk of strikes in the platinum sector has increased after trade union, the Association of Mineworkers and Construction Union (AMCU) declared a dispute and we are monitoring this closely. High platinum basket prices will no doubt lead to high wage increase expectations.
Sasol is in a category of its own and the key event for the share price is the release of delayed full-year 2019 results, which we believe will be accompanied by a board review of its Lake Charles Chemicals Project in the US. This should take place in October and will be the key driver of Sasol’s share price performance.
Within SA equities we are still comfortable with a balanced approach to portfolio construction, selectively taking on more risk when the right opportunities present themselves
Most analysts have a valuation of the share materially above the current price, but management need to win back the faith of the investment community following the Lake Charles debacle. This US project will now cost closer to $13bn, compared to the $6bn budget when the project commenced.
Gold is not in our natural investment arc but is serving as a good defensive asset at present. Iron ore has remained strong at around $80-$90/t, although well off its highs from earlier in the year. The share prices of the likes of Anglo American and BHP are cheap relative to the iron ore price and are currently generating strong free cash flows.
We are watching this sector with caution as the remainder of the commodity sector has been under pressure and, in many cases, are down substantially YTD.
Within SA equities we are still comfortable with a balanced approach to portfolio construction, selectively taking on more risk when the right opportunities present themselves.
South African Bonds
The SA bond market has remained strong into 3Q19, with the All Bond Index (ALBI) growing 1.36% over the quarter, with a 9.01% increase YTD (as at 23 September 2019). The curve shape has held stable over the quarter, with the 2-year yield weakening 4 bps and the 20-year weakening by 8 bps.
The 5-year credit default swap (CDS) has consistently traded below 200 bps throughout the quarter, currently sitting at 188 bps. The US 10-year yield has traded in a band from 1.41% to 2.12%.
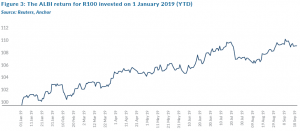
We note that ALBI returns YTD have been strong with a R100 initial investment, yielding a current value of R109 (See Figure 3). Furthermore, at no point this year has the ALBI dropped below its 1 January 2019 level of 631.293.
The local political situation remains tenuous – violence against women has become a flashpoint, alongside xenophobic attacks and the uncovering of political beneficiaries of the VBS collapse. These are all proving that the domestic situation is fraught with difficulties in the run-up to the MTBPS on 30 October. Much depends on the viability and believability of the economic growth plan.
This MTBPS will therefore be closely monitored by ratings agencies, potentially with a view towards a future downgrade.
The market is also deeply concerned about how Treasury plans to finance Eskom, while the state electricity utility is undergoing a turnaround. Many of the possible new initiatives such as the proposed NHI and prescribed assets are also negative for the market and are creating distrust. This MTBPS will therefore be closely monitored by ratings agencies, potentially with a view towards a future downgrade. Beyond SA, global uncertainty continues to dampen investments into EMs in general, however 2Q19 reporting did see foreign direct investment (FDI) inflows of R26.3bn.
Current interest rate expectations remain tied to whether the low-growth environment persists hand-in-hand with the SA Reserve Bank’s (SARB’s) targeting of a 4.5% inflation rate. We view SA inflation at 4.8% and US inflation at 1.8% – giving a differential of 3.0%.
The long-run CDS spread of 220 bps and a US fair-yield of 2.2%, gives a fair value of the 10-year benchmark bond at 7.4% (being the summation of these three factors). We adjust this fair yield upwards, considering the political uncertainty discussed above, and we maintain a fair yield for the SA benchmark bond of 8.0%. The bond is currently trading at 8.34% and it has traded in the band of 7.98% to 8.45% for the past quarter (3Q19).
This gives us an expected return of 10% over the next twelve months, which comprises of interest income of 8.3% and capital gains of 1.7%.
South African Listed Property
The quarter ended 30 September (3Q19) has been a difficult market for SA equities overall and the listed-property sector once again proved to be an ineffective hiding place, ending over 4% down QoQ. Among the twenty worst-performing stocks on the JSE for 3Q19, c. 20% were property companies, including Delta Property Fund (-70.0% QoQ), Rebosis Property Fund (-54.0% QoQ) and Accelerate Property Fund (-44.6% QoQ). SA-focused mid-and small-cap companies were among the hardest hit, with some property fund companies such as Rebosis, Delta and Accelerate starting to exhibit price behaviour reflecting existential stress.
The weak local economic conditions mean that landlords are being squeezed hard by cost-conscious tenants and growth in rental streams is being eroded. This has the knock-on effect of property valuations falling because property companies are making less money and, in turn, where there is a less than very conservative loan-to-value (LTV) ratios, investors are getting spooked.
Those property companies that are attracting investment have one or a combination of the following attributes:
- An LTV ratio of less than 35%.
- Niche property sector positioning i.e. modern logistics assets, regional retail malls, etc.
- An offshore strategy focused on growth economies and asset categories.
- A formulaic pay-out, which guarantees at least inflationary growth in distributions i.e. Fortress -A- shares.
Until such time as the SA economy shows some sign of a recovery it is unlikely that this trend will change dramatically. However, as we highlight in our article entitled SA Property: Light at the end of the tunnel? on page 25, the local listed property sector is now offering yields that will, aside from the unlikely event of an Armageddon-type scenario playing out, reward the long-term investor.
We therefore maintain our neutral weight asset allocation to the sector as we forecast the harvesting of a double-digit dividend yield, even in an environment where capital growth is being challenged.
The Rand
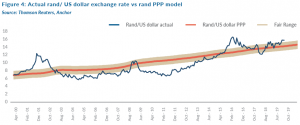
Projecting the rand’s value in a year’s time is a fool’s errand. The rand vs US dollar exchange rate is one of the world’s most volatile currency pairs and trades well away from any modelled fair value for long periods. We note, however, that the rand trades within a R2.50 range to the dollar in most 12-month periods.
We retain our purchasing power parity (PPP) based model for estimating the fair value of the rand and we have extended this out by three months since our last Navigator’s publication.
Our PPP-modelled value for the rand vs US dollar at the end of the next 12 months is R14.05/$1 (See Figure 4). We apply a R2.00 range around this to get a fair value range of R13.05-R15.05/$1.
We have become less optimistic about the outlook for EM in general. In the context of a slowing global economy and global event risk, we expect that the dollar will remain supported as a currency of refuge and that the rand (along with many EM currencies) will trade slightly weaker than its fair value.
We note that the rand ended 3Q19 at R15.18/$1, which is just outside our fair-value range. We expect that the rand will remain on the weak side of fair for the next while. For modelling purposes, we have used the R14.05/$1 midpoint of our range.
Global Equity Markets
World markets have traded sideways for close to two years now, with the only interlude being the sharp decline in late 2018, followed by a matching rebound earlier this year. The past five months have been flat, with a few unconvincing S&P attempts to break through to meaningful new highs. At the same time, global growth prospects have declined, and volatility has increased. The US Federal Reserve (Fed) has responded by cutting rates and the market has held up as investors remain hopeful that further cuts will follow.
The market feels like it is looking for direction and the strength of the US consumer has been the saviour. We are also cognisant of the fact that US President Donald Trump will be focussed on economic growth prior to the November 2020 election. This might pave the way for more market- friendly moves going into next year.
It would be reasonable to expect continued volatility in the coming months but, on balance, we anticipate a 6% US dollar return from global equity markets over the next 12 months, which is slightly below historic averages. The rand return is likely to be less positive, given our view that the local currency is likely to strengthen over the next 12 months.
Our key observations are that valuations are at the high-end of normal and expectations are relatively high, although coming off a low base, where the last few quarters have had a moderate headwind from US dollar strength.
It would be reasonable to expect continued volatility in the coming months but, on balance, we anticipate a 6% US dollar return from global equity markets over the next 12 months.
The major risk to our moderately constructive view is that we encounter a period of increasingly bad data and company results, which could see the market lose confidence in the global slowdown being moderate in nature. This could, in turn, see the moderation or reversal of some of the more damaging Trump moves of the past year.
Figure 5 below shows the MSCI World Index over the past six years:
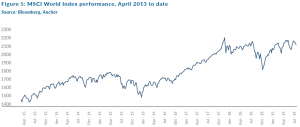
Trump’s antics have dominated global economics over the past two years. The US has been the major beneficiary and, while the S&P 500 is near its all-time high at 3,000, other key indices are well off their highs since October 2018 – MSCI EM Index (-20%), Japan’s TOPIX (-15%) and Euro Stoxx (-7%). This leaves all these indices exactly where they traded c. one-year ago.
Despite this being one of the longest positive runs in global markets, dollar returns have been relatively muted and have lagged earnings growth. The MSCI World Index is up 2% over the past 12 months (S&P is up 2.1% over the same period) and the compound return over the past five years is 4.9% p.a. (S&P=8%).
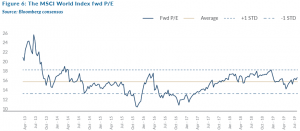
The MSCI World’s forward PE has oscillated either side of 16x for the past five years and is trading just above this level currently. Markets seem fairly priced assuming reasonable world economic growth. However, the risks to this have risen and hence our base-case return projection is moderate.
All eyes will be on earnings growth over the next 12 months. The jitters caused by trade tensions has seen confidence levels reduce and the consensus view is now for just over 3% world economic growth (from close to 4% a year ago.) A positive resolution to the trade spats and a reasonable outcome could see a further bounce in markets.
The level of bullishness regarding global equity markets has retracted and individual exposure to the market is low by historic standards.
Nevertheless, analysts are fairly bullish about earnings (see Bloomberg consensus numbers in Figure 7) and, if the 17% forecast earnings growth for the next 12 months for the S&P materialises, our projected return could be exceeded. Average earnings growth over the past 10 and 20 years is in the region of 8%.
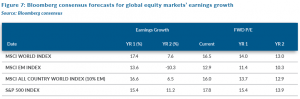
The forward PE of 15.4x for the S&P 500 (and 14x for the MSCI World Index) is relatively undemanding and should underpin markets if confidence levels do not deteriorate further. US bond yields are back at levels well below 2% and borrowing costs are likely to be subdued for an extended period, making equities relatively attractive.
We favour the US market for equity exposure. The negative impact of the stronger dollar should work its way out of the system in the coming months and there is strong growth momentum from the tech giants which, on average, generated 17% turnover growth in their recent results. Traditionally, defensive shares such as utilities and tobacco companies have performed well in these market conditions, but their relative lack of growth has seen their share prices lag.
Europe has delivered a similar return to the US this year, but a lack of earnings growth in this region will make superior returns hard to achieve and the core German economy, Europe’s largest, is looking particularly worrying. The upside surprise could be the UK, where Brexit has restrained share prices. Any certainty as to the path forward could be a catalyst.
EMs are trading at a 20% discount to DMs, although this has been the trend for the past decade. We like the tech space in EMs, where secular trends are relatively unimpacted by tariffs. There is a reasonable chance that commodity prices will roll over towards the end of the year (as the current perfect storm reverses) and these are especially important for this segment of the market. All eyes will be on China’s ability to stimulate its economy as many metrics currently point downwards.
The risks in global equities have increased as global growth slows, but the actions of politicians and central bankers could spur markets further. While the economic expansion is long in the tooth (and the slow bull market continues), we would still maintain at least neutral exposure to equities, especially given the relative unattractiveness of other asset classes.
Global Bonds
A year ago, markets were expecting the Fed to deliver one more rate hike for this cycle (the ninth since 2015), which was duly carried out by Fed Chair Jerome Powell in December 2018. Since then, trade wars have impacted global trade and market sentiment and the Fed has had to reverse course, cutting rates twice in the past two meetings. While the Federal Open Market Committee (FOMC) members are split on whether we’ll see another US rate cut by the end of next year, markets are pricing-in three cuts over the next twelve months, with two of those expected to come in the next six months.
Trade wars have impacted global trade and market sentiment.
Across the Atlantic, the European central bank (ECB) has also been forced to reverse course on its attempts to normalise monetary policy. The ECB stopped adding to the size of its balance sheet at the end of last year and, at that stage, were hopeful that it could start edging interest rates back up towards positive territory by 4Q19. The exact opposite has happened as ECB President Mario Draghi used his second- last meeting at the helm of the ECB to deliver a cut deeper into negative territory for European interest rates and a resumption of the ECB’s balance sheet expansion, with an open-ended pledge to purchase EUR20bn of bonds per month starting in November.
The backdrop of falling rates and weakening sentiment has pushed US short-term rate expectations over 1% lower over the past two quarters and, with short-term rate expectations as a key input to our models for valuing US long term bonds, we’ve seen our US 10-year government bond yield forecasts fall largely in tandem.
The other key input to our model is inflation expectations and although these have moderated slightly, we struggle to see US inflation below 2% over the next twelve months. We’ve increased the probability of a recession over our forecast horizon, though this remains far from our base case. We think that the Fed will probably deliver two rate cuts in the next twelve months, which should do enough to stabilise markets. This leads us to a US 10-year government bond yield forecast of 1.9% twelve months out, delivering investors a 1% total return loss in US dollar terms over that time horizon.
In credit markets, while we’ve seen a mild deterioration in credit spreads recently, we think it’s reasonable to assume that credit spreads will continue to drift higher as we get deeper into this economic cycle. Deteriorating credit spreads and slightly higher interest rates will combine to deliver a small negative US dollar total return for investors in US investment grade bonds of around 0.1% over the next twelve months.
Global Property
When global yields started falling in 2Q19, we would’ve expected property stocks to re-rate. However, these stocks were left behind, held back by the retail real estate investment trust (REIT) sector (which accounts for more than 20% of global property indices), caught in the throes of a shift in shopping habits and the UK REITs (c. 5% of global property indices) having Brexit uncertainty hanging over them. As yields fell further in 3Q19, global REITs finally benefitted with the asset class one of the best-performing for the quarter (the FTSE/EPRA/Nareit Developed REIT Index was up over 5% for 3Q19).
We typically expect the global REIT dividend yields to adjust by about half of the move in US 10-year bonds and, if that holds, it’s reasonable to expect capital losses of c. 2.5% in global REITs as US 10-year bonds head to our target of around 1.9% over the next twelve months. An average dividend yield of c. 3.8%, which should grow about 2% p.a. should leave global DM REIT indices with a total return of around 3.3% in US dollar terms over the next twelve months.