Global Backdrop
This past quarter (2Q19) has seen the much-anticipated SA general election come and go without too much of an impact on the market. The country remains in the throes of political instability, corrupt politicians continue in parliament rather than going to jail and a third of President Cyril Ramaphosa’s first term as the head of the ANC has now passed. Eskom also continues to be the elephant in the room for any discussion around SA’s economic prospects. Sluggish tax collection and vehicle sales remain symptoms of an economy that is stagnating. So, overall, it is difficult to get excited about the domestic economic outlook. Perhaps we should take some comfort from the high frequency data that is looking marginally better than in the past quarter. Signs are there for an improved local economy next year, if we can only get policy assurance and political certainty.
Globally, economic growth expectations have been trending downwards as well. The Fed’s Federal Open Market Committee (FOMC) surprised at its June meeting when it opened the door for interest rate cuts. This gives some support to bonds, but slowing economic growth is nevertheless perturbing. At the same time, Brexit appears to have spiralled out of control with the UK’s House of Commons seemingly out of touch with the reality in which they have placed themselves. We don’t see much improvement in the situation even once the next prime minister is appointed.
Overall, the world economy has been slowing and is likely to bumble along at its current pace for the remainder of 2019.
South African Equities
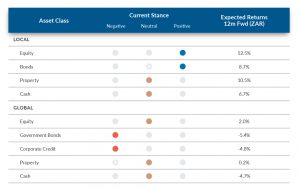
The SA equity market has returned a solid 10% for the first six months of the year, although we note that the market has still not recovered from the losses incurred in 2018. We again expect a reasonable return of 10%-15% for the next 12 months through a combination of factors. Figure 1 shows the total return of the JSE Capped Swix Index:
Figure 1: JSE Capped Swix Index total return
Source: Bloomberg, Anchor
Below, we analyse the different segments of the market:
- The “New Dawn” segment of the market (+/-50%) has performed poorly for some time now as SA GDP has stagnated and the local consumer has been under pressure from many quarters. SA is coming off a low base, which should see some improvement as the well-publicised issues of the last few years get progressively resolved. The risk is continued stagnation, although valuations are not factoring in much optimism.
- Basic materials (15%) have been the star performers for the past two years and iron ore, which is the key driver, is trading at over $100/tonne. This is historically a very high level and, to put this in context, some Australian mines have a cost per tonne of less than $20. We expect these elevated levels to be sustained for some time but, as we move into 2020, normal cyclical forces could see the gains experienced over the past year reverse. For the time being we expect the big mining houses to continue to generate massive free cash flows and our view is that the shares should continue to do well.
- The rand-hedge component of the market (20%) is dominated by Naspers which, in some SA indices, comprises over 20% of the market. 83% of our Naspers valuation is composed of its stake in Tencent and, we believe, that this company has great prospects for years to come. The Naspers “core” operations showed impressive growth in its recent results and the September listing of a portion of its business in Amsterdam could potentially see some unlock of the 35% discount at which the company trades to its underlying value.
- The remaining 15% of the market has a variety of economic drivers and tends to be company specific.
The backdrop for emerging markets (EMs) looks fairly promising, although not without risks. Headline GDP growth is strong and lower interest rates in the US have been encouraging the carry trade. This, in turn, is positive for EM currencies, inflation and interest rates. Trump madness always poses a risk to this growth, but EMs are more domestically driven than many people assume (i.e. they have strong internal growth not reliant on exports).
Positive EMs are generally constructive for SA, as the drivers are similar, and SA usually benefits from a default flow of funds into indices. However, sentiment is currently very negative towards SA and fund managers have low weightings in SA. Many are underweight SA and far worse, many are indifferent – SA is tiny in the global context and the succession of disappointing political headlines result in potential investors turning the page. Feedback from brokers canvassing global EM asset managers is that they are happy to wait on investing in SA until it is clear that the country is on a growth path.
Many of the points above coincide with a low point in markets. Fund managers being underweight SA means there is plenty of capacity to invest once confidence is regained. Within SA, interest rates are likely to be cut, the rand has strengthened this year and, while the changes are frustratingly slow, the country is in a far better place than it was 18 months ago. Hence, optionality remains in the SA Inc. component of the local market.
The SA component of the market is cheap if reasonable GDP growth follows – banks have an appetite to lend and SA corporates will be keen to invest if they can get confidence back in the economy.
Nevertheless, risks in SA remain elevated and we are positioned in the more defensive SA-centric shares, with healthy exposure to resources and Naspers.
South African Bonds
The SA bond market has seen quite a rally in 1H19, with the sharpest moves occurring at the end of 2Q19. The short end and the belly of the curve benefited most during this rally, with the short end strengthening by c. 73bps, while the belly firmed by 46bps and the long end of the curve strengthened by just over 24bps. The All Bond Index returned 7.6% YTD and 2.8% in 2Q19.
On the local front, we have seen an easing political atmosphere with some guidance and willingness to tackle issues that restrict economic growth in the country. On a global front, declining interest rates have reignited the search for yield. We expect that the appetite for SA bonds will remain intact in the medium term as global factors become more favourable towards emerging economies.
We believe that the low-inflation/ low-growth environment will persist in the near term with SA inflation expectations at 4.8%, while US inflation expectations are at 1.8%. For the purpose of our fundamental fair-value model, we use the long-run average inflation differential of 3.0% and the long-run average credit default swap (CDS) spread of 2.2%. Our US fair-yield estimate is 2.2%. The summation of these factors gives a fair yield for the SA R186 bond of 7.4%.
While the fair yield for SA bonds is 7.4%, political uncertainty is keeping foreigners from investing. In our view, the SARB is also resolutely keeping rates too high in order to compensate for the political risks that it is facing. This means that yields are unlikely to drift all the way down to their fair level in the near term. We are modelling on a fair yield of 8.00% for the purpose of this document. This gives us an expected return of 8.66% for the next twelve months, comprising of 8.10% interest income and 0.56% capital gains.
South African Listed Property
The property sector in SA remained volatile in 2Q19. However, 2019 has seen the sector’s performance stabilise to some extent – this year’s return is already 5.5% at the half-year mark.
It is worth focusing on a few factors that could dictate the path of the sector’s potential performance going forward. These include:
1. Dividend yield
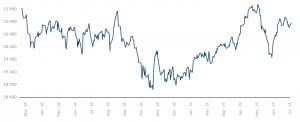
Despite the volatility, property is the top-performing sector in SA over a 10-year period. When we analyse what constitutes this return, distributions make up the lion’s share, with capital gain only accounting for 28%, or just over one quarter, of the total return.
Figure 2: The SA Property Index 10-year aggregate return
Source: Bloomberg, Anchor
The local market has been hard hit by the economic problems that pervade SA. Added to this, valuations of offshore property companies listed on the JSE have also come under significant pressure, particularly those that own retail/ shopping centre assets. In the UK, for example, falling income streams have meant that physical property valuations have come down. In addition, where companies are indebted to a higher-than-very-conservative level, they have been brutally punished as property valuations are adjusted downwards, net asset values (NAVs) fall and, in certain instances, bank covenants are breached.
Although this has not happened anywhere near the same extent in SA, there are nevertheless fears that physical property valuations are too high, and that the listed market is being “efficient” in pricing in falling net operating income and lower NAVs. This leads us to the next focus area:
2. Physical property valuations
A property’s value (and by extension a portfolio of properties) is estimated as the sum of the present value of a series of future cashflows generated by that property, discounted at an appropriate discount rate. This is consistent with the discounted cash flow (DCF) methodology of valuations. The discount rate is estimated based on the total rate of return expected by the market on alternative investments / asset classes with similar risk profiles. It is possible that, the total rate of return expected by the market has been distorted lower – leading to higher valuations – in the SA-listed real estate investment trust (REIT) market. The reasons for this include:
- REITs have been the marginal buyers of institutional quality income-producing properties over the past 5 years;
- but, more importantly, REITs (in general – but specifically those in the Resilient Group of companies’ stable) enjoyed a cost of capital advantage to their unlisted peers due to their demanding valuations i.e. lower yields.
- However, the point made above is no longer applicable having been “priced out” given the fall in listed share prices. It is also unlikely to return in the near-to medium-term.
It is therefore likely that SA property valuers have been too optimistic in their assumptions relating to:
- rental growth; and/ or
- not appropriately incorporating the necessary capital expenditure requirements (for the property to achieve rental growth in-line with market rental growth) in their valuations; and/ or
- using discount rates that are potentially still anchored to a period where REITs were the marginal buyers and enjoyed a substantial cost of capital advantage.
Property valuations and NAVs in SA are therefore likely to follow the European trend downward. One could therefore argue that the listed equities market has behaved (somewhat) rationally in anticipation of this by pricing many listed counters at a substantial discount to their NAVs.
3. SA property companies’ NAVs
Investors in SA have historically focused more on dividend yield than NAV. As shown earlier, this is what drives the total return from the sector over time. However, the trend in Europe and the rest of the world has been to evaluate property shares on a mix of NAV (equity like value) and dividend flow (coupon/ income-derived value), with a distinct leaning towards NAV over the past 12- to 18-month period.
An analysis of where SA stacks up, does show that physical and listed valuations have de-coupled and, as presented above, physical valuations will probably come down towards listed valuations. However, there does appear to be a lot of headroom to absorb this.
- 76% of the universe of 40 listed JSE property stocks trade at a discount to NAV.
- This proportion is the same for the SA Property Index ([JSAPY] where there are 21 stocks listed).
- The average discount at the index level is 14%.
- The highest premium is 12% (NEPI Rockcastle), whereas the highest discount is 60% (Accelerate Property Fund).
Conclusion
In order to try and predict the return range for the sector going forward, the documented issues need to be considered, and they are largely negative. Notwithstanding these, and their associated sentiment issues, we are of the view that the poor property fundamentals and “noise” is largely priced-in at these levels. We therefore maintain that this presents a safe entry point (for long-term investors) to gain/ increase exposure to the SA listed property sector. Our total return expectations for the listed property sector is c. 10.5% compounded p.a. over the long term.
The Rand
Projecting the rand’s value in a year’s time is a fool’s errand. The rand vs US dollar exchange rate is one of the world’s most volatile currency pairs and trades well away from any modelled fair value for long periods of time. We note, however, that the rand trades within a R2.50 range to the dollar in most 12-month periods.
We retain our purchasing power parity (PPP) based model for estimating the fair value of the rand and we have extended this out by three months since our last publication. Domestic inflation has been averaging about 4% to 4.5% of late and is likely to average about 4.8% for the next year. In response to SA’s more benign inflation outlook, we have adjusted the inflation differential with the rest of the world down to 3.0%. This has lowered our forecast for the rand somewhat.
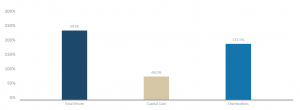
Our PPP-modelled value for the rand vs US dollar at the end of the next 12 months is R13.27/$1. We apply a R2.00 range around this to get a fair value range of R12.27-R14.27/$1.
It is reasonable to expect that, as a more positive EM environment develops (in response to lower global interest yields), we will see the rand move towards the mid-point of the range.
We note that the rand ended 2Q19 at R14.08/$1, which is within our fair-value range. Therefore, whilst we are positive on the prospects of the rand to recover a little further, the movements will remain random depending on both global and domestic events. For modelling purposes, we have used the R13.27/$1 mid-point of our range.
Figure 3: Actual rand/ US dollar exchange rate vs rand PPP model:
Source: Thomson Reuters
Global Equity Markets
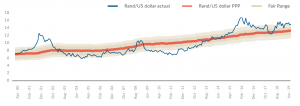
Global trade tensions have dominated global equity markets over the past 12 months. The resultant moderating of global growth prospects has seen market volatility increase. Market levels are back to those seen at the end of September 2018, with a 15% rebound YTD. We expect an 8% return from global equity markets over the next 12 months, which is in line with historic averages. The rand return is likely to be less positive, given our view that the rand will probably strengthen over the next 12 months. Figure 4 below shows the MSCI World Index over the past five years:
Figure 4: MSCI World Index, January 2014 to date
Source: Bloomberg, Anchor
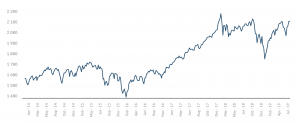
Despite the fact that this is one of the longest positive runs in global markets, dollar returns have been relatively muted and have lagged earnings growth. The MSCI World Index is up 4.2% over the past 12 months (vs the S&P 500’s 8.2% rise) and the compound return over the past five years is 4.6% p.a. (vs S&P 500’s 8.4% gain).
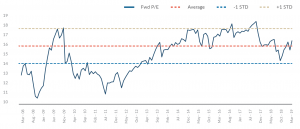
The MSCI World forward PE has oscillated either side of 16x for the past five years and is currently trading just above this level. Markets seem fairly priced assuming reasonable world economic growth. The risks to this have risen and hence our base-case return projection is moderate.
Figure 5: MSCI World fwd PE
Source: Bloomberg, Anchor
All eyes will be on earnings growth over the next 12 months. The jitters caused by trade tensions has seen confidence levels reduce and the consensus view is now for just over 3% world economic growth (from c. 4% a year ago). This downgrading of growth expectations saw markets decline in 4Q18, but most developed market (DM) central banks reacted by indicating that they are prepared to cut interest rates to stimulate growth. This has seen firmer markets this year. A positive resolution of the trade spats and a reasonable outcome could see a further bounce in markets.
The level of bullishness regarding global equity markets has retracted and individual exposure to the market is low by historic standards. However, analysts are fairly bullish about earnings (see Bloomberg consensus numbers in Figure 6 below) and if the 14% forecast earnings growth for the next 12 months for the S&P 500 Index materialises, our projected return could be exceeded. Average earnings growth over the past 10 and 20 years is in the region of 8%.
Figure 6: Global market metrics
Source: Bloomberg consensus
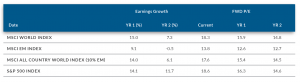
The one-year forward PE of 16.3x for the S&P 500 (and 15.9x for the World Index) is relatively undemanding and should underpin markets, in our view. Bond yields are back at levels of around 2% and borrowing costs are likely to be subdued for an extended period, making equities relatively attractive.
We favour the US market for equity exposure. The negative impact of a stronger dollar will work its way out of the system in coming months and there is strong growth momentum from the tech giants which, on average, generated 17% turnover growth in their recent results. Traditionally defensive shares such as utilities and tobacco companies have performed well in these market conditions, but their relative lack of growth has seen them lag. Trump has also latched his success to equity markets – claiming kudos for recovering markets – and he is likely to be market-friendly moving towards the November 2020 elections.
Europe has delivered a similar return to the US this year (16% vs 17%), but a lack of earnings growth in this region will make superior returns hard to achieve. The upside surprise could be the UK, where Brexit has restrained share prices.
EMs are trading at a 20% discount to DMs, although this has been the trend for the past decade. We like the tech space in EMs, where secular trends are relatively unaffected by tariffs. There is a reasonable chance that commodity prices will rollover towards the end of the year (as the current “perfect storm” reverses) and these are especially important for this segment of the market. All eyes will be on China’s ability to stimulate its economy as many metrics point downwards.
The risks in global equities have increased as global growth slows, but the actions of politicians and central bankers could spur markets further. While the economic expansion is long in the tooth (and the slow bull market continues), we would still maintain at least neutral exposure to global equities, especially given the relative unattractiveness of other asset classes.
Global Bond markets
2Q19 saw another escalation in the trade war between the US and China and, this time, central bankers began to agree with interest rate markets that perhaps it was time to start thinking about pre-emptive rate cuts. US Fed Chair Jerome Powell, suggested in early June that he was “ready to act” to sustain economic growth and the members of the FOMC seemed to agree, with 7 of the 17 thinking that it would be appropriate to cut rates twice this year and only 1 member believing that a hike would be appropriate. Just three months ago, six members were keen to hike rates this year and none thought cuts were likely. Across the pond, European Central Bank (ECB) Chairman Mario Draghi, whose 8-year term at the helm ends in October, said that many of the ECB members had raised the prospect of cutting rates further into negative territory in response to protectionism. The ECB also pledged not to raise rates at least through the first half of 2020 (well after Draghi leaves).
The interest rate markets are still well ahead of the FOMC members in terms of expectations for this year, with about two and a half cuts priced into fed funds futures and the average FOMC member expecting only an 80% chance of a single cut. The fed funds futures are the basis for our front-end rate forecasts and, with 6-month rate expectations having dropped 0.6% since our previous forecast (that’s the biggest quarterly change in 6-month rate expectations since the global financial crisis in 2008), its unsurprising that our 10-year yield forecast is also substantially lower. We’ve slightly increased the probability of the global economy deteriorating over the 12-month forecast horizon, but our base case remains that the Fed will cut rates and stabilise economic growth, normalising the yield curve. The probability weighted outcome leaves us with a US 10-year yield at 2.2% in twelve months for a total return of 0.4% in US dollar terms.
US investment-grade corporate bonds spreads are marginally tighter for the quarter, having rallied alongside risk assets in 2Q19, but we still feel that at this stage of the cycle its most likely that spreads drift wider. The combination of higher rates and wider spreads leaves us with a one-year total return expectation of about 1.0% in US dollar terms.
Global Property
2Q19 was lacklustre for global property with the FTSE/EPRA/Nareit Developed REIT Index up only 1%. In a quarter where global equities were up 4.2% and US 10-year bond yields fell 0.5%, this should have been the sweet spot for property stocks, but the global REIT index was held back by retail REITs (comfortably the largest sector at 23% of the index), which were down 5% in the quarter. The retail sector is still being held back by concerns around store closures and structural challenges as shoppers embrace online shopping. UK REITs were also 4.4% lower in the quarter as Brexit uncertainties put pressure on an already challenged sector.
Growth rates for global property income have started to slow recently and, while our expectations for global interest rates are now about 0.4% lower than they were a quarter ago and property yields have remained static in the face of falling interest rates, we see this subdued growth as a headwind to any potential re-rating. We thus expect a dividend yield of around 4.0% (growing at c. 2%) to deliver a total return of 6.0% over the next year. However, we note that this is highly contingent on how Brexit plays out (UK REITs account for c. 5% of the global index) and, more importantly, what happens in the retail property space (accounting for 23% of the index).