Global Backdrop
Global economic growth, in aggregate, has been robust for the past two years. Unfortunately, it is becoming apparent that this will not be sustained going forward. We had been expecting growth to normalise to lower levels, but regrettably actions by various politicians have meant that growth rates will slow down faster, and to a greater extent, than we had previously anticipated. At the forefront of this slower growth are three key events:
- The US government has effectively entered a shutdown due to the political battle between President Donald Trump and the majority House Democrats. This means that a number of US government offices and services are now closed until the situation is reversed. In effect, this is the opposite of the fiscal stimulus that we spoke about in our previous Strategy report and acts as a handbrake on US growth rates in the near term.
- The trade dispute between the US and China is also taking longer to resolve than we had originally hoped. As a result, both the US and China’s economies are being held back by a combination of uncertainty and slower global trade.
- The world has been waiting for Chinese stimulus in response to the damage sustained to the country’s economy on the back of the trade dispute. Recently, ratings agency Fitch stated that further debt-fueled stimulus could see China’s credit ratings getting cut. This is another possible sign that the scope for such stimulus is diminishing.
- Whilst we are talking about a slowing global economy, we do not anticipate a recession and instead we think that the US will see its growth rates normalise to just below 2.0% p.a. This should be enough to sustain markets and is actually reasonably bullish for emerging markets (EMs).
The South African (SA) economy disappointed us by dipping into a recession last year. However, we continue to see the green shoots of a recovery taking hold, despite a number of risks remaining – the 2019 general election and Eskom are at the forefront of investors’ minds. We expect that the local economy will continue on the current recovery path with a continued gradual improvement. Nevertheless, the recovery remains fragile and we are hopeful that a sensible election outcome will allow for the bold steps necessary to improve our economy.
South African Equities
The SA equity market owes investors some returns and if the stars align, 2019 could be the year for payback. Valuations are at attractive levels and there are three main determinants of our fortunes: if Trump acts rationally, Chinese stimulus materialises and the “Ramaphosa-recovery” continues, the market could deliver meaningful double-digit returns. The decisions politicians make can alter the potential outcome materially so, for the purpose of our mathematical tables, we have worked on a 16% return for 2019. This comprises of 12% earnings growth, a c4% dividend yield and a slight rerating of the market multiples from 11.9x towards 12.0x, which is still below historical averages. There is a large dispersion of possible outcomes and, if the various scenarios (both locally and internationally) all turn out positively, there is significant upside optionality and the market could well deliver in excess of 25% returns.
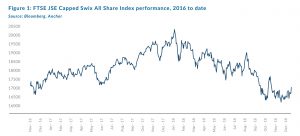
The JSE Capped Swix Index declined by 10.9% in 2018, which is particularly painful because over a four-year period it has produced a paltry annualised total return of 3.8%. The index currently trades at a forward multiple of 11.9x – well below its 10-year mean of 12.9x. We expect earnings growth in excess of 12% on the JSE this year, which might seem high given the tough economic conditions, but this is partly due to the make-up of the index, which we will explain later.
Valuations are cheap, aggregate earnings growth is solid and global markets have sold off fairly dramatically. These are all favourable factors for a stock market recovery.
In order to understand the JSE one needs to understand the constituents and their relative weightings. We think Figure 2 below is a good way to view the market.
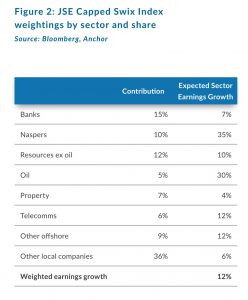
The weighting of Naspers is higher in the All Share Index (roughly double the 10% in Figure 2), but the market norm is to use the Capped Swix Index, which limits any one share to a maximum weight of 10%. What one can see from Figure 2 is that there are numerous drivers of market performance and local economic performance only accounts for about half of that.
The earnings growth broken down by sector arrives at a surprisingly high number given the poor local economic conditions. High projected growth numbers from Naspers and Sasol are the biggest drivers and these are relatively unrelated to local conditions, as are resource company earnings, which will be assisted by a weaker average rand vs US dollar exchange rate in 2019, compared to 2018. This impact is also felt in the offshore company earnings translated into rand. The 34% “rump” of local company earnings (retailers, industrials etc.) are projected to grow at a far more subdued 6% p.a., along with banks who will battle to grow by more than nominal GDP in the current environment. Property companies have the lowest projected growth rate as negative lease reversions (on renewal) subtract from the base of contractual lease escalations.
The performance of the local market will primarily be influenced by the following (in order of importance):
The global growth outlook and the performance of global equity markets:
After a sharp drop in 2018, we believe the market is factoring in an overly negative expectation of 2019 global economic growth. We think global growth of over 3.5% and US earnings growth of around 6% is feasible. This should see a positive return from global markets. In a positive environment, EMs could well outperform developed markets (DMs).
The SA general election and its political outcome:
Conditions remain tough in SA and the path to recovery is a delicate one. SA desperately needs the “Ramaphosa-recovery” plan to be sustained to realise the country’s economic potential. This is our base case and GDP growth should accelerate in 2019, albeit off a low base. It’s all about confidence levels and if these improve the prospects for growth are good. To the contrary, if SA reverses course, the outcome would be calamitous and share selection would shift dramatically away from domestic counters. Political rhetoric is likely to dominate the headlines for the next few months, leading up to the election. Our base-case expectation is for the ANC to win the election with a sufficient margin to empower Ramaphosa to continue on his reform path.
US–Chinese trade negotiations and Chinese economic stimulus:
Trade negotiations are underway and a reasonable outcome, which does not overly restrict global trade or put pressure on Chinese growth, is an important factor for the year. Following this, the extent of Chinese stimulus will be key as the resource sector relies heavily on sustained Chinese demand. Our base case is a positive outcome on both counts.
The rand/US dollar exchange rate:
This is impossible to forecast with high levels of confidence, but with purchasing power parity heading for around R13.55/$1 by the end of 2019, we think a rand around current levels is a reasonable base case. This will be fairly neutral for the SA market. The average for 2018 was R13.30/$1, so there is already a positive earnings driver in 2019 for companies with offshore earnings.
Chinese gaming approvals:
The stall in gaming approvals last year had a devastating effect on Tencent and, consequently, on Naspers. However, gaming approvals in China appear to have re-started and the market will be following Tencent approvals closely in the short term.
Then there’s always the additional list of worries:
Brexit is a headache and oil is always a factor (higher prices are good for oil companies, lower prices are good for inflation and growth potential), Italian debt levels and growth is also an issue.
It is worth reflecting on 2018, which was a year dominated by bombs. 12 Top-40 SA companies declined by over 25%, many for reasons which were company specific and unrelated to normal macro-economic factors. These companies account for the majority of the decline in the market in 2018. This is shown in Figure 3 on the following page.
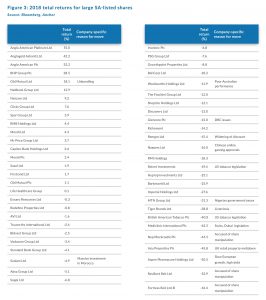
What Figure 3 above reveals is that, at a level below the index, there are many shares that have plummeted and offer attractive entry points. Of the shares with large declines in the table above, Aspen, MTN, Rand Merchant Investment Holdings (RMI), Naspers and Discovery look enticing to us.
2019 is not without its risks in SA, but if we can sustain the current path and global markets play ball then the outcome could be positive and 2019 could be the year to get equity returns back on track. Investors should recall the 50%-plus rise in domestic counters in December 2017/January 2018 when confidence peaked. This is the optionality that exists in markets and the reason to stay invested over time. As always, we will be navigating with caution, alert to changes in the outlook.
South African Bonds
The bond market started 2019 on a better footing than last year. The yield on the R186 stood at 8.95% at the beginning of January 2019 compared to 8.60% at the start of 2018. Overall, the bond market sold-off by just over 0.3% in 2018, with the R186 ending the year at 8.95%, having stretched to highs of 9.38% and lows of 7.89%.
Most of the volatility in 2018 can be attributed to both global factors that affected EMs in general and specific domestic factors. The US-China trade war saga dominated headlines which led to risk-off sentiment and a widening of credit spreads, while global interest rates, particularly those in the US, continued to rise, increasing EM risk premiums and reducing investor appetite for EM assets. This led to the EM asset class, including SA bonds, having to absorb the brunt of the price decline.
On the local front, we saw the SA economy entering a technical recession in 1H18, which triggered a sell-off in the bond market. The downturn in the SA economy coincided with economic stability in other EM economies, such as Turkey and Argentina, exacerbating the oversold position in SA bonds.
While we expect this volatility to continue during the course of 2019, we believe it will be in favour of EM assets with the SA markets benefitting. We expect the trajectory of global growth and global policy decisions to be the primary factors to stir the SA bond market in 2019, while local inflation expectations, the pace of the SA Reserve Bank’s (SARB’s) rate-hiking cycle and stability of the current account deficit will be secondary factors to impact the SA bond market.
On the local front, inflation and the fiscal deficit continue to be the major causes for concern on the bond market. The major risk to the inflation trajectory is rising electricity tariffs and food inflation. We expect inflation to remain within the 3%-6% band for 2019 averaging 5.3%, while reaching the higher end of the spectrum during 1H19, with at least one interest rate hike assumed for 2019.
We further expect rating agencies to take centre stage in 2019, particularly if there are no signs of improvement in the fiscal deficit following the budget speech and the election. Taking into consideration the aforementioned factors, our fair-value models continue to show the SA benchmark bond at 8.75%. The fair-value model assumes a fair value for the US bond of 3%, inflation differential between the US (2.2%) and SA (5.7%) of 3.5% and the credit default swap (CDS) spread of 2.25%. Given our fair value for SA bonds, we expect a twelve-month return of 10% in bonds that is comprised of 8.95% interest carry and 1.05% capital gains.
South African Listed Property
For the SA listed property sector, 2018 was a year to forget. But, as we look forward to 2019 and pick up the pieces, the events and themes of the past 12 months are important components in helping navigate the asset class and forecasting returns with some measure of confidence.
The magnitude of this rebasing and derating is dramatic and helps to frame the outlook going forward. In retrospect, the major factors at play were:
- The media reports around the Resilient stable which at the beginning of 2018 accounted for 42% of the benchmark index.
- South African consumers were under intense pressure, retailers suffered as a result and the dynamic changed between landlord and tenant as property companies had to start cutting deals to keep vacancies down.
- Forecast growth in distributions payable were therefore revised downward quite sharply. This “fuel supply” to the sector, which investors were always willing to effectively capitalise on in advance, fell off a cliff as confidence was lost.
This meant that the new, and higher, yields that the companies were trading at across the board did not allow equity to be raised, further impinging growth prospects in a “unvirtuous” cycle.
As we look forward, property fundamentals will become more important. The most critical of these will be the confidence in forecasting distributions that property companies can pay on a sustainable basis going forward. Our best one-year forecast suggests that the forward yield available to investors at the benchmark level will be 9.6%. This is 0.7% higher than the yield on the 10-year SA Government Bond and a level that has not been seen for many years (since the early 2000s). This yield is still forecast to grow, although at a level that is around the forecast inflation rate of 5%, and not the growth rates of 7%-9% to which the sector had become accustomed.
Further, within the overall “benchmark” picture, it is important to note that yields and growth rates vary considerably, and the dispersion is mostly caused by specific factors that relate to certain companies. So, while for example it is possible that local companies Arrowhead, Rebosis, Delta, Texton and Accelerate will all yield over 15%, there is forecast risk to this based on stock-specific circumstances. It is also possible that the calculated 12M distributions may not grow for 2-3 years. Offshore focused property companies like MAS Real Estate and Nepi Rockcastle on the other hand have lower yields (around 7.5%) but greater growth prospects in their chosen geographies, specifically Eastern Europe.
A conclusion and asset allocation to the sector has to be based on the return prospects available within the environment in which the asset class operates. With many factors to choose from we highlight what we believe to be the two most important ones below:
- The de-rating in the listed sector has made yields more attractive than income alternatives such as government bonds.
- There has been a large dislocation between the cap rates where physical property is being valued in SA and where yields are on listed counters. We believe this situation will normalise over the next 2–3 years and will gravitate towards physical yields of 8%-10%.
For the next 12 months we use the benchmark yield of 9.6%, the forecast growth rate of 4.5%, which we believe investors will pay for as confidence increases. Our overall forecast return is therefore 12%–14%. Because of risk factors and potential outflows from the sector after a poor 2018 we remain at a neutral weight.
The Rand
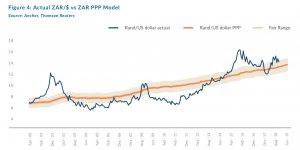
Projecting the rand’s value in a year’s time is a fool’s errand. The rand vs US dollar exchange rate is one of the world’s most volatile currency pairs and trades well away from any modelled fair value for long periods of time. We note, however, that the rand trades within a R2.50 range to the dollar in most 12-month periods.
We retain our purchasing power parity (PPP) based model for estimating the fair value of the rand and we have merely extended this out by three months since our last publication. Our PPP-modelled value for the rand vs US dollar at the end of the next 12 months is R13.55/$1. We apply a R2.00 range around this to get a fair value range of R12.55-R14.55/$1.
In the context of an improving EM scenario, we would realistically expect the rand to drift towards the middle of the range.
We note that the rand ended last year at R14.35/$1, which is within our fair-value range. Therefore, whilst we are positive on the prospects of the rand to recover a little further, the movements might well be muted until we see a dramatic improvement in global EM sentiment. For modelling purposes, we have used the R13.55/$1 midpoint of our range.
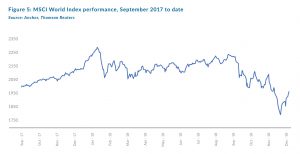
Global equity markets
We believe that global equity markets are pricing in a more negative economic scenario than is likely to materialise.After a c. 14% drop in the MSCI World Index in 4Q18, this index delivered a negative 9% US dollar-denominated total return for last year. With a lower base set for 2019, we expect attractive returns from global equity markets for the New Year.
Giving percentage projections for arbitrary calendar periods is an exercise in futility, but for what it is worth we think a 10%-15% US dollar total return for 2019 is possible. This is similar to the consensus view of the global investment houses, most of whom were caught off guard by a distressing 9% drop in the S&P 500 in December – its worst month in ten years. In a specific time period, returns could vary markedly from these numbers, but what we do know is that we are able to identify a portfolio of attractively priced, high-quality growth shares that are worth owning over time.
Historically, a reasonable expectation of US dollar equity total returns over time was in the region of 8%. It is interesting to note that total returns from the S&P over the past four years have only been around 5.5%. This implies that the market has not become euphoric and the current bull market, albeit long in duration, has seldom taken shares well beyond fundamental values. This has made it more sustainable than in the past.
Global growth prospects and the related policy responses from central banks are typically the biggest driver of stock markets. While growth is likely to slow in 2019, we still believe a +/-3.5% GDP growth rate in 2019 is sufficient to drive reasonable equity earnings growth, yet market behaviour seems to suggest a far worse outcome. We think they are out of kilter, presenting an opportunity.
We have outlined a few factors below which we believe will dictate equity market returns in 2019.
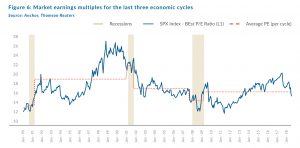
Valuations
After a year of negative returns accompanied by positive earnings growth, markets are dramatically cheaper than they were this time last year. The extent of the derating varies across the different markets but US markets, as an example, have seen their rating drop by around 30% (-5% return and 25% earnings growth). Although one could argue that the market was expensive a year ago (with a lot of the earnings growth “once-off” in nature due to Trump’s tax cuts), expectations for 2019 are still for positive US earnings growth of around 6%. This implies a 12-month forward P/E multiple of 14.6x, which is the cheapest in six years.
US Economic Growth
There are varied views regarding the growth outlook for 2019 and it is certain to slow from 2018’s sugar-rush 3.1% growth. Growth is likely to be just under the 2% level – which is probably the medium-term sustainable growth rate. We certainly do not expect the US to go into a recession in 2019. This level of growth is sufficient to sustain reasonable equity market returns.
For now, all evidence points to an economy that is in very good shape and the longer that continues, the more supportive it should prove for equity market valuations.
US Interest Rates
The US Federal Reserve (Fed) has changed its message recently, indicating it is willing to be more accommodative if economic growth slows. Inflation has also continued to remain moderate and the decline in oil prices will assist this metric. Our expectation is that the Fed will hike once or twice more (25bps each time) in the year ahead but, based on slowing economic growth, it will then pause and wait for further signs from the economy. Historically, this has led to a weakening of the US dollar which has been generally positive for risk assets and particularly EMs. While the backdrop for EM investors was ghastly last year, the stars could well be aligning for an environment where EMs leads the charge.
Trade wars
Undoubtedly, the escalation of trade wars throughout last year has weighed on investor risk appetite and for good cause – recent data out of China has shown a marked slowdown in economic growth, which is largely being attributed to uncertainty around trade. As the second-biggest economy in the world and having contributed roughly 50% of global growth after the global financial crisis (GFC), China is crucial to the global growth outlook. With trade talks between the US and China currently underway, we believe that sanity will prevail. This would come as a welcome relief and should be a major boost to equity markets around the world. Once again, EMs are likely to benefit the most from this outcome.
Eurozone
The eurozone has been, and remains, somewhat of a basket case over the past five years. Any sign of positive economic growth has been overshadowed by the populist rhetoric that has emerged from certain countries in the region. The latest to join the fray halfway through last year was Italy and, unlike Greece a few years before, the Italian economy is the fourth largest in the zone so any stress to its balance sheet could well send shockwaves across the region.
Outside of this, Brexit is an ongoing saga and two-and-a-half years on it seems as though we are neither closer to knowing what the outcome of Brexit is likely to be, nor the ramifications thereof.
Conclusion
2018 put most investors in a bad mood and levels of anxiety are high. However, global markets are around 30% cheaper than they were a year ago and many of the headwinds are capable of being addressed by political leaders. We believe it would be in their interests to act in a manner that would be positive for reasonable economic growth. In our view, markets are acting with extreme risk aversion and are discounting an outcome worse than what will materialise. The prospects for a positive 2019 have improved given the sell-off in the last quarter of 2018. EMs could outperform in this scenario and this will be positive for SA. Current conditions are conducive to volatility, but we believe that investors who keep calm heads and stay invested through 2019 should be rewarded with meaningful returns.
Global bonds
Over the course of the fourth quarter of 2018, financial markets changed their view on the future path of US interest rates. In September 2018 markets were pricing in expectations of two interest rate hikes in 2019 (both in the second half of the year). However, by the end of December that expectation was much closer to no hikes in 2019. Also, over the course of the last quarter, US 10-year bond yields dropped about 0.4% as a flight-to-quality pushed yields lower. All this has resulted in a significant flattening in the US yield curve. Based on expectations of no rate hikes during 2019 and a term premium of around 0.4% at this stage of the cycle, we come to a fair yield on US 10-year bonds of around 2.8%.
As a sanity check, we take a two-pronged approached to forecasting bond yields. The second approach uses inflation as a key input given the significance of that variable in determining interest rates. Forecasting the path of inflation is tricky, but we find the most reliable forecast to be a combination of the current inflation rate (inflation tends to be sticky) and the aggregate of professional forecasters. That combination suggests 2.3% inflation in the US for 2019. Investors, during this most recent cycle, have demanded a real return (i.e. return in excess of inflation) of around 1% to buy US 10-year bonds during the quantitative easing (QE) era, giving us a 3.3% fair value based on that model.
In aggregate, the two models suggest a fair value US 10-year bond yield of 3%, implying a total return for US 10-year government bond investors of 0.6% in US dollar terms in 2019. For corporate bonds, we’ve seen a meaningful increase in credit spreads over the course of 2018 – investment grade bond spreads rose about 0.65% during the year, as concerns mounted about the health of corporate balance sheets. We think it’s reasonable to assume that those spreads continue to drift higher, though perhaps not as aggressively, leading us to a return expectation for US investment-grade corporate bonds of around 1% for the year.
Risks to our forecasts come from a sharper-than-anticipated unwind of QE, which would likely lead to a very negative outcome for bonds. A faster-than-expected deterioration of global growth would also likely lead to an inversion of the yield curve, which would result in a very positive outcome for bond investors.
Global property
Global real estate investment trusts (REITs) weren’t spared in the year-end sell-off and the FTSE/EPRA/NAREIT Index of DM REITs ended the year down around 5%, despite YoY dividend growth of c. 8%. The forward dividend yield on that index (at 4.4%) is now as high as it’s been since the GFC. We had previously suggested that a forward yield of around 4.3% seemed fair given the growth prospects for global REITs and the challenges still facing one of the largest sectors (retail).
The derating in REITs was fairly concentrated. In the US, most sectors fared well and it was really only hotel and resort REITs that sold off meaningfully over concerns of reduced corporate spending. Outside the US, the biggest drawdowns were in Europe and the UK, with the worst returns coming from the retail REITs. In the UK, retail REITs have major challenges – Intu’s price collapsed after a consortium of potential suitors withdrew their bid; UK malls still seem slightly behind the curve in adjusting to the challenges from online retail; and Brexit uncertainty continues to linger in the background. UK issues also impacted European REITs. Europe’s largest REIT, Unibail-Rodamco-Westfield, exposed itself to UK retail through its recent transaction to purchase Westfield’s assets.
The spread between US 10-year bond yields and REIT dividend yields is as wide as it’s been in over two years, although we think a slightly higher 10-year bond yield will help to bring that down. So, with valuations around levels we feel are appropriate, we believe a reasonable total return expectation from global REITs is 9.3% in US dollar terms, made up of 4.3% in yield and 5% in earnings growth.