ECONOMICS
As we enter the final quarter of 2024, global interest rates have finally begun the long-anticipated cutting cycle, marking a significant shift in monetary policy for major developed economies like the US, the eurozone, and the UK. This trend has extended to SA and other developing nations. With the global bias shifting toward easing, the US Federal Reserve (Fed) joined other major central banks in loosening policy. Speculation had been building that the Fed might start with a larger-than-usual cut, and this was confirmed in September when the Fed surprised economists with a 50-bp reduction in the federal funds rate to 4.75%-5.00%. The Fed’s long-term neutral rate estimate remains just under 3%, suggesting room for further cuts of 1.75%-2.00%. We view current market pricing expectations for rates as somewhat aggressive, potentially overestimating the implications of the Fed’s 50-bp cut. Nonetheless, we expect US rate trends to be a key driver of market sentiment in the coming months.
Moving to Europe, the European Central Bank (ECB) has already cut rates twice this year, lowering the deposit rate to 3.50%, and we anticipate gradual policy easing through 2025, with rates settling at 2.00%. However, the risks seem skewed toward a faster pace of cuts, possibly taking rates below neutral due to increasing downside risks to growth. In contrast to most developed markets (DMs), the UK’s interest rate trajectory is an outlier after the Bank of England’s (BoE) latest rate decision. In the same month that saw the US, ECB, and SA cut rates, the BoE held rates steady at 5%. This cautious decision reflects the BoE’s less favourable position on inflation compared to the Fed. The UK’s economic landscape suggests a more measured approach rather than rushing towards a neutral policy stance.
It is important to remember that the softening global economic backdrop is not solely due to restrictive monetary policy. Manufacturing, especially in the eurozone, has yet to recover, with purchasing managers indices (PMIs) staying below 50 for over a year, signalling contraction. Moreover, global manufacturing PMIs suggest a faltering recovery, with sub-indices pointing to further weakness. While supply chain pressures persist, much of the manufacturing slump can be attributed to China’s economic struggles, where domestic demand remains weak.
Looking specifically at China, the end of 3Q24 saw Chinese authorities introduce a comprehensive stimulus package aimed at reviving its sluggish economy. While increased stimulus had been anticipated to counter sluggish growth, the measures introduced so far had been underwhelming. However, this latest round of intervention exceeded most expectations in its scale. As part of the stimulus measure, the People’s Bank of China (PBoC) announced a major liquidity injection to stabilise markets and boost investor confidence. Central to this is a CNY800bn (c. US$113bn) programme to support the equity market and plans for a market stabilisation fund. About half of the fiscal issuance targets consumption growth through new policies, such as a monthly CNY800 allowance per additional child for families and financial bailouts for local governments. Additional measures, including rate cuts, were introduced to support the struggling property market. The government also pledged to ensure spending the necessary to meet its 2024 5% growth target, with more fiscal package details expected ahead. The question remains whether these measures will be targeted enough to address the deep, structural issues in the property sector in particular and the greater Chinese economy. For now, however, global markets have responded positively to the announcements.
Geopolitical tensions are expected to remain a key focus through 2024, with no resolution in sight for the Russia-Ukraine or Israel-Gaza conflicts and risks of further escalation, particularly within the Middle East. The November US presidential election is also being closely monitored, with ex-President Donald Trump and Vice President Kamala Harris actively campaigning. A Republican win could significantly impact global macroeconomics and trade policies, particularly with the potential return of Trump’s protectionist agenda. However, financial markets remain largely unaffected, focusing more on anticipated monetary policy changes than fiscal ones. Given the close polling, the election outcome remains highly uncertain.
Moving locally, unlike the Fed’s faster pace, the SA Reserve Bank (SARB) prefers a gradual, data-driven approach to rate cuts. In its September meeting, the SARB reduced the repo rate by 25 bps to 8% p.a., lowering the prime lending rate to 11.5%. The SARB’s Monetary Policy Committee (MPC) considered leaving rates unchanged, a 25-bp cut, and a 50-bp cut, ultimately choosing the more cautious 25-bp option to ensure a smooth transition toward lower inflation. This gradual approach helps manage expectations and maintain market stability. Looking ahead, the SARB projects rates will stabilise slightly above 7% next year. As a result, the market appears to anticipate a gradual cutting cycle, with no cuts larger than 25 bps per meeting. Subsequently, we expect 100-125 bps of cuts in this cycle. Any deviation from this would only occur in response to significant changes in inflation, growth, or employment data.
We align with the SARB’s GDP growth forecast of 1.1% YoY for 2024 and 1.5% YoY for 2025. The government has made significant progress on reforms, including lifting energy generation license thresholds, auctioning the telecommunications spectrum for 5G, improving rail and port efficiency through the Transnet Recovery Plan, and reducing water-use license processing times. Recent changes to immigration regulations also aim to attract scarce international skills. These reforms foster a more favourable business environment conducive to boosting growth. If economic reforms are implemented faster and private sector engagement increases, our baseline scenario could be upwardly revised. Business and consumer confidence metrics will be key to watch in this regard. Moreover, growing confidence in the durability of the SARB is bolstering SA’s market buoyancy.
SA EQUITIES
South African equities delivered a strong 3Q24 in both absolute and relative terms. The FTSE/JSE Capped Swix, the most widely used benchmark by local investors, delivered a 3Q24 return of 9.6%, bringing its YTD total return to 15.9%. However, when measuring how the JSE is performing against global benchmarks, we typically look at the MSCI SA Index, which quotes the performance of the market in US dollar terms, making comparisons to other markets more relevant. On this basis, the MSCI SA Index was up 16.1% in 3Q24, bringing the YTD total gain to 21.8%. This is in the context of global equities (MSCI World) rising by 19.3% YTD and EM equities (MSCI Emerging Markets) being 17.1% higher. Despite the recent relative outperformance of SA equities, we maintain our overweight house view and asset allocation to domestic equities with an expected total return of 14% for the MSCI SA Index and a 15% return for the Capped Swix.
Arguably, the most pleasing aspect of the JSE’s recent outperformance has been the continued strength in domestically focussed sectors of the local market (the so-called SA Inc. shares), no doubt sparked by the increased positive sentiment towards SA following the formation of the GNU in June. In The Navigator: Anchor’s Strategy and Asset Allocation, 2Q24, dated 17 April, we argued that 2Q24 provided investors with a great entry point into a deeply undervalued and under-owned local equity market. We expected that an incident-free national election (our base case) and lower loadshedding and interest rates would provide some cyclical tailwinds for JSE-listed equities. Three months later, in The Navigator: Anchor’s Strategy and Asset Allocation, 3Q24, dated 15 July, with the outcome of the election far more positive than we had expected, we put forward the argument that not only do the cyclical tailwinds remain in place but suddenly, there is a far greater chance that the GNU will push forward much needed structural reforms.
With earnings bases incredibly low (after ten years of below-trend GDP growth) and risk premiums at an all-time high for South African assets – the set-up for local equities was extremely healthy. Adding further fuel to our constructive stance on local equities is the starting point of valuation and earnings bases relative to global equities. SA finds itself at a cyclical low on earnings and valuation. In contrast, the opposite holds true for global equities, reinforcing our view that, relative to global equities, the MSCI SA Index and local bonds will continue to outperform, and the rand will continue to strengthen.
As mentioned, for the first time in years, most of the JSE’s recent strength has come from the domestically focussed sectors of the market. The FTSE/JSE SA Banks Index, which accounts for roughly 25% of the MSCI SA Index, is up 32% since the elections at the end of May. The bulk of that performance (29%) has come in multiple expansions, with the index moving from a forward P/E ratio of 7.8x before the election to the current 10x. However, this multiple expansion seems reasonable as bonds have also experienced a strong run from very depressed levels (12.5% down to 10.3% on the SA 10-year government bond). This is a familiar trend we have seen across many sectors, and it is ultimately a compression of the risk premium on South African assets, driving a valuation uplift across the board.
The question then becomes, where do we go from here? Multiple catalysts have driven this risk premium compression, expectations of a brighter future are increasing, and the starting point heading into the next 12 months looks very different to that of even three months ago. It should be noted that making a call on local equities 12 months out is more uncomfortable than three months ago. Nevertheless, we remain bullish on the ingredients being in place to entrench a domestic earnings cycle that will drive continued outperformance of the MSCI SA Index. Still, we concede that from these levels, an earnings cycle is needed, and most likely a robust one, as some front-loading of expectations has no doubt already taken place.
Our constructive stance on local equities is premised on raised GDP growth expectations and earnings delivered 12 months out, beating the current consensus forecasts. We believe the nascent trend of raising growth expectations will continue into 1Q25, and in particular, the December trading for most consumer-facing businesses is expected to be very positive. Domestic consumers have been under immense pressure since before the onset of the COVID-19 pandemic, and this will be the first festive season trading period where conditions for the consumer will be more forgiving than the previous. With another interest rate cut on the horizon before December, loadshedding largely an issue of the past, lower fuel prices, inflation moderating and the added benefit of changes in pension regulations allowing the consumer to access a portion of their retirement savings early, the set up going into the December trading period looks extremely positive.
At Anchor, our approach following the announcement of the GNU has been to earmark a list of mid-cap companies positively geared to improved consumer conditions and to regularly engage with their management teams for early signs that the SA operating environment is improving. The initial response from over 40 management meetings was that it is too early to tell whether the GNU has had an impact; however, as each month passes, we have already sensed a change in tone. Management teams and investors will likely want to err on the side of caution when building up expectations too much. However, we are cautiously optimistic that twelve months out, the earnings outcome will be better than the current set of expectations built into the valuations and stock prices, with the added caveat that for this to succeed, the GNU needs to deliver growth with the honeymoon period now firmly over.
SA LISTED PROPERTY
September saw the SA-listed property sector continuing its extraordinary rally of the past year, during which the FTSE JSE SA Listed Property Index (SAPY) recorded a total return of 51.3%, buoyed by supportive company results and lower bond yields. With office and retail property’s key performance indicators (KPIs) continuing to improve, funding costs starting to peak, reported book values finding support from these factors and the sector trading at a 20% discount to book value, we remain constructive about the sector. Our 12-month forward, total return projection for the sector is 10%, which comprises a slight capital increase in addition to the 8% dividend yield.
Property fundamentals appear to have bottomed a few months ago, and vacancy levels are shrinking. Office property has long-term oversupply issues, but negative lease reversions in the sector have declined sharply as a full rent cycle has almost worked its way through post-COVID-19. So, net portfolio growth is starting to return, and the interest cost will begin to decline towards the second half of 2024 (unless, like Growthpoint, hedging has delayed this positive impact). Offshore portfolios are performing better, and growth prospects look reasonable. A reasonable portfolio with a dividend yield of 7%-9% and growth of 3%-5% can be constructed.
Our top pick of the property sector is MAS PLC. The share price took a dive when the company announced it would hold back on dividends for two years to fund developments. However, at a 15% forward distributable income yield, we think the share is worth over 50% more than it currently trades.
DOMESTIC BONDS
SA Government Bonds (SAGBs) continued 2Q24’s robust returns in 3Q24, with this past quarter recording a 10.6% return at the SA All Bond Index (ALBI) level. This has resulted in an ALBI YTD return of 16.74%. Duration has been strongly rewarded with the curve flattening and lowering on an absolute level in anticipation of interest rate cuts.
The first of these cuts arrived at the September SARB Monetary Policy Committee (MPC) meeting, where the repo rate was lowered by 25 bps. Current market expectations are for inflation, as measured by the Consumer Price Index (CPI), to moderate even further (the most recent CPI print of 4.4% is already slightly below the mid-point of the SARB’s target band) towards the bottom of the band, which will drive more rate cuts over the medium term. Market expectations are for the repo rate to bottom out towards 4Q25/1Q26 at 6.75%-7%.
The US Fed opened its rate-cutting cycle with a 50-bp cut, and current market expectations are for the federal funds rate to reach a terminal level of 2.75%-3.25%. This outlook implies a more robust rate-cutting cycle in the US than in SA, which will likely be further rand and SAGB supportive.
Thus, we remain overweight SAGBs with a positive outlook on duration assets, driven by the following factors:
- As the central bank rate differential between the Fed and SARB increases, the SAGB carry trade, which involves borrowing in a currency with a low interest rate and investing in a currency or financial product with a higher return or interest rate, becomes increasingly attractive.
- With CPI moderating downwards, the SARB MPC has headroom to cut rates.
- The GNU has withstood the early challenges and remains resilient at a national level – the medium-term outlook is thus for stable coalition governance.
- Key state-owned enterprises (SOEs) are showing signs of reform and improvement. At the same time, loadshedding has been a non-factor since May 2024, and Eskom’s energy availability factor (EAF) has also improved YoY.
- Global sentiment, off the back of the above positivity and factors, is providing strong momentum that is supportive of SA assets in general and SAGBs specifically.
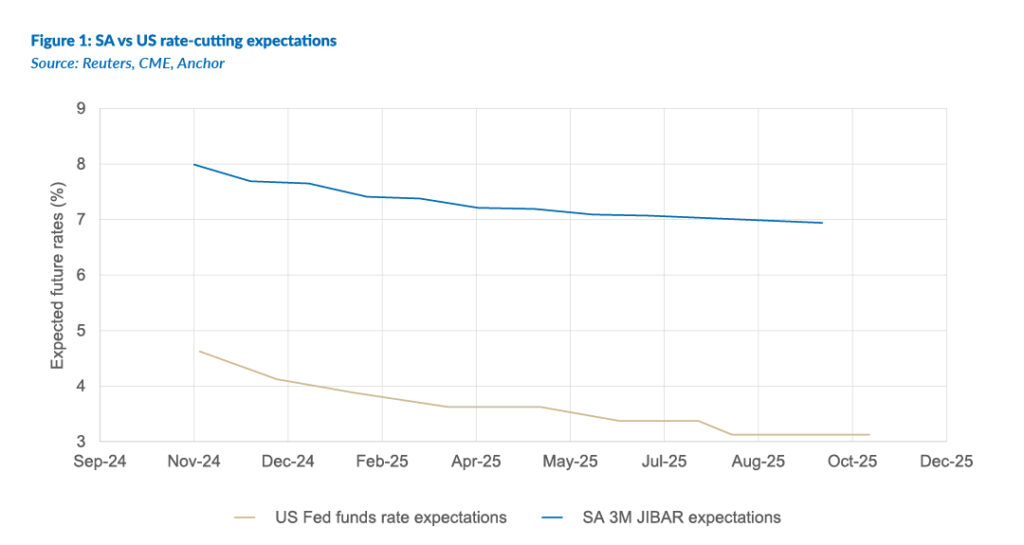
As per Figure 1 above, the rate-cutting pace expected in the US is meaningfully faster than in SA. This increase in the differential between SA and US rates will make SA comparatively more attractive as a destination for capital.
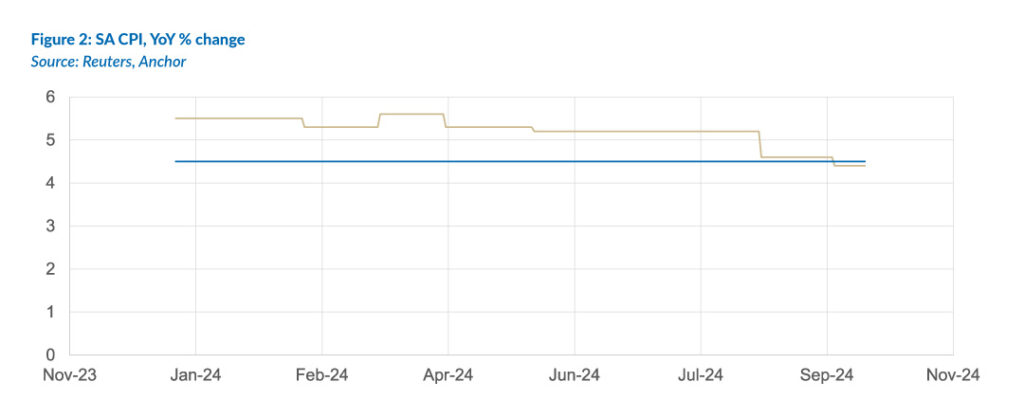
Figure 2 above shows that CPI has moderated significantly. With expectations for a further moderation lower in inflation, the SARB’s MPC has headroom to justifiably cut rates without undue concern for excessive price instability.
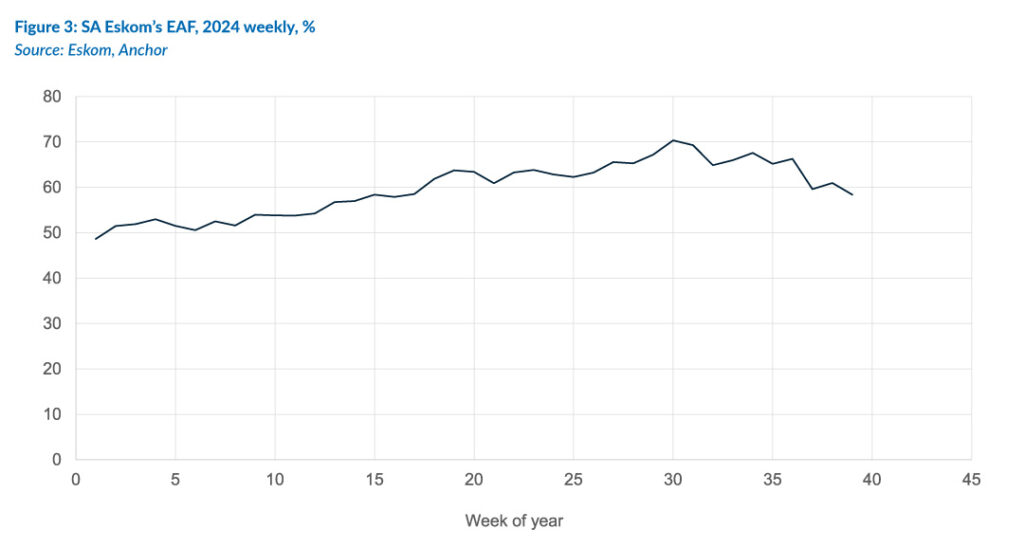
Eskom’s EAF (see Figure 3) has been on a consistent upward trend, with loadshedding drastically reduced from 2023 to 2024. This points to a slow improvement in the quality and reliability of key SOEs, a result of the ongoing reform agenda pursued by the national government.
Thus, we retain a slight tilt toward duration assets, with attractive yields on offer (at an index level, the yield remains over 10%) and additional potential for capital accumulation.
THE RAND
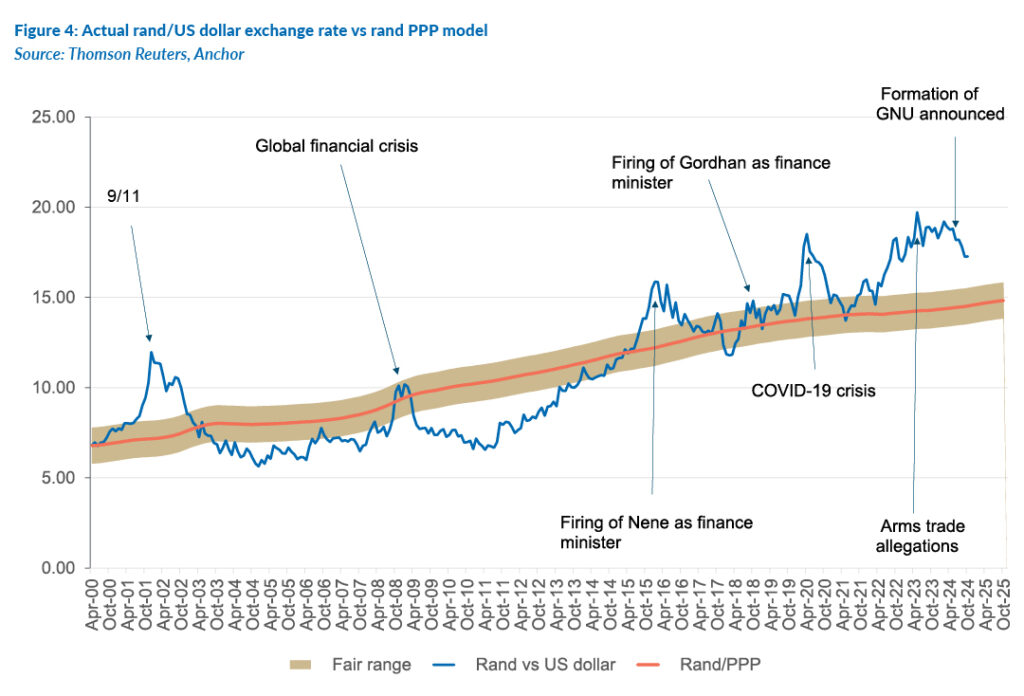
The rand strengthened during 3Q24 as investors took a positive view on the outcome of the SA elections, and the US Fed’s 0.5% rate cut saw the dollar lose some strength. We also note that SA’s trade balance has remained positive, which is broadly supportive of the rand. We had expected the rand to average around R18.05/US$1 for much of 3Q24, which appears to have underestimated the rand strength. Looking forward, we think the rand’s prospects will continue to improve, and we see it trading in the R16.50-R17.50/US$1 range for 4Q24 and into 2025.
Projecting the rand’s value in a year’s time is a fool’s errand. This is because the rand vs US dollar exchange rate is one of the world’s most volatile currency pairs and trades well away from any modelled fair value for long periods. We highlight, however, that the rand trades within a R2.50 range to the US dollar in most 12-month periods.
South African reforms appear to be taking hold with the GNU holding and seeming to deliver some early benefits. We expect this to continue. The trade balance remains positive, while the recent gargantuan stimulus package announced in China is EM-positive and should support the local unit. We expect that the US will cut rates further and faster than the SARB, which will make the carry trade more attractive and also cause some US dollar weakness on a global scale. Overall, most factors are stacked in favour of the rand, and we are calling for the domestic currency to trade at R16.20/US$1 in one year’s time.
Perhaps the only storm cloud for risk assets is the fractious geopolitical environment with regional wars flaring up in the Middle East. We expect that bouts of risk-off sentiment in financial markets might see periods of rand weakness.
We retain our purchasing power parity (PPP) based model to estimate the rand’s fair value. We have extended this out by three months since The Navigator – Anchor’s Strategy and Asset Allocation, 3Q24 report was published on 15 July 2024. Over our forecast period, we expect inflation abroad to come under control and return towards more normalised levels. This means that our PPP model shows an increasing propensity for long-term rand weakness. As a result, our PPP-modelled value for the rand vs US dollar at the end of the next 12 months is R14.83/US$1 (see Figure 4). We apply a R2.00 range around this to get to a modelled fair-value range between R13.83/US$1 and R15.83/US$1.
The domestic and global backdrop means we start with the rand meaningfully weaker than our modelled fair-value range. We anticipate some of this weakness will reverse in the coming months.
We expect the rand to remain particularly volatile, and surprises are inevitable for the remainder of this year.
GLOBAL EQUITIES
Global equities sustained their bull run in 3Q24, with the US S&P 500 up 40% since October 2023. Economic conditions and prospects remain excellent for global companies. Still, as share prices rise, the risks of a correction increase, and our 12-month outlook for global equities is a relatively muted 6% return in US dollar terms. We are not calling the end to this bull market but are cautious in deploying new funds.
The investment world changed in September 2024 when the US Fed reduced interest rates for the first time in three years. This was significant because it was in response to lower inflation and the normalisation of interest rates rather than worsening economic conditions. Investment markets liked this, and it provided further impetus to the equity rally. The logic goes that if the economy does come under pressure, the Fed has plenty of ammunition to engineer a “soft landing.”
Bull markets tend to dismiss risks and events that could cause tremors in a grumpier market. Geopolitical risks are currently particularly high as the Russia-Ukraine war intensifies and Ukraine, a Western ally, invades Russia (the first time it has happened since World War II). The ongoing Middle East conflict is also escalating, with more countries, including Iran and Lebanon, entering the fray, and the region remains on a knife-edge. However, the reality is that the market pays little attention to factors it does not expect to impact developed market (DM) earnings growth materially. Thus far, the perception is that these wars are unlikely to spill over, but an oil price shock could occur if things heat up further. Investors are also largely unsure about how to assess the ‘China invades Taiwan’ risk, and it seems to have subsided, at least for now. The US Presidential Election takes place in the next month, and this, too, is not expected to be a big market mover.
The biggest risk to the market is probably the market itself, in the form of inflated valuations. Complacency has undoubtedly set in as prices continue to rise, and a very good case is being priced in. If there is a mild economic shock, or company earnings do not materialise (at least in line with consensus), the market could easily correct 10%-20% without reaching average P/E multiples. Figure 5 below shows that the forward 22x P/E multiple in the S&P 500 is approaching the most expensive levels in two decades. This alone is a good reason for caution.

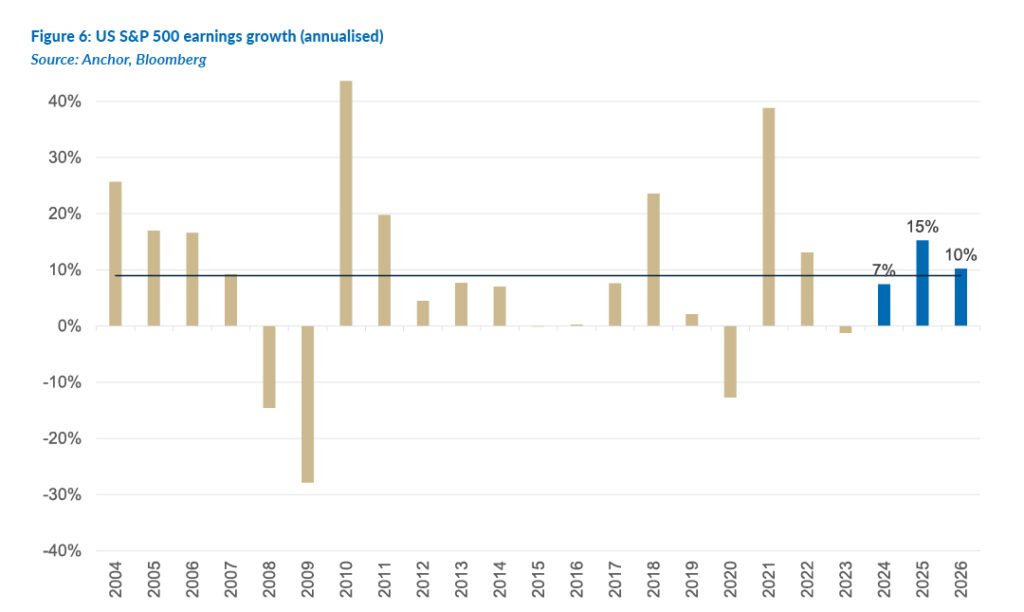
The biggest driver behind equity markets is earnings growth, and market expectations are for strong growth in the US into 2025 and 2026 as inflation slows, oil prices subside, and interest bills decrease.
There is no doubt that AI-driven optimism has buoyed markets, but high valuations have now extended far beyond the Magnificent Seven stocks (Apple, Microsoft, Google parent Alphabet, Amazon.com, Nvidia, Meta Platforms and Tesla), which led the market in 1H24.
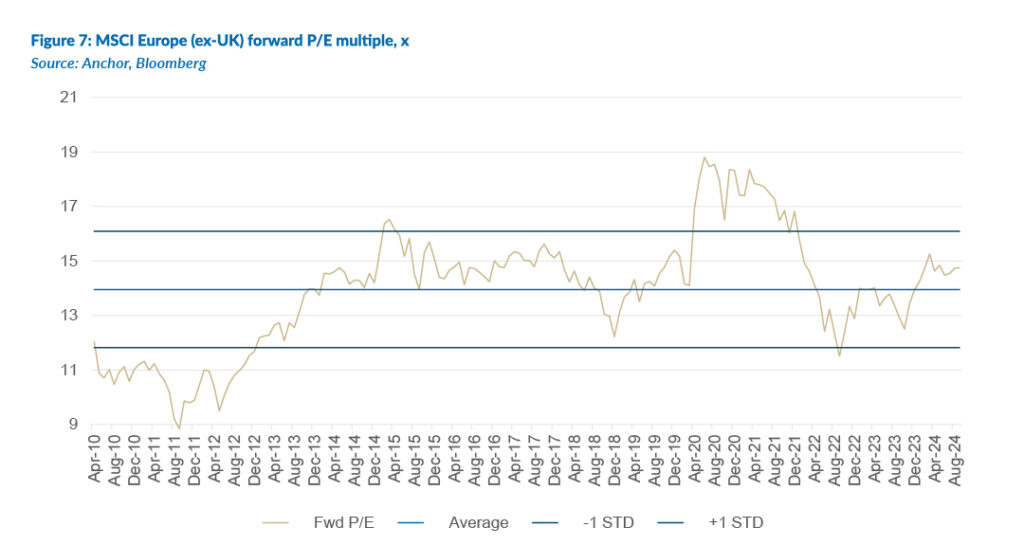
The market conditions explained above are mainly attributable to the US, which now comprises over 65% of total global market capitalisation. While most DMs have performed well this year, the European market rating is only marginally above its longer-term average.
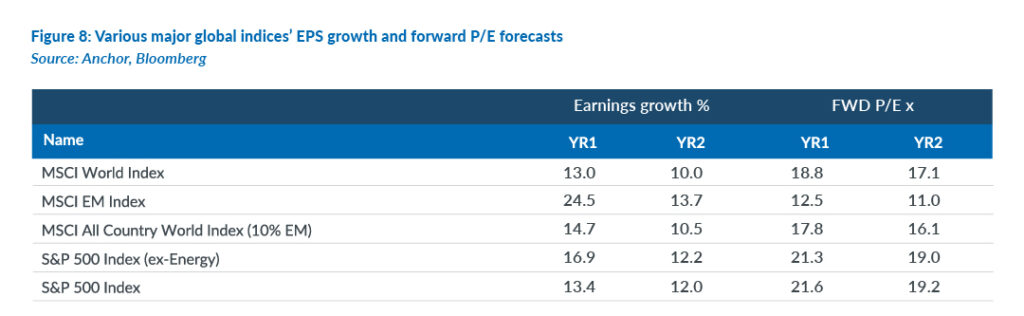
The table below shows the earnings growth and ratings of the various market indices.
The economic reality shown in Figure 9 indicates reasonable and accelerating global GDP growth. US GDP looks set to register around 3.2% YoY growth for 2024; many were forecasting a recession this year, but strong US national and local government spending has provided a big boost.

EMs have started to look interesting recently as global investors look for value. In late September, China launched a multi-pronged stimulus package, which has seen the country’s stock market catapult over 40% higher from extremely depressed levels. Still, China’s structural property market issues will keep many on the sidelines and take years to solve. Everything China-related has bounced as a result, but we will not be placing a big China bet after these events. Our global model portfolios have modest exposure to the China theme, which has benefitted investors.
GLOBAL BONDS
Early in August, US employment data came in slightly weaker than anticipated, and investors reacted by starting to anticipate a more “normal” US rate environment. A few days later, the release of US inflation data reinforced expectations that the era of elevated inflation was largely behind us. At its mid-September meeting, the US Fed announced a larger-than-expected 0.5% interest rate cut, the first time it had cut rates since the start of the COVID-19 pandemic in 2020.
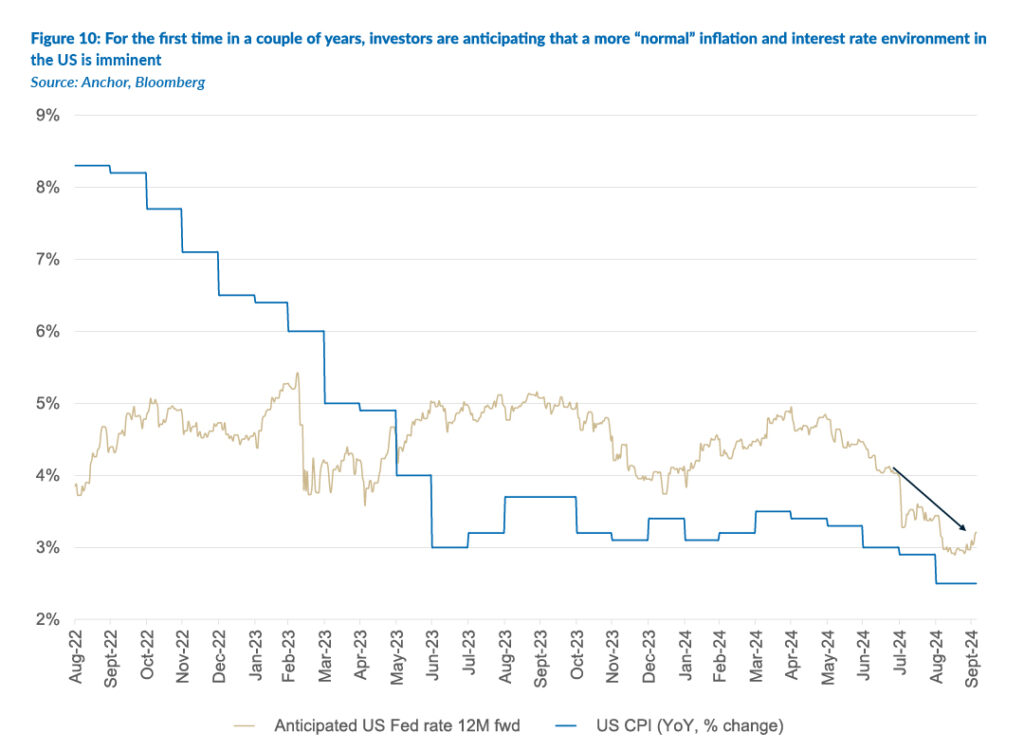
Optimism about the decreasing US rate environment helped drag the US government’s 10-year borrowing rate below 4%p.a., a level it had stayed above since mid-2023. A US 10-year borrowing rate of around 4% p.a. seems like an appropriate level to us. As such, we anticipate that investors purchasing 10-year US government bonds should expect the bulk of their returns to come in the form of coupon income, with limited scope for material capital gains. That leaves us anticipating a total return of 4% in US dollar terms for US government bonds over the next twelve months.
Corporate bonds have seen their yields relative to government bonds compress over the past few weeks as investors have leaned into risk assets, leaving the current investment-grade credit spreads at 0.85% p.a., very close to the lowest level they have historically achieved. With limited scope for further tightening in credit spreads, investors in US investment-grade bonds are left with interest income as the most likely source of most of their returns. We anticipate this will result in total returns for US investment-grade corporate bond investors of 5% over the next twelve months.
GLOBAL PROPERTY
The landscape for listed real estate investment trusts (REITs) has experienced a transformation over the past decade. Ten years ago, the traditional commercial property sectors (retail, office, residential, healthcare, hotel and diversified REITs) comprised almost 90% of the global REIT market cap. That figure has dropped to around 60% of the market cap as the industrial REITs (including data centres, storage and specialised REITs) generally servicing the digital economy have grown significantly.

The faster-growing industrial-type REITs typically trade at lower yields than the more mature traditional REIT sectors. This has put downward pressure on the overall industry yields, making them look relatively unappealing, particularly relative to bond yields.

Investors should, in part, be compensated for the lower yields with higher growth expectations, but that transition is still in the early stages. We think it is possibly too early to call an absolute bottom in the traditional sectors (though there are early signs of stabilisation in the higher-quality segments of retail and office), and this will act to dampen any meaningful income growth in the near-term asset class level. We anticipate a total return in US dollar terms of 5% for investors in the asset class over the next twelve months, predominantly in the form of income.