ECONOMICS
As we move into the last quarter of 2022, it is undeniable that the global economy is slowing, with no single factor behind the lethargy. In Europe, an energy crisis is battering household finances and weighing on industrial output. China is reckoning with the fallout of its real estate slowdown and strict zero-COVID policy. In the US, the Federal Reserve (Fed) is rapidly tightening policy to cool the surge in inflation powered by a return of post-lockdown consumer activity, excess savings, and supply chain bottlenecks. Monetary authorities around the globe have their work cut out for them, with increasing questions on whether they can pull off a soft landing – reducing demand enough to wrestle inflation down from 40-year highs without crashing their economies into a deep or prolonged recession.
As such, the frontloading of interest rates remains the central global economic theme. However, larger rate hikes have quickly become the norm for central banks, with 75 bpts replacing 50 bpts as quickly as 50 bpts replaced 25 bpts. Whilst frontloading remains the key directive; for now, expectations have shifted to rates remaining higher for longer. Consequently, global bond yields have increased sharply – especially in the UK. This is as the country moves into the eye of the storm of a self-inflicted financial crisis that threatens to accelerate the economy’s dive into a recession. In the space of one week since the new UK administration unveiled the biggest tax cuts since 1972 (with scant detail of how these will be financed), the pound crashed to its lowest-ever level against the US dollar, and the cost of insuring British government debt against the risk of default soared to the highest since 2016. At the time of writing, the Bank of England (BOE) was forced to take emergency action to avoid a meltdown in the UK pension sector by unleashing a GBP65bn bond-buying programme to stem a crisis in government debt markets.
Headwinds are also mounting for the euro area, given the current energy crisis and continuing supply chain disruptions. As such, the European Central Bank’s (ECB’s) Governing Council faced a difficult decision in September as it attempted to balance the ongoing inflation problem against rising economic headwinds. Whilst rates are sure to rise again, the key question is centred around the magnitude of future rate hikes. In line with consensus expectations, the ECB increased its three key rates by 75 bpts – the biggest rise since 1999, during the very early days of the eurozone. The more aggressive nature of the hike is relatively unsurprising – inflation in Europe is currently sitting at a half-century high and approaching double-digit territory. Consequently, policymakers are worried that rapidly increasing prices could become entrenched, eroding the value of household savings and setting off a hard-to-break wage-price spiral. Overall, European policymakers are facing a particularly difficult economic challenge, fighting high prices in the face of growing expectations that the energy crisis will drive the region into recession territory.
Shifting to our much-beleaguered SA, not only is the local economy being negatively impacted by global events, including a strong slowdown in the economic activity of most of our trading partners but local issues as well – most notably the renewed and record levels of loadshedding. This was clear in the latest 2Q22 GDP data released in September, indicating that SA’s economy decreased by 0.7% QoQ. Notably, the weakness was most pronounced in the goods-producing economic sector, with significant negative contributors to growth recorded in the manufacturing, agriculture, trade, and mining sectors. This can largely be attributed to the record levels of loadshedding experienced this year. It is important to remember that Eskom implemented electricity outages for over half of the days in 2Q22, with 3Q22 also reaching new record levels. In rand billion, the SA economy remains at 2018 levels which speaks to the structural issues holding back the country’s growth.
Looking ahead, growth in 2022 is expected to slow to a meagre 1.9% YoY, as per the SARB’s latest estimates. Typically, in the local economy, material job creation has only occurred when GDP growth approaches 3% p.a. Thus, the SA economy is simply not growing at an adequate pace to sustainably boost long-term employment prospects for South Africans.
As we move into the close of 2022, the famous quote, “Uncertainty is the only certainty there is, and knowing how to live with insecurity is the only security.” by American mathematician John Allen Paulos, indeed holds true. This uncertainty will permeate both the global and local economic outlook in 4Q22. Nevertheless, much like what was experienced throughout previous quarters, whilst opportunities continue to exist in most asset classes, volatility will likely remain high for the foreseeable future.
SA EQUITIES
The FTSE/JSE Capped Swix Index followed global markets lower in 3Q22, ending the quarter 2.4% down in rand and falling by 12.3% in US dollar terms. YTD, the JSE has been a relative outperformer, with the Capped Swix Index down 18% in US dollar terms, while global equities (MSCI World) are down c. 25%, and emerging market (EM) equities are 27% lower. The fact that the JSE has outperformed both EM and global equities does not surprise us –the JSE is less vulnerable than the larger developed market (DM) exchanges to a de-rating, given the relatively lower valuations and earnings bases. Our base case over the next 12 months is for the JSE to continue outperforming with a total return expectation of 16% relative to 12% for global equities and for the rand to strengthen against the greenback. Our constructive view on SA equities is premised on valuation multiples having approached extreme levels of 8x forward earnings, overlayed with conservative earnings expectations and a discount rate at the high-end vs historical levels.
In building a set of expectations for the domestic equity market, we have bottom-up return expectations that cover roughly 80% of the local index – with no particular sector screening as fundamentally overvalued. Even at a company-specific level, the number of companies on our watchlists that are screening as expensive is about as low as it has been since the inception of our process. With fears around slowing global growth, stickier inflation in the developed world, and the resulting higher cost of capital, the general risk-off tone has made equity returns hard to come by. We think it is not unexpected that the contraction in valuation multiples reflects this. However, in the case of SA, a market that has had to deal with ’stagflationary’ type conditions for the best part of a decade, the business models and management teams are in better shape to deal with the current operating environment relative to some of the DMs, where inflation above 2% is a relatively new concept. This view is further corroborated by the recent results reporting season, which saw a higher number of earnings beats than misses and commendable performances from the large industrial and banking counters that mainly operate locally.
Over the past month, we have met with around 25 locally listed SA management teams – with the common theme being acceptance and resilience. We have often made the point that SA management punches above their weight when it comes to the operational performances of the companies they run. This difficult environment, particularly over the past ten years, has resulted in a greater internal focus and a relatively low expectation that the operating environment will improve over the near term – the result of which has meant that businesses have been run lean and more focus has been on reporting clean metrics such as cash conversion, disciplined cost control, and prudent balance sheet management. The number of corporate deals in the listed space among locally focused businesses has fallen dramatically over the past five years, particularly offshore transactions. Recent examples of companies focusing internally to unlock shareholder value have been the decision of Shoprite to exit certain African operations and Woolworths’ resolve to rationalise and optimise its Australian Apparel business and pay down debt. These are just two examples of management teams focusing on the controllable in a challenging operating environment and being rewarded for it. We continue to identify deeply undervalued domestic companies, most of which have some uniqueness to the investment case that does not involve rapid top-line growth. While many of these opportunities are yet to play out fully, many have not gone unnoticed, with the number of buyouts and delistings from the JSE having shot up in the past two years, with a few more in the pipeline.
Looking at those companies listed on the JSE and less reliant on the SA economy for earnings growth, we note that we find ourselves in the unique situation that some of our offshore earnings may be more at risk of negative revisions than domestically focused businesses. We do not often view the earnings expectations from Europe and UK with more scepticism than those locally. However, the deterioration in the UK and Europe’s spending power in real terms over the next six months because of an unfamiliar increase in the cost of living will undoubtedly impact certain company earnings.
Even in China, a region the JSE relies so heavily on for exports of commodities and the contribution of Tencent’s earnings to Naspers, we have had to deal with a sharp deterioration in activity levels over the past year. Even as Naspers has chosen to sell down a portion of its stake in gaming conglomerate Tencent, the process will likely take place over several years. The Tencent asset will remain the most important driver of Naspers’s returns for the foreseeable future. We maintain our constructive view on the Naspers and Prosus investment case, with Tencent’s investment case having evolved (not too dissimilar to many SA companies) into a value-extraction exercise instead of a rapid-growth thesis. This evolution has been painful for equity holders as the valuation multiple Tencent trades on has compressed over the past 18 months. Our base case is that Tencent management has quite a few levers to pull to deliver above-trend operating EPS growth (>20% YoY) without needing the top line to grow by double-digits. Asset realisations, rationalisation, and prudent capital management are a few levers management has at its disposal to drive shareholder returns.
With a specific eye on sectors that screen as most attractive, we continue to expect double-digit total returns from the local banking sector, trading on an average dividend yield of 7%, with double-digit earnings growth expected. The basic materials complex (including energy) continues to offer compelling value (>20% to our fair values). Still, we concede that the deteriorating global growth backdrop threatens our fair-value targets being achieved. However, should growth fears alleviate somewhat, we think that corner of the local market has the most significant upside. As such, we have been pairing underweights to the sector, particularly the platinum group metals (PGMs).
SA LISTED PROPERTY
The FTSE/JSE SA Listed Property Index (SAPY) has declined by 15.8% YTD, a slightly worse performance than equities. Our projected return for the next 12 months is 13%, most of which comes from distributions (in the region of 11%). Almost all asset classes in the world have declined, and SA property has suffered a similar fate. We would argue that the prospects for SA property companies have not worsened of late. Still, the relative attractiveness of other income-generating assets has put pressure on property companies’ share prices. We believe that the SA-listed property sector should be assessed as follows:
- For SA-domiciled properties, the growth outlook is mediocre – a reasonable quality SA diversified portfolio should grow in the low single digits for the next few years. This is through a combination of 6%-7% escalations, roughly 10% reversions for new leases and increasing cost pressure from rates and utilities. We remain concerned about the challenging long-term net rental growth trajectory of large urban malls and the inability of landlords to pass on rising utility and other property operating costs to tenants in the current environment. The prospects for filling office space are limited as office occupation in the professional services space is very low. Tenants of the SA property landlords have been performing well if measured by the results of listed companies, which is a positive light on the horizon.
- For foreign-dominated property portfolios, Eastern European (the majority of exposure in SA-listed properties’ offshore profit) profit growth still looks reasonable. However, the impact of the Russian-Ukraine war remains uncertain. For now, the impact on countries like Poland looks profit-positive as millions of people flow across the border from Ukraine.
- SA 10-year bond yields have increased from around 8.5% to 11% in the last year on the back of rising global yields. This has decreased the attractiveness of property income, which is reflected in the share prices YTD.
- The JSE-listed property companies have not devalued their property book values in line with the increase in bond yields. The market has, however, done so, and the average discount to book value is 35%. It is interesting to note that most property companies are selling properties at or around book value (which would indicate good value). Still, these transactions are primarily in the smaller property space (R50mn-R200mn) and have not been tested in the larger property space. It is difficult to see who would be a buyer of large properties at anywhere near book values when the companies themselves can be purchased at two-thirds of book value.
In summary, it is tough to grow out there, but earnings risks are also much lower than the average listed company. A reasonable portfolio of SA-listed property equities can generate a distribution yield of around 11%, and we are not projecting material capital growth given the above scenarios. When bond yields decline, there are prospects for capital revaluation.
DOMESTIC BONDS
SA government bonds (SAGBs) again underperformed in 3Q22, with an All Bond Index (ALBI) return of only 60 bpts over the past three months. Over a longer time horizon at the index level, the ALBI has retreated by 1.34 YTD, feeding into all duration-bearing assets in SA. Yields remain elevated and have seen pronounced volatility over the past two months, with the R2030 seeing low yields of 9.815% and high yields of 11.11% – a spread of 1.3% over three months.
On the global front, risk-off sentiment has become pronounced as central banks continue their rate hiking to corral DM inflation which is higher than at any point in the past 40 years. This has left US short-end rates (US 2-year Treasury) at 4.2% – well above the 1% level at the start of this year and c. 0.25% in October last year. Combined with the new UK chancellor and prime minister’s policy proposals, the gas crisis in Europe leading into winter, Russia’s ongoing war in Ukraine, the election of populist governments in Sweden and Italy and the polarising election in Brazil (set for a run-off), this has led to a market that is aggressively risk-off in sentiment.
Domestically, the past quarter (3Q22) has seen some major issues that have harmed the performance of SAGBs. These include:
- Another bout of severe loadshedding (the worst on record) left most of the country indefinitely on level 4 loadshedding (as of the time of writing).
- The upcoming ANC December elective conference.
- The breakdown of coalition governments in Johannesburg and Nelson Mandela Bay.
- Continued rate hiking (with another 0.75-bpt hike at each meeting this past quarter [3Q22] – July and September).
The SA Reserve Bank’s Monetary Policy Committee (MPC) has been hawkish but split in terms of rate hiking, with the last meeting in September seeing a 2-3 split between a 100-bpt and 75-bpt interest rate hike (with the 75-bpt hike winning). Current market expectations (implied from FRAs) are for another c. 200 bpts of hikes to YE2023 (as shown in Figure 1 below).
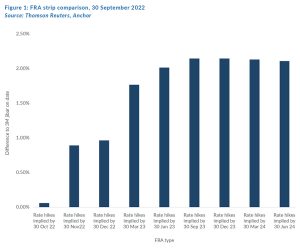
The Anchor Fixed Income team views this as materially too hawkish (for reference, if the implied 200 bpts of hikes materialise, the repo rate will return to levels last seen pre-2008). We retain a view that volatility (driven by the combination of economic, political, and financial markets turmoil) will likely be a feature of SAGB performance over the near- to medium-term. However, with yields at an index level over 11%, there is material upside in holding SAGBs at current levels, with the potential for capital growth if the risks subside or even moderate.
THE RAND
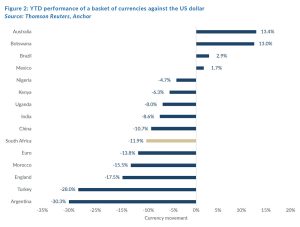
The past nine months have been characterised by a strong US dollar dominating all other currencies. In Figure 2, we set out the YTD performance of the US dollar against a basket of other currencies. Most of these currencies have depreciated against the US dollar. However, the strong policy stance of the SARB, coupled with a strong export performance, has seen the rand fare better against the greenback than the pound and the euro.
Projecting the rand’s value in a year’s time is a fool’s errand. The rand vs US dollar exchange rate is one of the world’s most volatile currency pairs and trades well away from any modelled fair value for long periods. We note, however, that the rand trades within an R2.50 range to the US dollar in most 12-month periods.
The indicators for the rand’s fair value are gradually turning negative again. We note that 2022’s current account surplus will likely give way to a shallow deficit in 2023, eroding some currency support.
We retain our purchasing power parity (PPP) based model for estimating the rand’s fair value. We have extended this out by three months since the publication of The Navigator – Anchor’s Strategy and Asset Allocation, 3Q22 report on 11 July 2022. Over our forecast period, we expect inflation abroad to come under control and return to more normalised levels. This means that our PPP model shows an increasing propensity for long-term rand weakness from next year again. Our PPP-modelled value for the rand vs US dollar at the end of the next 12 months is R14.30/US$1 (see Figure 3). We apply a R2.00 range around this to get to a modelled fair value range between R13.30/US$1 and R15.30/US$1.
The global backdrop means we are starting with the rand meaningfully weaker than our modelled fair range. In previous cycles, US dollar strength has tended to dissipate (and reverse) toward the end of the US rate hiking cycle. Current indications are that the US Fed will reach peak rates in 1Q23, meaning that we expect to see currency normalisation, with the US dollar giving up some of its gains in the latter part of next year. We do not expect the currency to fully recover that rapidly, and we are projecting a rand in the R16.00-R16.75/US$1 range in one year. For this report, we have modelled on R16.50/US$1.
We expect the rand to remain particularly volatile, and surprises are a certainty in the year ahead.

GLOBAL EQUITIES
We enter the last quarter of 2022 with global equity markets trading close to their 2022 lows, with the S&P 500 down c. 25%. Further disappointments in the short term (most likely from US CPI and quarterly earnings) could see another leg down, but we believe it is time to keep one’s eyes on the horizon. We expect global equity indices to be higher 12 months out, with a projected return of 12%. That represents an S&P 500 Index level of 4,000 (from the current 3,600) – if the US can achieve an economic soft landing, this could even be higher.
Index-level projections can often mask very attractive underlying share-specific opportunities. While indices have dropped c. 25%, certain sectors and some high-quality businesses have crashed by 50%. There are some very compelling opportunities at a share level.
Global inflation is at the core of this year’s market meltdown, driven by easy money and supply pressures from clogged supply chains and Russia’s war on Ukraine. We think that the current 8% US inflation could subside to 3% within a year, easing pressure on central banks to act in a restrictive manner. During the height of the volatility and market declines, it is important to remember that it is an economic cycle, and we are well past the halfway mark. It is also vital to remember that markets move long before economies actually turn – they look forward and price-in the aggregate view of the future. By the time the economy is on the up again, markets will have already run away.
So, the playbook sounds simple, but the shorter term is far more complex, and market participants and commentators are on edge trying to work out when rates will peak, how long rates will remain high, and how deep the economic impact will be. These are all factors that will determine the short-term trajectory of markets. The dollar has been incredibly strong this year (strengthening by a massive 17% against its average trading partner), and once peak dollar and peak rates are in sight, the next bull market could be in the making.
Inflation stickiness will be one of the key things to watch over the next few months. A tight labour market and stubborn rental numbers will be a drag, while many of the inputs into goods manufacturing and transport have already declined. The US Fed will continue to speak loudly in unison about doing what it has to do, but, as history has shown, positions can change rapidly. The term of the times is “the Fed pivot”. At a base rate of 3.25% (the fastest rate hike in history from 0.25% six months ago), there could be another 1% rate increase to go, at which point any further hikes would be very damaging to the US economy.
However, the most important determinant of markets is earnings, and downgrades will certainly follow – official forecasts tend to lag the actual expectations that are discussed in investment meetings. Figure 4 below shows that Bloomberg consensus analysts’ US EPS growth projections for 2023 are at 8%, which appears high given the economic pressure that will be felt from higher interest rates. We would argue that much of this has been anticipated and is priced in at current valuations.
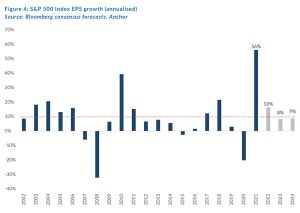
The US S&P forward P/E of 15x (see graph below) is below long-term averages, and if you strip out the big-five tech companies, this decreases to a cheap 12x. This does leave a buffer for anticipated downgrades.

GLOBAL BONDS
US 10-year government bond yields rose materially for a third-consecutive quarter, spiking to 3.8% by quarter-end, having more than doubled from the 1.5% level where they started the year. Going into 2022, the US Fed had hiked rates by 0.75% or more only five times in the past 40 years. However, by the end of 3Q22, the Fed had delivered three consecutive 0.75% hikes, with the fourth hike of that quantum all but a certainty at the next Fed meeting in early November. The crux for global bond investors is how high rates will go and how long they will stay there.
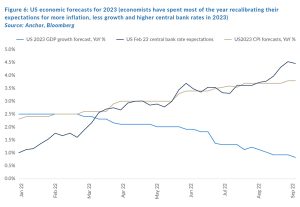
Talk of a soft-landing, where the Fed can swiftly reverse course on monetary policy tightening in early 2023 as inflation normalises, thereby avoiding a recession, seems to now be a much tougher ask as the Fed itself is talking about causing economic pain to get inflation under control. At its most recent press conference, the Fed was at pains to talk down investor expectations for an imminent unwinding of tighter monetary policy. Investors and economists have spent most of the past year adjusting their expectations to the prospect of less transitory inflation, central bank rates which are higher for longer and significantly weaker growth.
Fortunately, it seems that by mid-2023, we will be through the worst of the inflation, and central banks will have stopped hiking rates.

As we contemplate what “normal” monetary policy might look like through the next cycle, we expect we will move back to an environment that is unlikely to look like the past decade or so, where extraordinary amounts of quantitative easing (QE) squashed the real yields that investors would typically expect to be compensated with for taking on long-term uncertainty when lending money for periods as long as ten years. With fresh scars from the inflationary shock that was likely partially a function of excessive QE, central banks are sure to be more circumspect when deploying QE. Nevertheless, having formed a key quiver in the bows of major DM central banks for so long, we think it is unlikely that we have seen the last of QE. So, we expect the new normal will see a return of positive real yields for long-bond investors, but it is unlikely that those real yields will ever reach the same levels they were in the pre-QE world.

So, as we approach the end of the 1-year forecast horizon that we consider in this publication, we are likely to have entered an environment of subdued inflation, peak central bank rates and slow economic growth. In such an environment, we think it is likely that the Fed will be contemplating moving rates to more supportive territory but is unlikely to be considering QE yet. As such, we expect US 10-year government bond yields to be reflecting a moderate real yield (0.75%) over a more normal, long-term inflation rate (2.5%) for a level of 3.25%, which will give 10-year US government bond investors a 6.8% total return in US dollar terms over the next twelve months.
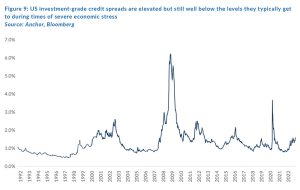
We expect US investment-grade corporate credit spreads to gradually deteriorate over the next twelve months as economic activity slows and the burden of higher debt servicing starts to weigh on indebted corporates. Although credit spreads for investment-grade borrowers are already slightly elevated (1.6%) relative to their 10-year average (1.25%), they remain well below the levels they can spike to during periods of economic stress. Therefore, we think it is realistic that they can widen to 1.8% over the next year, leaving investors in US investment-grade corporate bonds with a total return of 7% in US dollar terms.
GLOBAL PROPERTY
Global listed property had a torrid 3Q22, falling at twice the pace of equity markets. This asset class is arguably the worst placed to weather the combination of rising rates and a deteriorating economic growth outlook.

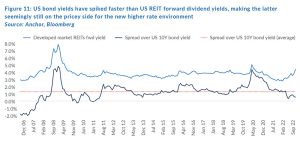
Despite the precipitous fall in real estate investment trust (REIT) values (and the associated spike in forward dividend yields), US 10-year bond yields have spiked faster, resulting in the spread between US 10-year bond yields over US REIT forward dividend yields narrowing to further below its long-run average. By this metric, if US bond yields remain at around these levels, REIT valuations are likely to still be a bit stretched.
While REITs in aggregate, still seem slightly expensive based on their forward yields, the sector that still sticks out as cheap, even when adjusting for the current higher bond yield environment, is the office sector. Investors seem nervous about the potential structural impacts on the sector from the work-from-home (WFH) phenomenon. Investors have seen the impact of structural changes in behaviour on retail REITs, which have lost roughly a quarter of their value since 2016 due to a shift to more online shopping.

Even though some of the major REIT sectors in the US appear to be trading at significant discounts relative to where private market property transactions are being executed, historically, this has been a leading indicator for a drop in private market transaction values rather than a sign that listed markets are too cheap.

We believe US rates will rally slightly over the next year, helping erase most of the overvaluations in the asset class. That will leave DM REIT investors with a combination of yield and earnings growth to deliver a 9% total return in US dollar terms over the next year.