ECONOMICS
The return of US President Donald Trump to office has indeed brought about exactly what many had anticipated: a surge in policy uncertainty and renewed volatility across financial markets. This policy turbulence—especially surrounding aggressive tariff announcements—has already taken a visible toll on global sentiment. Business and consumer confidence indicators, particularly in the US and other advanced economies, have declined notably. The next test lies in whether this downturn in ‘soft’ data will be mirrored by ‘hard’ data like GDP, which could further confirm a broader economic slowdown.
Global growth expectations have been revised downward accordingly. The world economy is now projected to expand at below 3% for 2025 and 2026. This is well below the 20-year average of 3.4%- a figure that already reflects the shocks of the 2008/2009 global financial crisis (GFC) and the 2020 COVID-19 pandemic. Inflation trends tell a more complex story. Globally, price pressures are expected to ease modestly due to cyclical factors. However, in the US, inflation is likely to spike in the short term as tariffs push firms to raise prices. The limited retaliation from major trade partners (mainly China and Canada) means inflation elsewhere may remain more subdued. Much now hinges on how trade, fiscal, and monetary policy evolve. The US’s effective tariff rate has surged to around 18%, up from just over 2% before Trump first took office. Even if new trade agreements reduce this rate over time, it is unlikely to return to pre-2017 levels. A sustained tariff rate above 10% would still represent a significant drag on global growth, albeit not as severe as the “nightmare scenario” many feared when the latest tariffs were initially unveiled.
This challenging backdrop has left the US Federal Reserve (Fed) in an especially difficult position. Unlike most other central banks, the Fed faces the dual pressures of rising policy uncertainty and persistent concerns around inflation, all while being politically targeted by the Trump administration to cut rates. Other developed market (DM) central banks, in contrast, are operating with greater freedom. Outside the US (and aside from Japan), inflation outlooks have improved, allowing policymakers to cut rates without sparking sharp currency depreciation. As such, many emerging markets (EMs) have also benefitted from this dynamic, easing policy while their currencies remain relatively stable.
While attention remains on tariff policy, geopolitical risks have added another layer of complexity. A brief ceasefire in the Middle East has helped ease oil and gas prices, following a period of heightened tension involving Iran, Israel, and the US. Nonetheless, geopolitical flashpoints remain a wildcard for markets. Even so, investor sentiment has shown signs of recovery since the initial market selloff in April, dubbed “Liberation Day” after the Trump administration’s aggressive tariff announcements. One explanation for this recovery is growing belief in what some have dubbed the ‘TACO’ (Trump Always Chickens Out) trade, referring to Trump’s tendency to walk back extreme measures once market backlash intensifies. His partial reversal on 9 April reinforced that view, and markets are now pricing in the possibility that further tariff escalation may be limited by political self-interest. Meanwhile, the long-term fiscal outlook in the US is deteriorating. Trump’s proposed tax bill is expected to add nearly US$2.5trn to US government debt over the next decade. However, as the bill shifts through the various levels of voting in both the Senate and House, at the time of writing, reports suggest growing resistance from both moderate and ultraconservative Republicans, casting uncertainty over its final passage. This only adds to the complex risk landscape for markets, reinforcing the need for caution and careful decision-making.
On the international front, geopolitical instability is reshaping fiscal priorities. With the war in Ukraine ongoing, NATO has agreed to raise defence spending targets from 2% to 5% of GDP by 2035. This marks a stark reversal of the so-called ‘peace dividend’ era. The ‘peace dividend’ era was a period of reduced military spending and increased social spending following the end of the Cold War. The reversal of this era comes at a time when many countries already face rising debt-servicing costs, ageing populations, and expensive climate transition plans. The result will likely be persistently high government borrowing and upward pressure on bond yields across the developed world.
Domestically, South Africa’s (SA) economic outlook has weakened, reflecting a combination of deepening political uncertainty and mounting global pressures. The South African Reserve Bank (SARB) has downgraded its 2025 GDP growth forecast from 1.7% to 1.2%, primarily due to escalating global trade tensions and instability within the GNU. The International Monetary Fund (IMF) is even more cautious, projecting growth of just 1% for 2025. Investor confidence has been eroded by persistent policy uncertainty and delays in critical structural reforms. Tensions within the GNU have raised fresh concerns about the direction of economic policy. At the same time, longstanding issues in the logistics and energy sectors continue to weigh heavily on business sentiment and investment planning. The SARB has further trimmed its growth forecasts for 2026 and 2027 to 1.5% and 1.8%, respectively, citing weak reform momentum and ongoing external headwinds.
A key short-term risk is the looming expiry of the 90-day US tariff reprieve in early July. Without an extension, certain South African exports to the US (its second-largest trading partner) could face tariff hikes of up to 30%, compared to the current 10%, undermining export competitiveness and trade volumes. Despite these challenges, low inflation is offering some relief by supporting real disposable incomes and household spending. Additional support may come from reduced debt-servicing costs and further potential withdrawals via the two-pot pension system, which could temporarily boost consumer demand.
While some of the intense uncertainty that characterised 1Q25, such as delays in the budget process, tariff volatility, and questions around GNU stability, have marginally subsided, the broader economic outlook remains fragile. Sustained structural reforms still have the potential to lift SA’s longer-term growth trajectory. However, in the short term, political uncertainty, sluggish investment, and ongoing external shocks continue to constrain economic prospects. Positively, however, SA is now widely expected to exit the Financial Action Task Force (FATF) grey list later this year or in early 2026- a significant milestone that reflects substantial progress in addressing governance and financial oversight deficiencies.
SA EQUITIES
Following on from a strong opening quarter (1Q25), JSE-listed equities continued their upward trajectory to end 2Q25 up another 9.7%. YTD, the FSE/JSE Capped Swix has risen by 16.1%, and the MSCI South Africa Index is up 30.3% (in US dollar terms). This puts the JSE as a standout performer in global equities YTD and over the past 12 months. At the time of writing, The Navigator – Anchor’s Strategy and Asset Allocation, 2Q25, in April, we were still digesting the double threat of the GNU failing (internal) and the Trump administration imposing growth-crippling tariffs across the globe (external). These factors were primarily to blame for us turning more defensive on local equities 12 months out. While some of the risks have since de-escalated, both locally and abroad, we still find the set-up for JSE equities more balanced than at the beginning of 2025. Thus, we have maintained a neutral position on the asset class with a rand-denominated total return of 11% and a US dollar total return of 12.6% over the next 12 months.
We entered 2025 positive on domestic equities, expecting a continuation of the trend that kicked off in June 2024, following the formation of the GNU in SA. The investor-friendly outcome of the 2024 National and Provincial Elections (NPEs) resulted in raised hope of much-needed structural reform, potentially lifting SA out of the growth trap of sub-2% GDP growth, something the local economy has struggled to achieve over the past ten years. In the shorter term, a stronger rand, the absence of loadshedding and interest rates that were set to be lowered were expected to provide much-needed stimulus, particularly for the SA consumer. We therefore felt that the market would continue to be led by the domestic group of companies (so-called SA Inc. stocks), financials, retailers and midcaps.
However, the actual outcome so far in 2025 could not be more different. While at a headline level, a six-month return of 16% is commendable, the make-up of this return was not as expected. More than half of the return (8.4%) has come from the basic materials sector, and c. 5% has come from the rand-hedge component of the local index. What makes this even more surprising is the outperformance of these sectors, which are beneficiaries of a weaker rand, against the backdrop of a strengthening currency (and bonds), which would typically be beneficial to domestic companies. Even within the domestics, which added 2% to the total index performance, almost all of the return contribution has come from SA’s local telecommunications companies, which themselves have businesses outside of the country. The typical beneficiaries of a stronger rand and lower bond yields have materially underperformed YTD.
This begs the question: Why have SA Inc. stocks underperformed so dramatically against a backdrop that would typically see them outperform? In our view, this is simply a case of high expectations for an outcome that, so far, has been somewhat underwhelming. Investors and strategists entered the year with high hopes of GDP approaching a magical 3%, and six months later, the expectations have already dropped to c. 1.3%, with the direction of travel lower. The anticipated structural reforms appear to be moving in the right direction, albeit at a far slower pace than investors were looking for six months ago, resulting in a frustrating period of expectations being pared back. The shorter cycle catalysts appear to still be in place, interest rates are coming down, and the conditions for the consumer are easing somewhat. Importantly, barring one or two individual cases, corporate results have generally been within expectations, which has meant the domestics have been in a “muddle-along” phase for the past six months, as opposed to materially underperforming in absolute terms. This environment is more frustrating for investors than particularly painful.
One area of the domestic market that has been under considerable pressure is the discretionary retail space. Still relatively small in the local index (c. 3.4%) yet covering quite a few companies across the discretionary consumer spending spectrum, the discretionary retailers are, in aggregate, down over 15% YTD. Again, this is counterintuitive against the backdrop of a stronger currency, lower interest rates, additional liquidity because of changes to the local pension fund regulations and lower fuel prices. Once again, the weakness is most likely being driven by expectations coming into this year being overly optimistic, with operational results, for the most part, ahead of the expectations set a year ago, yet lower than those set six months ago. We view the recent weakness as an opportunity going into the back end of 2025.
Gold and, more recently, the platinum group metals (PGM) complex have been the standout performers this year, with many of the commodity producers in that space having close to doubled YTD. There has been a confluence of events that have provided underlying support for the metals; however, arguably the most powerful has been the weakness in the US dollar. A weaker US dollar, and by implication higher gold and PGM prices, coupled with sector weights too big to ignore, have resulted in local asset managers neutralising underweight positions, providing a strong underpin to a highly cyclical and volatile sector. We caution that SA gold producers’ margins have rarely been this high, and we have begun to see a raft of deal flows across the space, usually a red flag for us in a sector prone to questionable capital allocation decisions.
The set-up for PGM producers seems to be more interesting based on where they sit in the cycle. At best, most of them entered 2025 in a marginal profit position, most likely burning free cash flow to keep the operations going on an annual basis. Outside of the weaker US dollar, recent developments, particularly in China’s jewellery market, where onshore jewellers have encouraged switching from gold to platinum, as a cheaper alternative, have provided a much-needed demand boost in a sector under pressure from the switch from internal combustion engine (ICE) vehicles to electric vehicles (EV) globally. Margins remain highly depressed in this space, and the recent strength in the PGM basket price has resulted in sharp moves higher in these equities YTD. Similar to gold, we would likely never have a material overweight in the sector, but at times when the set-up looks appealing, we would likely neutralise large underweight positions.
Naspers and Prosus started 2025 on a shaky start when underlying investment Tencent was flagged on a US Department of Defence (DoD) list of companies with ties to China’s military. Pleasingly, the market quickly turned its attention to the underlying operating momentum of Tencent, and more recently, the sharp turn to cash profitability of the investments outside of Tencent within the Prosus stable. We have been patiently waiting (for more than 10 years) for the billions of dollars of investments outside of Tencent to bear fruit, and as per the most recent Prosus Capital Markets Day, it would appear as though the Prosus (ex-Tencent) portfolio growth will comfortably outpace that of Tencent. We have long been advocates of this thesis playing out, and we continue to see Naspers and Prosus as core pillars within our portfolios.
Tying everything together, we note that there are certainly reasons to be optimistic about the JSE’s prospects over the next 12 months. It seems to have become a consensus that local politics will remain volatile as the country comes to terms with coalition politics. That being said, we believe that politically, SA is in a better place today than it was pre-2024 election, and that, coupled with easing financial conditions, further boosted by favourable terms of trade, and domestic equities that have muddled along YTD, sets the local market up for continued upside. More importantly for our clients, the local market continues to provide us with sufficient high-quality investment cases that allow us to build portfolios that have been able to steadily compound in real terms over the long term.
DOMESTIC BONDS
During 2Q25, the government tabled the third iteration of its FY25/FY26 budget, following two failed attempts due to a VAT implementation dispute in the GNU. The latest iteration faced the challenging task of achieving fiscal balance in the absence of the proposed VAT hike set against a deteriorating economic backdrop due to sweeping US tariffs on several of its trading partners. On the monetary policy front, recent comments from the SARB about potentially lowering the inflation target led market participants to recalibrate inflation expectations downward. On the global front, newswires have been filled with headlines about several major US trade deals in the pipeline ahead of the 9 July reciprocal tariffs deadline. Collectively, these developments have slightly improved the economic backdrop compared to 1Q25, boosting risk appetite, despite a brief setback in June when the latest Middle East conflict between Israel and Iran escalated as the Trump administration launched strikes on Iranian nuclear sites. As such, we maintain a modestly positive view on domestic bonds.
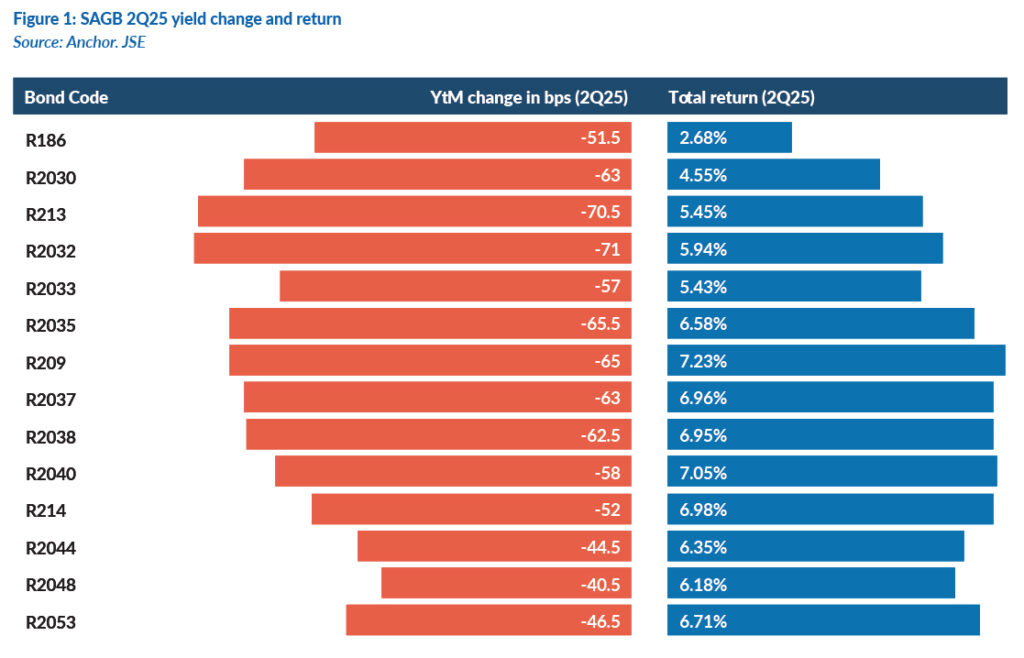
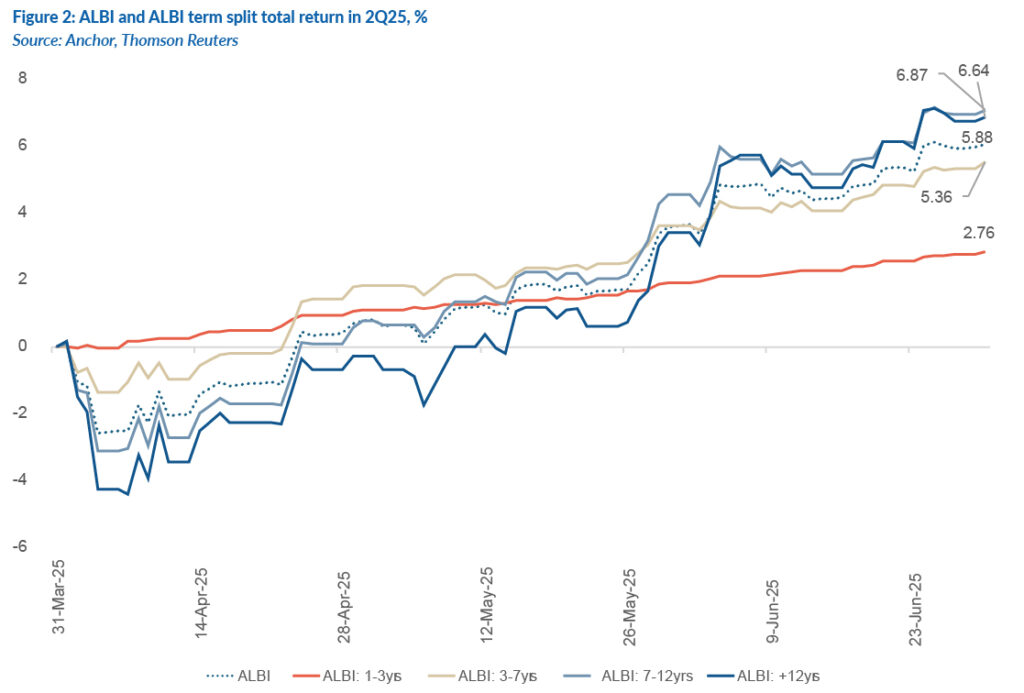
The SA Government Bond (SAGB) yield curve bull steepened in 2Q25, as shorter-dated bond yields rallied more strongly than longer-dated ones (Figure 1). The All Bond Index (ALBI) delivered a solid return of c. 5.9% over the quarter, with longer-dated maturities contributing most to this performance (see Figure 2 for the index and term splits).
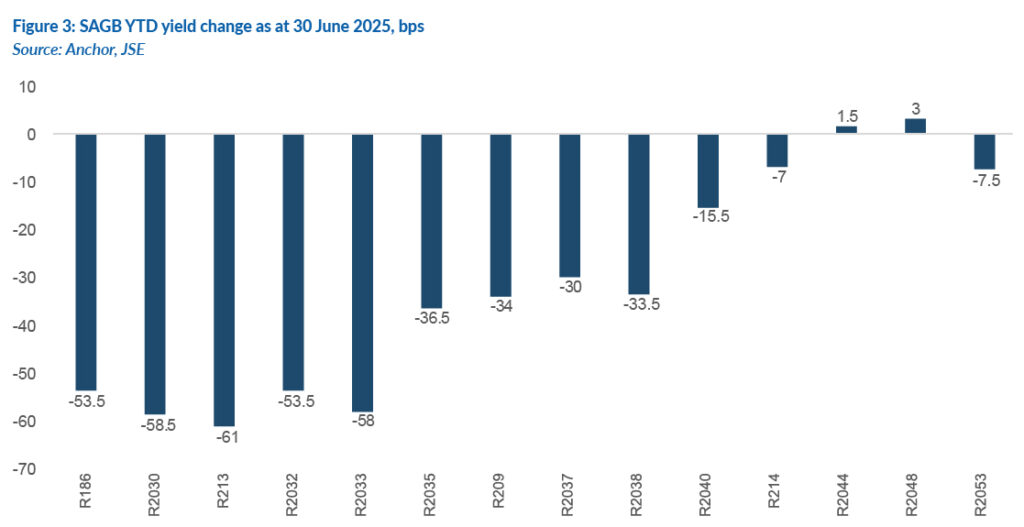
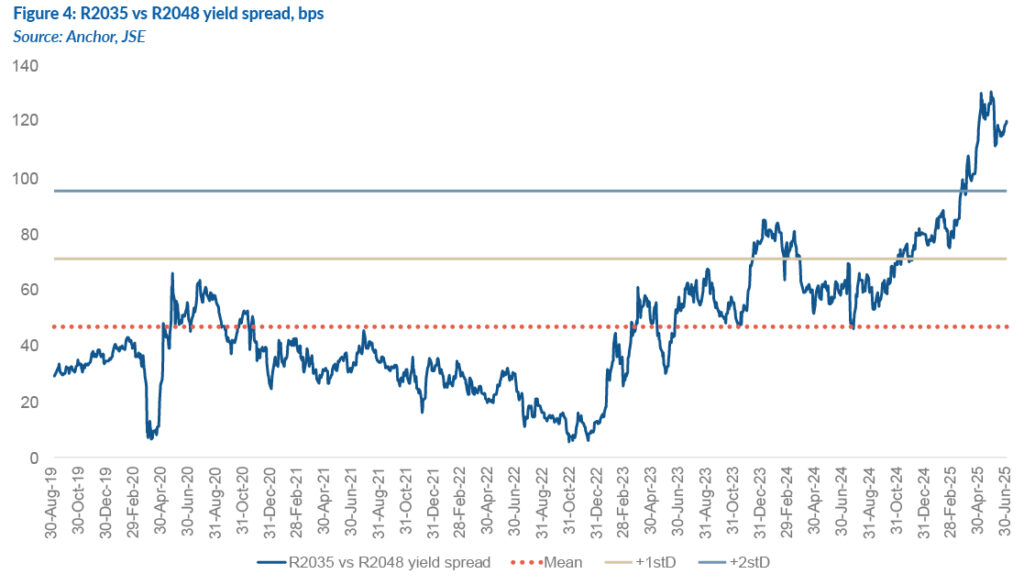
The SAGB curve has steepened significantly this year (Figure 3). The R2035 vs R2048 yield spread is now more than two standard deviations above the mean, reflecting a jacked-up term premium on longer-dated bonds due to fiscal concerns and local political instability (Figure 4).
A significant driver of the 2Q25 rally in local bonds has been shifting inflation expectations. At its May meeting, the SARB discussed a scenario involving a 3% inflation target, which corresponds to the low end of its current target range of 3%-6%. The SARB indicated that a 3% target may be more desirable, as it considers the current range too wide and elevated.
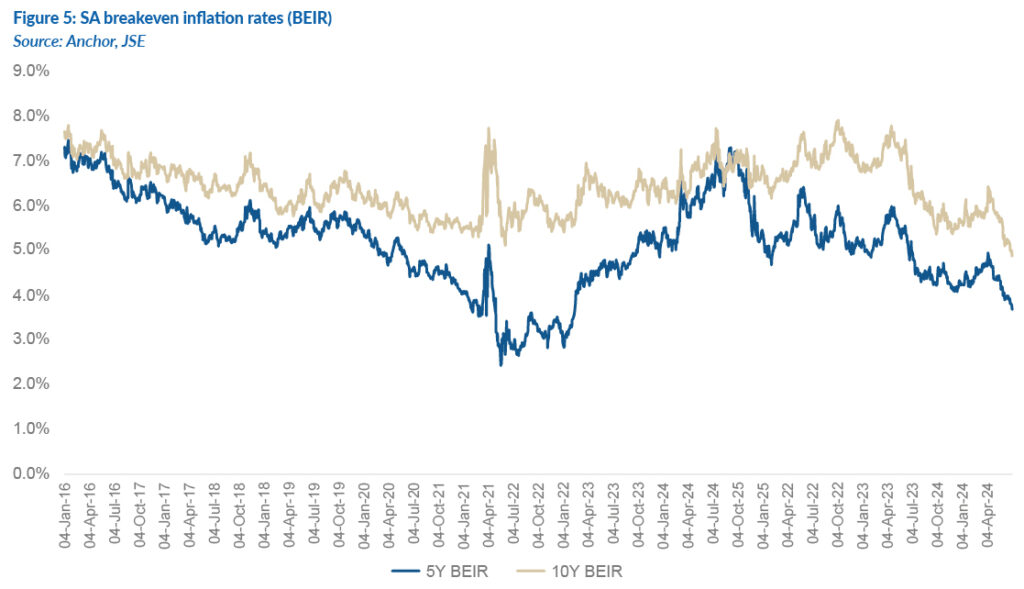
Following these comments from the SARB, the SA breakeven curve compressed significantly as market participants recalibrated inflation expectations downward (Figure 5). The 10-year breakeven inflation rate (BEIR) – the average rate of inflation that investors expect – ended the quarter at 5%, having compressed by over 50 bps since the SARB’s May meeting. Suppose 3% becomes the new inflation target. In that case, we expect both inflation expectations and the inflation risk premium to continue to compress, particularly for longer-dated bonds, given the steepness of the breakeven curve. We therefore see scope for further rallies in longer-dated nominal bonds.
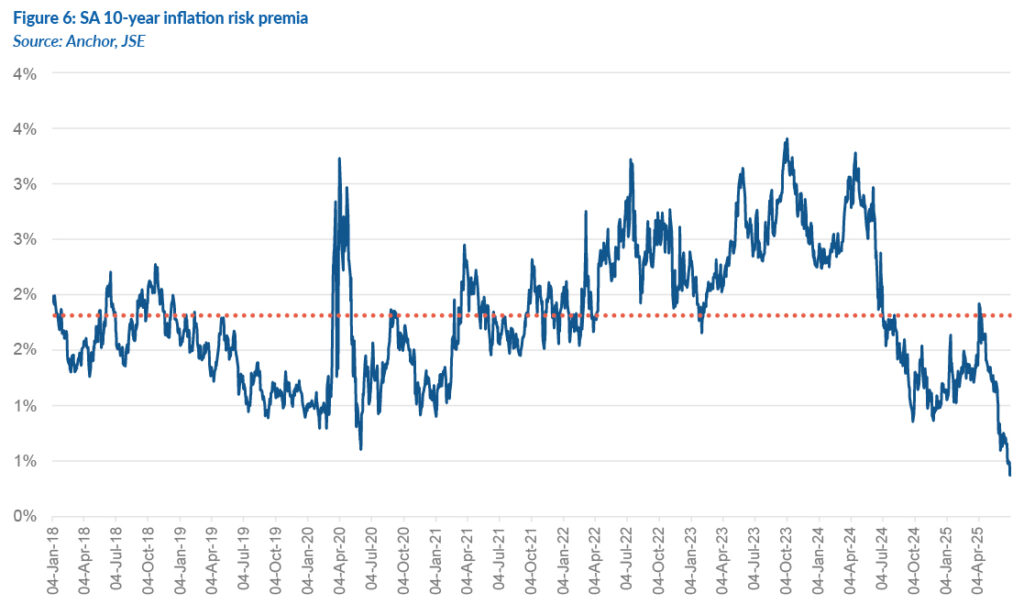
Conservatively, if the 10-year inflation risk premium remains at its long-term average of the mid-to-high 1% range (which theoretically it should not if the inflation target is lowered), we expect the 10-year BEIR to decline by a further 50 bps from current levels. If the inflation risk premium compresses further, the 10-year BEIR should rally more strongly (Figure 6).
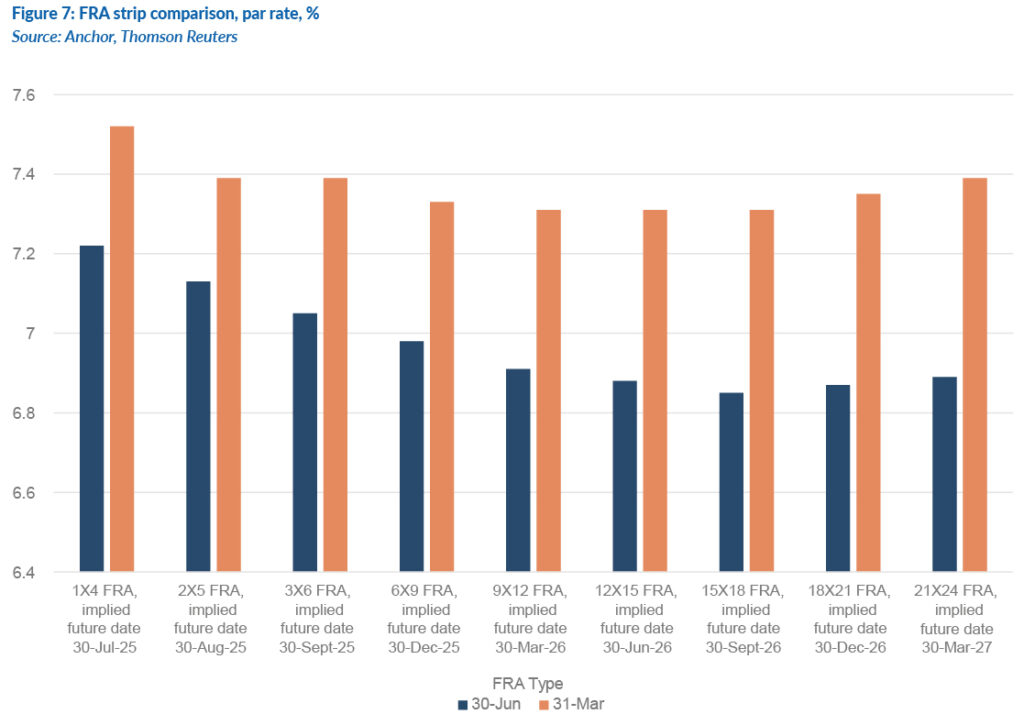
In recent months, we have gradually increased duration across many of our domestic fixed income portfolios through bond selection and taking advantage of lower inflation expectations and curve steepness. We see particular value in the 10–15-year maturity space. In terms of the interest rate outlook, the derivatives market anticipates the policy rate will bottom at 6.75%, down from 7.25% at the end of 1Q25 (Figure 7). This shift reflects growing confidence in a more accommodative monetary policy path amid a benign inflation environment.
SAGBs continue to offer some of the highest yields in the EM universe, both in nominal and real terms. However, these elevated yields also reflect ongoing concerns about SA’s fiscal sustainability. With local politics on a knife-edge and in the absence of credible, sustained commitments to expenditure reduction and broader fiscal consolidation, a meaningful decline in SAGB yields remains unlikely. Consequently, the yield curve is expected to retain its steep bias. We estimate that domestic bonds could return around 12% over the next 12 months, providing a real return of c. 8%.
THE RAND
Anchor subscribes to a purchasing power parity (PPP) model for the long-term value of the rand. Any such model clearly shows that the local unit is cheap, as is evident from Figure x below. Our modelled fair value of the rand is in the R13.96-R15.96/US$1 range. The currency usually trades away from its “fair value”, and it is reasonable to expect it to remain cheap for the foreseeable future.
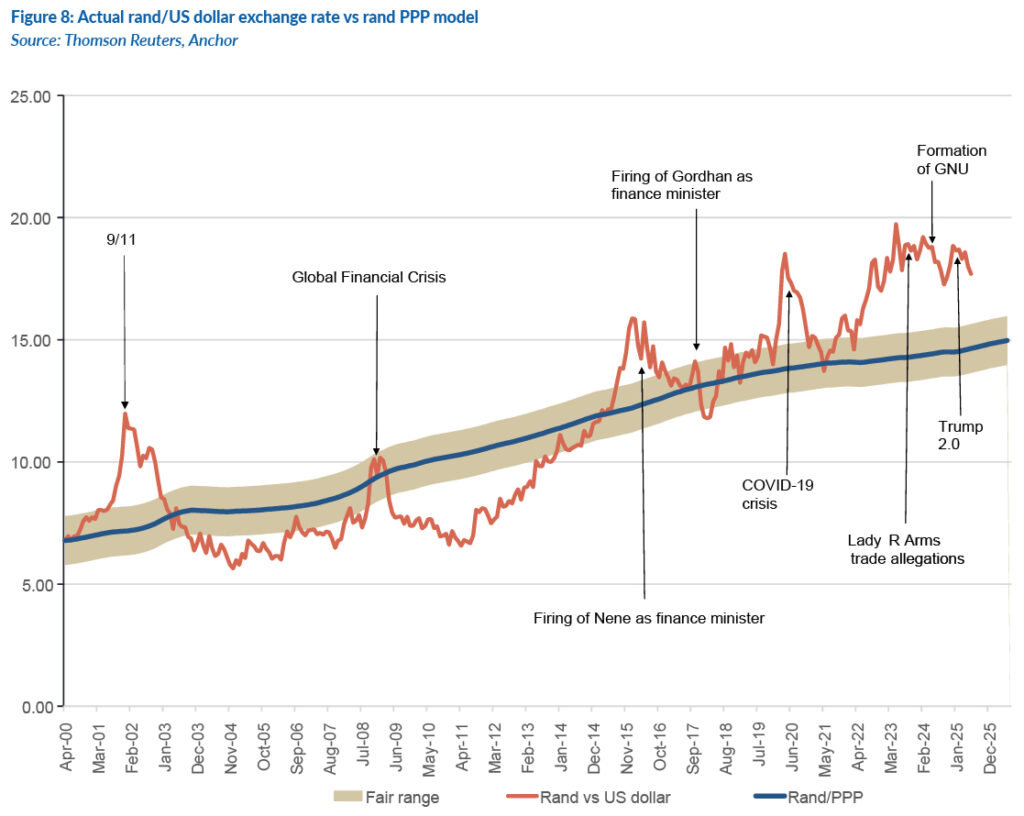
The rand is benefitting from the lower oil price, with our terms of trade (which measure the ratio of a country’s exports relative to imports) being the most positive that it has been in the past 25 years. It is reasonable to expect a strong trade surplus and some support for the rand. Simultaneously, the US dollar has been weakening as the US heads into its interest rate-cutting cycle, and US growth momentum is slowing down.
We are seeing increasing support for the narrative that the US dollar will likely weaken further. Some analysts expect the euro to strengthen by a further 3% to 5% against the dollar.
This is a volatile time, and many risk factors could weaken the domestic currency. However, we believe a further recovery is likely and we expect the rand to end the year closer to R17.40/US$1. We have modelled this exchange rate for the report, reflecting our view of a continued modest recovery for the South African rand.
GLOBAL EQUITIES
2025 has been a reminder of what really matters for equity markets, and that is expectations for future economic and earnings growth. Global geopolitics, the 12-day war between Israel and Iran, and the US bombing of Iran hardly saw the market flinch. It has remained firmly focussed on positive earnings growth and bounced back from the close-to-double-digit drop on the now-infamous Trump “Liberation Day” tariff announcement in April. We expect a 10% return from global equity markets in the next 12 months, following the 9.8% return in the first six months of 2025.
The two simplest graphs to illustrate what the market is seeing are the following. The first is the expectation that global GDP growth will accelerate into 2026 and beyond (at a 3%-plus rate) following a tariff-fuelled slowdown in growth in early 2025.
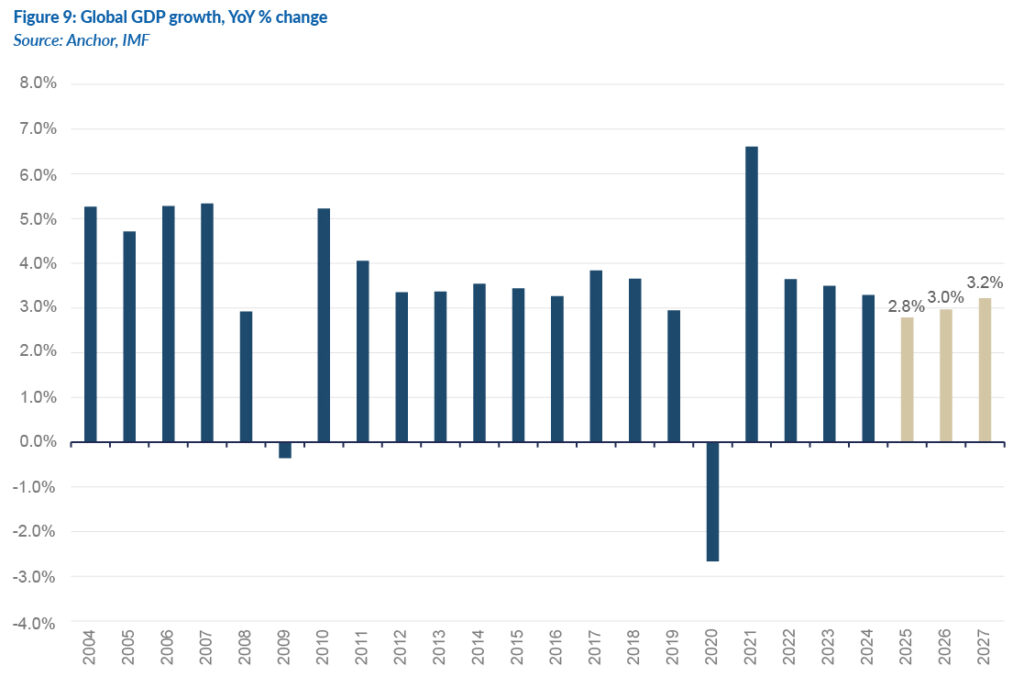
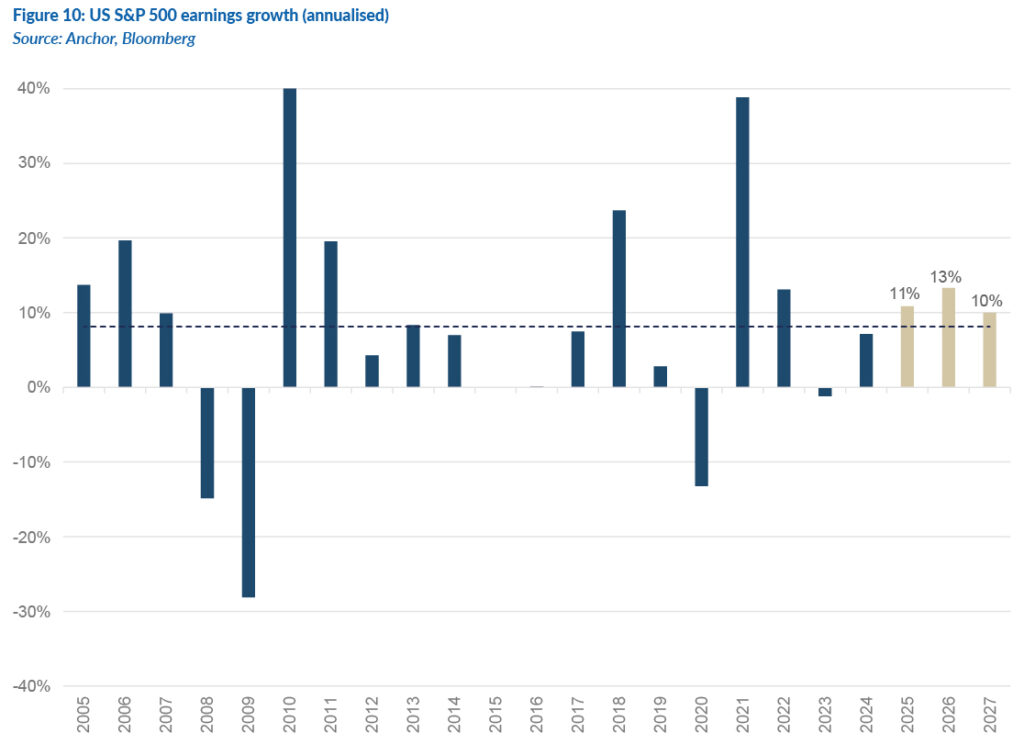
Figure 10 below shows historic and projected annual earnings growth for the US S&P 500. Market consensus is for two consecutive years of double-digit earnings growth from the US market following 11% in 2025.
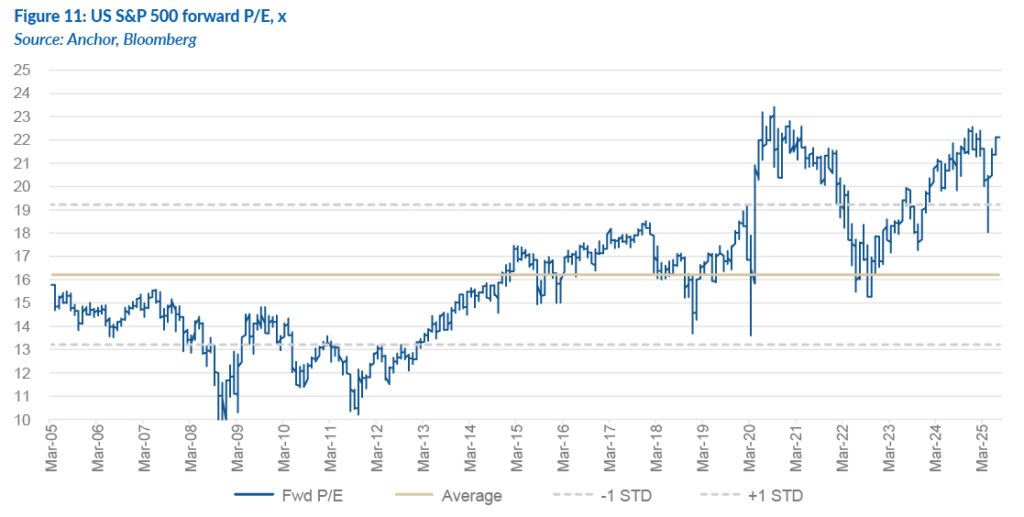
The market tends to do well when future growth expectations are positive, and this is what is driving the market higher. But this is where a positive view on the market gets challenged – the market strength of the past two years has resulted in, on average, much higher valuation ranges. The current forward 22x P/E on the S&P 500 is very high by historic standards and represents an equity risk premium of around zero.
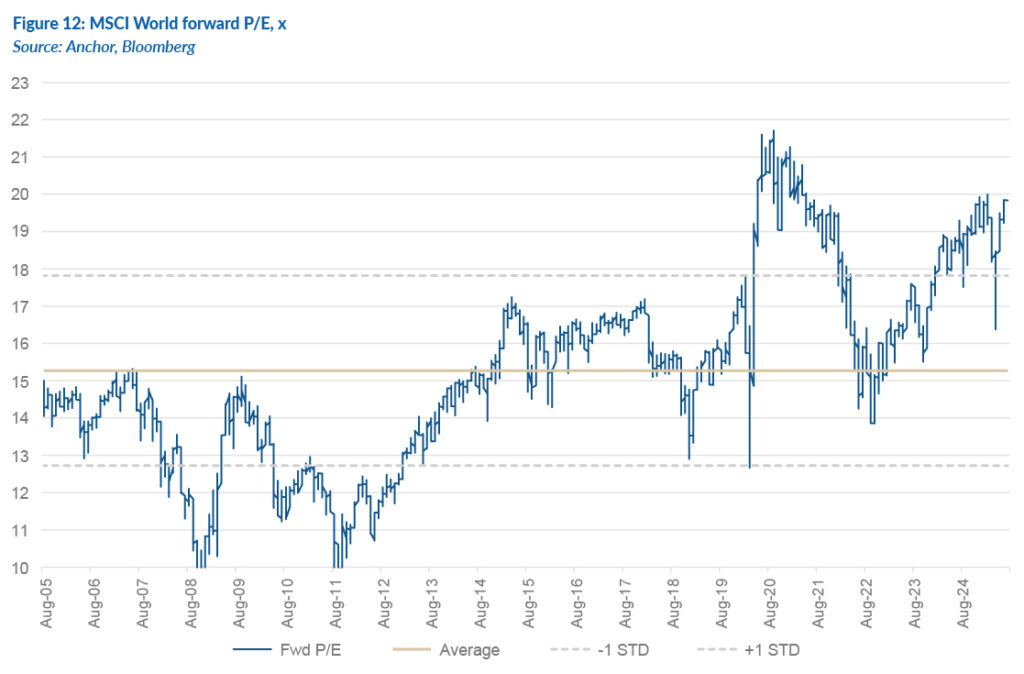
Non-US markets have offered a cheaper entry point into DMs for the last few years, but the outperformance of the non-US shares has also seen the MSCI World reach expensive territory, at a forward 20x P/E.
The biggest factors behind the market’s resilience this year are:
- Interest rates are high. Interest rates are at historically high levels, and the Fed can materially reduce interest rates if there are any signs of an economic slowdown.
- The dollar is weak. It appears that the weakening of the US dollar was Trump’s intention. The material 11% weakening of the US Dollar Index this year means that exports are more profitable, and the 30% of global earnings for US companies are converted into higher dollar profits.
- Artificial intelligence (AI) is real. The market volatility has somewhat muffled all the excitement about AI and new technologies. We should not forget that the new AI wave is hugely significant for investments, and you want exposure as an investor. This is a time to be invested in the technology space, which is now more than 40% of the market.
- Trump is pro-market. Taxes will remain low in the US, and the government is on a mission to reduce regulations. For example, smaller banks will probably be given more latitude to lend money to US consumers. Trump and his financial advisors will argue that they are only partway through their plan and the good stuff is still to come.
The market backdrop is positive, but faith has to be sustained at these valuation levels. As always, market corrections are a possibility if economic conditions decline. The economy has been robust considering the tariff uncertainty, and these signs will be watched closely. In the coming weeks, self-imposed tariff deadlines will be reached. Still, for now, the market’s reaction to tariff declarations is more muted, and the general expectation is for an eventual reasonable outcome.
We would increase our allocation to alternative investments, which include private equity, property, private debt, structured products and hedge funds. In times of uncertainty, these more stable asset classes become increasingly attractive, and declining interest rates make the returns even more relatively attractive. Anchor has a range of private capital alternative funds which are ideal for times like these.
GLOBAL BONDS
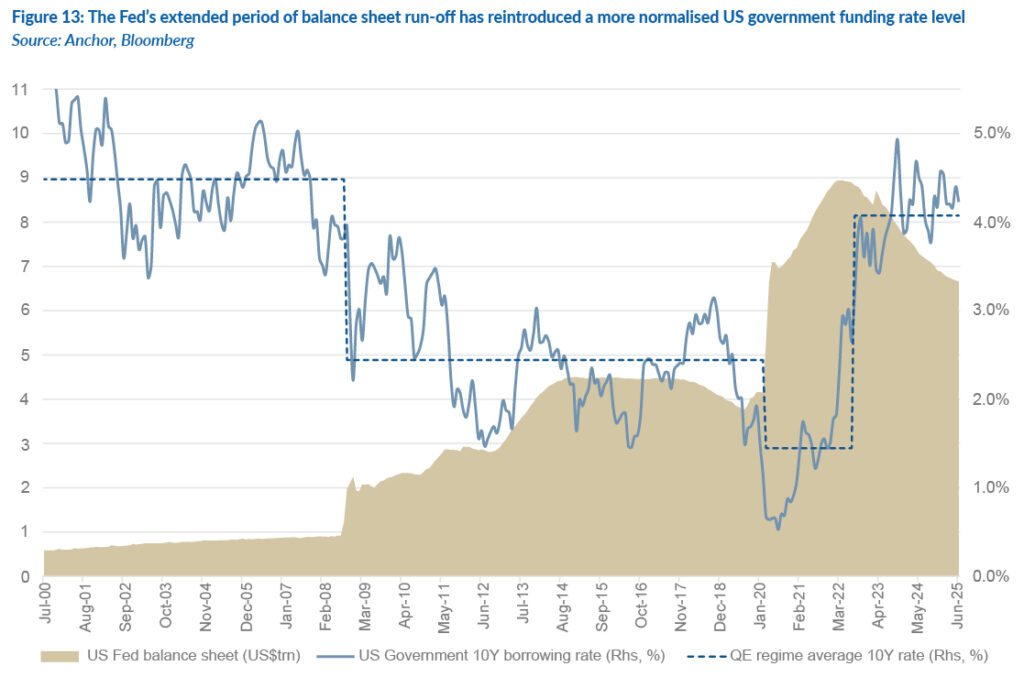
For the past two to three years, the US government’s 10-year borrowing rate has spent most of the time above 4% p.a., occasionally edging towards 5% p.a., but generally staying closer to 4% p.a. We believe this new equilibrium is a sustainable level now that the US Fed’s balance sheet is no longer aggressively impacting the rate. In the wake of the GFC, the Fed first started to use quantitative easing (QE) as a meaningful part of its monetary policy toolkit, injecting liquidity into a frozen funding model by increasing the size of its balance sheet five-fold (from US$0.9trn to US$4.5trn) in the years following the GFC. The Fed had just started unwinding the unprecedented balance sheet expansion when COVID-19 hit, and its response was to more than double the balance sheet again, taking it to its peak (US$8.9trn) in less than two years. The Fed is now more than 3 years into its most successful balance sheet unwind ever, having shrunk its balance sheet holdings by 25% over that period (to US$6.7trn). During the two periods of elevated Fed balance sheet holdings, US government borrowing rates remained extremely depressed. We see the recent increase in US government funding rates as a return to a more normal and sustainable level.
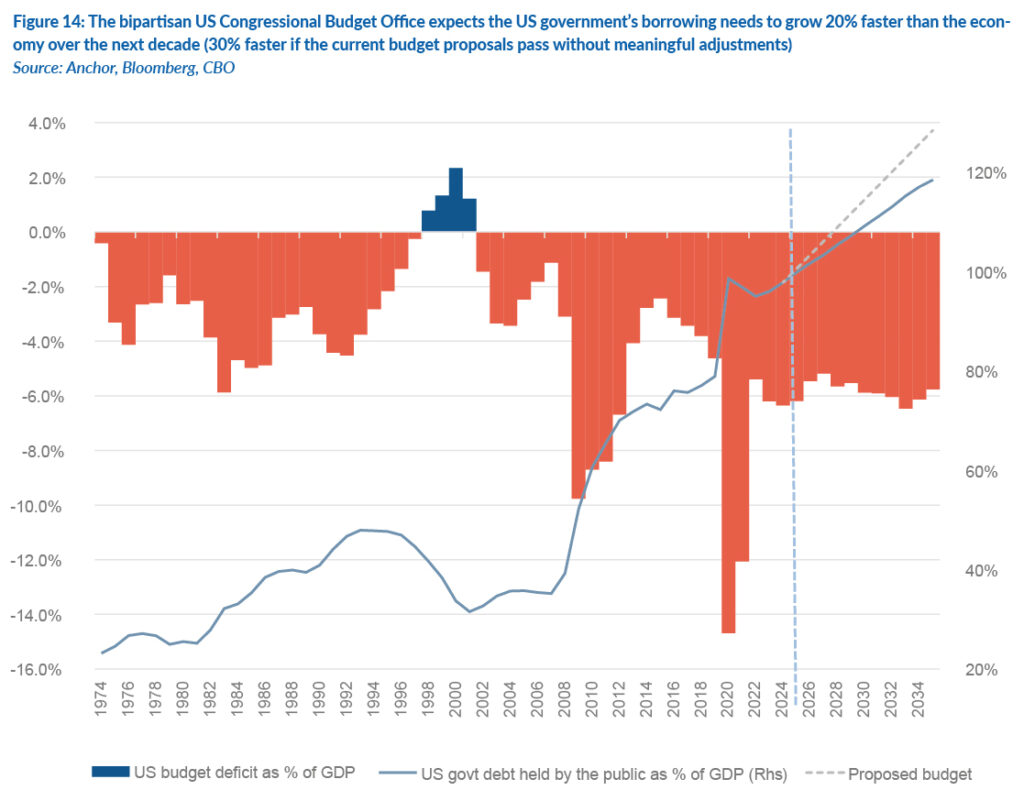
The actions of the current US administration’s policies and rhetoric have raised questions about the ongoing willingness of investors, particularly foreign investors, to fund the US’s increasing borrowing needs. These concerns include questions around the sanctity of US Fed’s independence in the wake of Trump’s calls for Fed chair, Jerome Powell, to resign; concerns around the impact that the abrasive nature of Trump’s tariff policies will have and concerns around the apparent lack of fiscal responsibility associated with the US president’s most recent budget proposal, (which could increase the US government’s debt pile by US$3.2trn over the next decade).
Ultimately, we are not convinced that any of these factors, individually or in concert, will materially impact the US government’s funding rate over the next twelve months. This leaves us to conclude that the current US 10-year government bond yield will remain anchored between 4.0% and 4.5% p.a., providing investors with a c. 5% total return in US dollar terms.
The spread that investors demand for the risk of lending to the most creditworthy (investment-grade) corporate borrowers, is back to an all-time low of 0.8% p.a. While we are not anticipating an accelerating wave of defaults, we worry that the more normalised interest rate regime, combined with some potential trade disruptions could increase default levels from their current lows. As such, we think there is scope for a slight widening in credit spreads from historical lows. This should leave investors in high-grade US dollar corporate bonds with a 12-month total return of c. 5%.
GLOBAL PROPERTY
Global DM listed property had a decent start to the year (FTSE/EPRA NAREIT Global Property Index +6.9% YTD). However, as has been the case for the past three years, it has underperformed equities by some margin, with the total return in US dollar terms for the DM Real Estate Investment Trust (REIT) Index over the past 3 years (+4.5% p.a.) well below the 18.8% p.a. that the MSCI World Index has delivered over the same period. While this period of relatively lacklustre returns might lead us to believe that there are strong prospects for future growth, that does not yet seem to be the case. The listed property sector should deliver most of its total return to investors in the form of dividends, and analysts expect the asset class in aggregate to deliver similar dividends to investors over the next year as it was anticipating before the COVID-19 pandemic seriously disrupted how we live, work and shop. This is despite the fact that we are in a significantly higher interest rate environment now than we were pre-COVID-19.
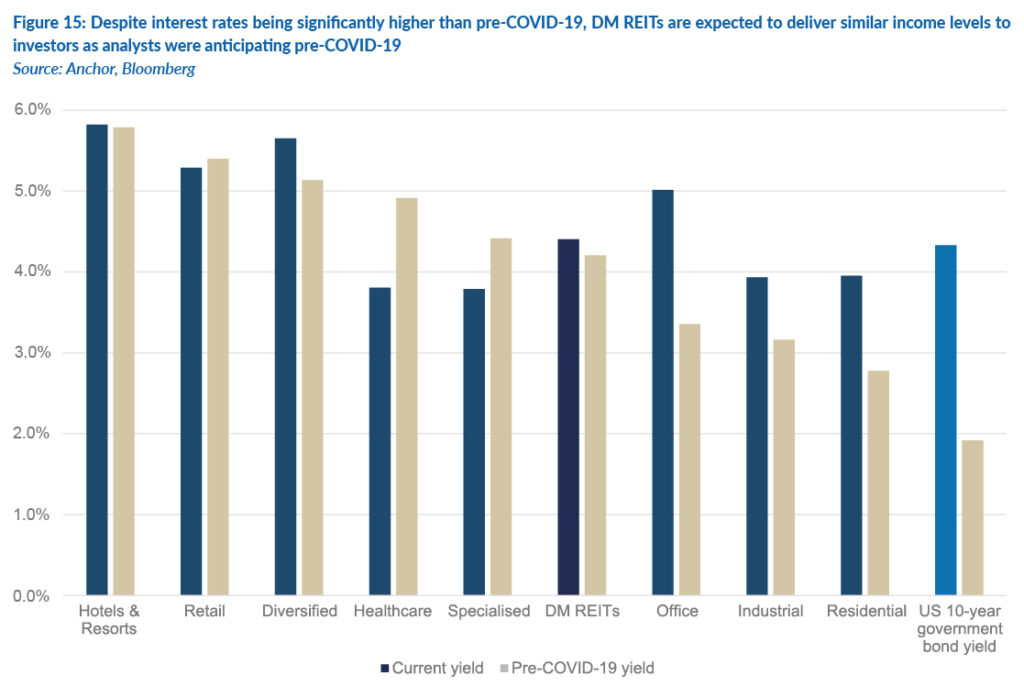
So, with investors able to achieve decent income in the fixed income markets relative to the low-rate environment pre-COVID-19, the prospect of eking out the same yield from REITs seems less appealing. This is also at a time when the possibility of income growth is challenged by many structural headwinds in the traditional REIT sectors, with remote working and online shopping impacting the demand for office space, retail space and even residential space located in cities. This has left us underwhelmed by the sector over the past few years. However, we anticipate that a normalising rate environment, along with a reset in the supply-demand imbalances created by these structural shifts, will ultimately produce a better environment for listed property investors, who at this stage need to focus on specific companies operating in niches that are not as impacted by the macro picture. In the meantime, we anticipate investors in the asset class will achieve an aggregate total return of 6% to 7% in US dollar terms over the next twelve months.