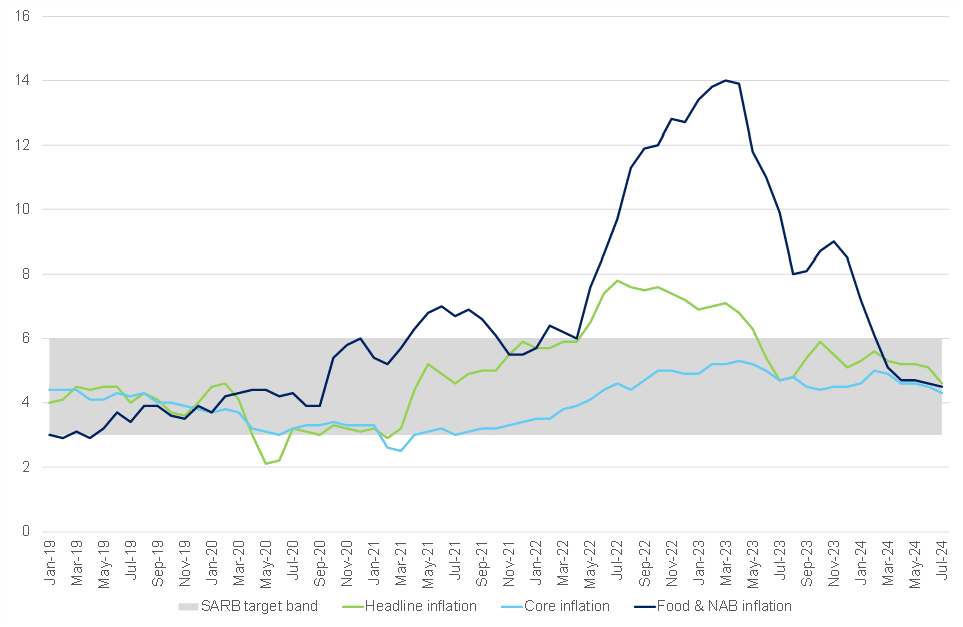
After remaining steady in the 5%–6% range for ten months, July headline inflation, as measured by the Consumer Price Index (CPI), eased to 4.6% YoY – down from 5.1% YoY in June. This marks the lowest inflation rate in three years, matching the annual 4.6% rate recorded in July 2021. The decline was driven by lower annual rates across several product groups, particularly in food and non-alcoholic beverages (NAB), transport, and housing and utilities. Core inflation (excluding the more volatile price categories of food, fuel, and electricity) came in at a muted 4.3% YoY, below estimates of a 4.5% YoY print. In recent months, core inflation has remained relatively stable, consistently hovering around the midpoint of the South African Reserve Bank’s (SARB) target band. Occasional increases in core inflation, particularly from sectors like medical insurance and financial services, appear to be more related to post-pandemic normalisation rather than demand-driven inflationary pressures. While these isolated upticks are worth noting, they do not seem to jeopardise the overall stability of core inflation. This resilience is due to several factors, including the limited pass-through of exchange rate fluctuations to consumer prices, subdued demand conditions, and, importantly, the credibility and effectiveness of the SARB’s monetary policy framework – despite the pressures consumers feel due to elevated interest rates.
Figure 1: SA inflation, YoY % change

Source: Stats SA, Anchor
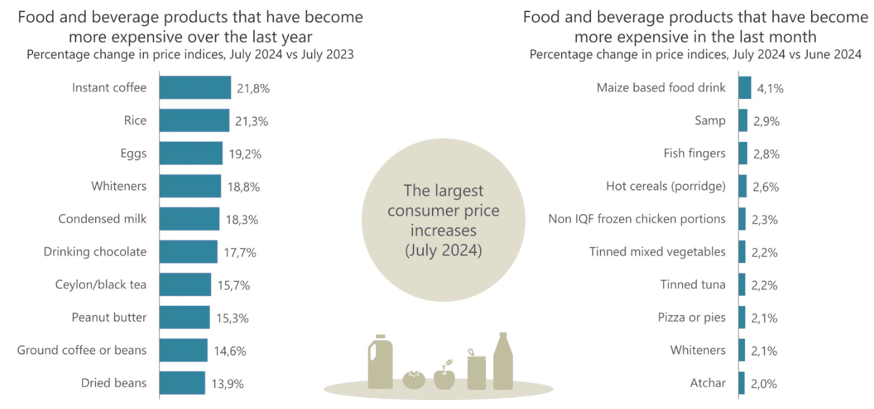
The annual inflation rate for food and NAB eased to 4.5% YoY in July, down from 4.6% YoY in June. This marks a continued slowdown from its recent peak of 9.0% in November 2023, bringing it to its lowest level since September 2020, when it printed at 3.8% YoY. Despite the overall decline in food inflation, the bread and cereals category is showing an upward trend, with an annual increase of 5.6% YoY in July – up from 5.2% YoY in June. Notable YoY price increases in July included rice (up 21.3%), pizza or pies (up 11.6%), and samp (up 6.9%). Meat, the most heavily weighted food group in the inflation basket, accounting for just over one-third of household food spending, saw its price index decline by 0.4% MoM, with a modest annual increase of 1.0%. Food and non-alcoholic beverage (FNAB) inflation has consistently declined over the past year, from November 2023’s peak of 9.0% YoY to 4.6% in June of this year. This decrease is due to several factors, including a moderation in bread and cereal prices, the resolution of supply disruptions in the poultry sector, and the stabilisation of vegetable prices after irrigation issues.
Additionally, base effects from 2023’s high inflation rates have contributed to the apparent slowdown in price increases. While the overall trend indicates improving food price stability, persistent inflationary pressures in certain food items and recent increases in categories like meat and vegetables show that challenges remain in fully stabilising food prices across the board. We expect a favourable food inflation environment in the near term, driven by declining grain and cereal prices, as the effects of the El Niño weather phenomenon diminish. Millers have absorbed higher input costs, limiting the impact on retail prices. Additionally, subdued consumer demand has also restricted producers’ ability to pass on elevated costs to retailers. In the meat sector, inflationary pressures are expected to stay low, barring any seasonal increases toward the end of this year, mainly due to weak demand, which has constrained producers’ pricing power.
Figure 2: Food and beverage products that recorded the most significant annual and monthly price increases in July

Source: Stats SA
Except for public transport, most categories within the transport group experienced lower annual inflation rates, including new and used vehicles, running costs, and fuel. Consequently, annual transport inflation eased to 4.2% in July, down from 5.5% in June. Fuel prices decreased for the second consecutive month, dropping by 3.6% YoY in July, following a 4.6% YoY decline in June. Inland 95-octane petrol was ZAc99 cheaper, falling from R24.25 in June to R23.26 in July. Similarly, the average diesel price decreased by ZAc41 during the same period – from R23.76 to R23.35.
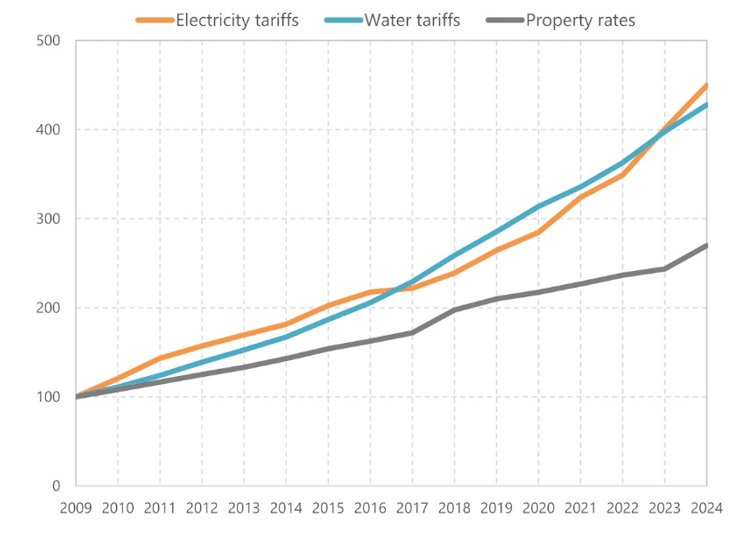
Notably, July is a high survey month for inflation as it includes the annual survey of municipal tariffs for water, property rates and electricity. This year, the electricity price increase, at 13% YoY, pushed the housing and utilities component’s contribution to inflation higher to 0.6% MoM, which was partly counteracted by some lower pressures. Interestingly, YoY tariff increases were more moderate in 2024. Electricity tariffs rose by 12.1%, down from 15.3% in 2023; water tariffs increased by 7.5%, compared to 9.6% in 2023, and property rates went up by 10.7%, compared to 8.4% in the previous year. Looking at tariffs over time, electricity prices have seen the most significant increase over the past 15 years, with an average annual growth rate of 10.5% from 2009 to 2024. This outpaced the average growth in water tariffs, which rose by 10.2% p.a., and property rates, which increased by 6.8% p.a. over the same period.
Figure 3: Price indices for municipal tariffs, 2009-2024

Source: Stats SA
Looking ahead, we anticipate a further decline in inflation over the remainder of 2024, potentially dropping below 4.5% YoY by 4Q24. This anticipated decline in inflation, along with expected interest rate cuts starting towards the end of this year, is likely to boost consumer sentiment further. Naturally, the timing and extent of these anticipated rate cuts depend on the inflation outlook (locally and abroad) and global interest rate developments as we progress towards the end of the year. At this stage, we expect an initial rate cut of 25 bps in September, followed by a further 50- to 75-bp worth of cuts in 2025 and leading into 2026.


