Executive summary
The latest US personal consumption data (through December 2021) show that US consumption is still slightly elevated relative to the 10-year trajectory pre-pandemic, though with very different trends in goods and services spending. These include:
- Significant overspending on durable goods (c. 23% overspending), with the biggest spending beneficiaries by segment being:
- Used cars (c. 53% overspending).
- Sports equipment and guns (c. 28% overspending).
- Recreational vehicles (c. 54% overspending).
- Jewellery (c. 45% overspending).
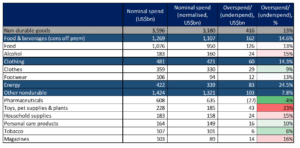
- Mid-teen overspending on non-durable goods, with the following categories standing out:
- Energy – this is primarily a function of higher energy prices (c. 25% overspending).
- Toys and pet supplies (c. 23% overspending).
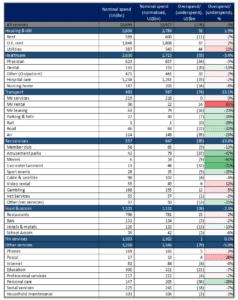
- Slight underspending on services (c. 3% underspending), which is concentrated in underspending on:
- Transport (20%-30% underspending) related to buses, trains, taxis, flights, parking, and tolls.
- Live entertainment (25%-70% underspending), including movies, amusement parks, live shows, and sporting events.
- Personal care (c. 28% underspending), including hairdressers and personal grooming services.
The US savings rate was significantly elevated during the pandemic, with Americans, in aggregate, saving c. US$2.5trn more than usual since the start of the pandemic (this is roughly equivalent to the amount they would typically have saved over 2 years). While we expect the spending trends to revert towards their pre-pandemic trajectory at some point, the timing is tricky. Americans could use the excess savings they have accumulated during the pandemic to maintain the current overspending on goods for at least three years.
Factoring in the capex of US corporates, we see:
- Meaningful overspending on PCs (25%).
- Spending on transport equipment running at almost half its pre-COVID trajectory
Detail
US personal consumption dropped c. 15% below its pre-COVID trajectory in 2Q20 at the start of the pandemic. However, fiscal stimulus helped spending accelerate above its pre-COVID trajectory by mid-2021 and by the end of 2021, US personal consumption was c. 3% ahead of its pre-COVID trajectory.
Figure 1: US personal spending has recovered from the initial shock at the start of the pandemic and current spending is above trend [US$bn SAAR]
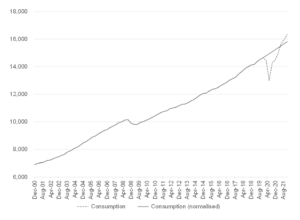
Source: Anchor, Bloomberg
Services spending dropped 20% below trend at the start of the pandemic but had recovered to within c. 3% of its pre-pandemic trend by the end of 2021. Goods spending fell by 7% at the start of the pandemic but recovered quickly and by the end of 2021 was operating 14% ahead of the pre-COVID trend (and 19% ahead of the trend for spending on durable goods).
Figure 2: Spending patterns have shifted since the pandemic started, with spending on services still slightly depressed and spending on goods well above trend, [US$bn SAAR]
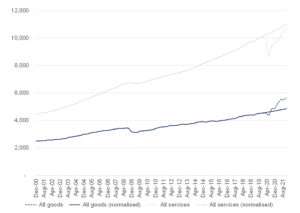
Source: Anchor, Bloomberg
The worst of the pandemic movement restrictions seem to be behind us, ushering in the potential for more normalised spending patterns to return. We look at the current run-rate spending in various categories relative to the trajectory those categories were on for the 10-years pre-pandemic to assess which areas are experiencing significant overspending or underspending.
Figure 3: Overspending on goods is more pronounced than underspending on services
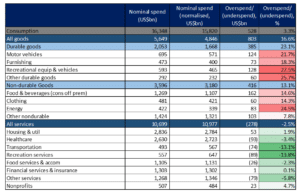
Source: Anchor, Bloomberg
Overspending on durable goods seems to be pervasive across all categories and, while non-durable goods spending is also elevated, the non-durable category that sticks out most is energy spend, which is arguably less discretionary than other categories and is likely to be primarily driven by higher energy prices. Within the durable goods spending categories, a more granular look at spending highlights the key contributors to overspending as being:
- Used cars.
- Sports equipment and guns.
- Recreational vehicles.
- Jewellery.
Figure 4: Overspending on durable goods is skewed towards used cars, recreational vehicles, and jewellery
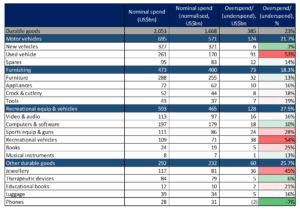
Source: Anchor, Bloomberg
Amongst non-durable goods spending, most categories have room for a mid-teen reduction in spending towards more normalised levels. Toys and pet supplies is the category most likely to see the biggest correction in the event of a normalisation in spending patterns (unless of course increased pet-ownership during the pandemic is a trend that is not going away).
Figure 5: Non-durable goods categories are likely to see a mid-teen drop in spending across the board as spending patterns normalise
Source: Anchor, Bloomberg
Spending on services takes by far the biggest share of wallet from American consumers (c. two-thirds pre-pandemic) and includes many areas that were significantly impacted by movement restrictions related to the pandemic. Some of these are almost back to their pre-COVD spending trajectory, including spending on:
- Meals and drinks at restaurants and bars.
- Hospital care.
Figure 6: Spending on hospital care and eating and drinking at restaurants and bars has reverted to its pre-pandemic trajectory, [US$bn, SAAR]
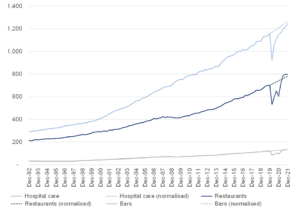
Source: Anchor, Bloomberg
Other areas are still seeing significant underspending relative to their pre-COVID trajectory, these include spending on:
- Flights, buses, taxis, parking, and tolls.
- Live entertainment such as movies, amusement parks, sporting events and live shows.
- Personal care (hairdressers etc.).
Figure 7: Spending on services has largely normalised across many categories, the exceptions being live events, personal care, and travel
Source: Anchor, Bloomberg
The US savings rate was significantly elevated during the pandemic, with Americans in aggregate saving c. US$2.5trn more than usual since the start of the pandemic (this is roughly equivalent to the amount they would typically save over 2 years). While we expect the spending trends to revert towards their pre-pandemic trajectory at some point, the timing is tricky. Americans could use the excess savings they have accumulated during the pandemic to maintain the current overspending on goods for at least three years.
Figure 8: Americans have accumulated excess savings of c. US$2.5trn as fiscal stimulus allowed them to save at a significantly higher rate than pre-pandemic
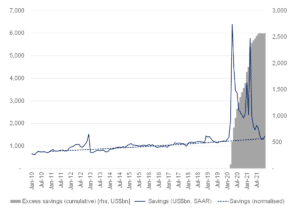
Source: Anchor, Bloomberg
Consumers have not been alone in developing unusual spending patterns since the start of the pandemic. Business spending habits were also altered. Areas that stand out here are:
- Meaningful overspending on PCs (25%).
- Spending on transport equipment running at almost half its pre-COVID trajectory.
Figure 9: Corporate spending on PCs is elevated, while spending on transportation equipment is significantly below trend
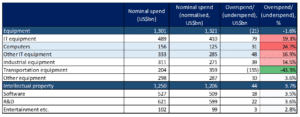
Source: Anchor, Bloomberg