Summary:
In the July Anchor Fixed Income monthly, we look at yield curve movements YTD (Figure 1) of South African (SA) government bonds. We highlight that yields are being dragged lower by global factors and low inflation, but the SA bond market continues to show strength YTD and, even though SA bonds have strengthened recently, they remain attractive, particularly in a global search for yield. This is due to the fact that:
- The fall in global yields has been sharper than the decline in SA yields; and
- this can be seen by looking at the yield difference between SA and the US, which is widening out.
Real yields should remain elevated as upward inflationary pressure remains subdued in the medium term providing further support to the SA bond market, although we do expect local credit spreads to widen. Figure 2 shows how the SA 5-year and 10-year bonds were the ideal place to be positioned for these gains.
In Figure 3, we demonstrate that while local bond yields have dropped, US bond yields are falling faster and the gap between local and US bonds is increasing, making SA relatively more attractive vs the US. This is particularly true in a world where global credit spreads have been coming down (including that of SA) as can be observed from Figure 5. Fundamentally SA bonds are cheap (Figure 7), and we believe that local bonds may remain cheap for a while. We therefore reiterate our view that local bonds remain attractive in the medium term.
The SA yield curve
Figure 1 demonstrated that yields started this year on the yellow star, shifted down to the green star a month ago (around June) and are currently at the red star. While it feels like we are in a difficult environment, yields are on their way down and bonds are strengthening due to global factors.
Figure 1: SA government bond yields summary statistics
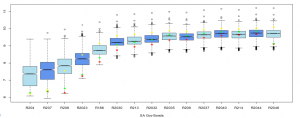
Source: Anchor, Thomson Reuters
The belly of the curve remains the sweet spot in the government bond space, showing the most gains as investors position for rate cuts.
Figure 2: Basis-point move in SA yield curve
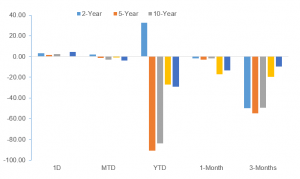
Source: Thomson Reuters
SA yield spread to US yields
SA bonds remain attractive amid a rally in local bonds YTD.
Figure 3: SA 10-year vs US 10-year
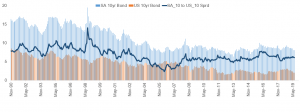
Source: Thomson Reuters
SA yield curve level
However, the short end of the curve appears to have been overbought as investors position for possible future SA Reserve Bank (SARB) interest rate cuts.
Figure 4: R186/ R209 spread
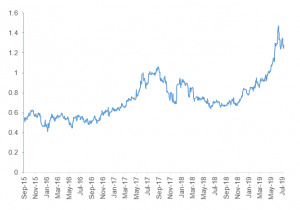
Source: Thomson Reuters
SA sovereign credit spread
Although SA’s credit default swap (CDS) spread has experienced a drastic shift downwards, it appears to be moving in line with other emerging market (EM) economies.
Figure 5: CDS spreads of selected EMs
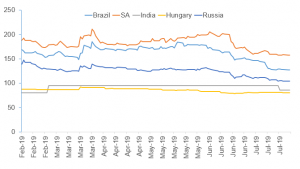
Source: Thomson Reuters
Inflation
Inflation dynamics are expected to remain in line with the SA Reserve Bank’s (SARB’s) rate-cutting path, which is supportive of bonds.
Figure 6: SA core vs headline CPI
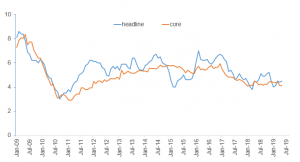
Source: Thomson Reuters
Fair yield
The lower domestic inflation rate means that bonds remain attractive against measures of their fundamental value.
Figure 7: SA 10-year fundamental bond
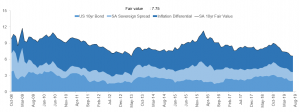
Source: Thomson Reuters