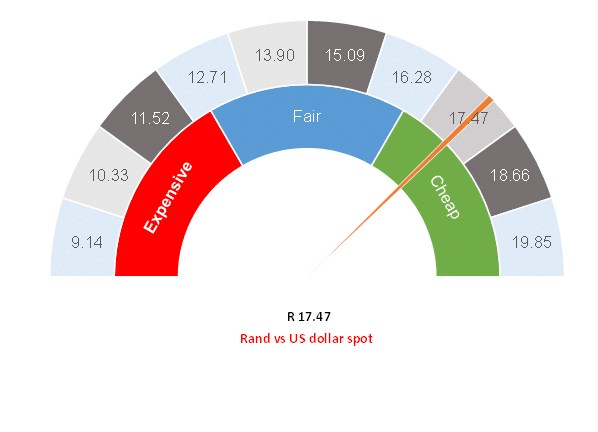
Figure 1: Rand vs the US dollar

Source: Anchor
The rand has strengthened to R17.50/US$1 over recent weeks as the inevitability of domestic and global interest rate cuts became apparent, with the local unit being admittedly stronger than we had anticipated for 3Q24. This week’s events calendar was also packed, with the local inflation data, released on Wednesday (18 September), being overshadowed by the US Federal Reserve’s (Fed) 0.5% interest rate cut that evening (SA time). On Thursday (19 September), it was the turn of the South African Reserve Bank (SARB) to announce its first interest rate cut of the cycle.
Looking at the US Fed and using the tortoise and the hare analogy, it seems that the Fed is the hare of central banks. Its communication of the interest rate cut was secondary to the focus on the dot plot, where the various Fed governors indicated their expectations for future interest rates. They estimate the long-term neutral interest rate to be a sliver under 3%, broadly consistent with prior communications. This seems to imply c. 1.75%-2.00% in US interest rate cuts. The various Fed governors have seemingly indicated that interest rates will get to the neutral rate faster than previously suggested. So, in essence, the Fed communicated that the destination for interest rates is unchanged. However, the Fed has hit the accelerator in terms of interest rate cuts in order to get there sooner.
Perhaps this is good news for risk assets as the Fed does not seem to fear a US recession at this stage. Ongoing US economic growth will support equity markets and it also appears that the Powell put is back. The Fed has the space and the willingness to support US equity markets with interest rate cuts if necessary. The announcement of a ‘mission accomplished’ on inflation and a shift towards a focus on full employment should be good news all around.
While the Fed might be the hare in our analogy, the SARB is the tortoise of central banks. The SARB made it clear that the neutral interest rate is unchanged at 7% (implying a rate-cutting cycle of 1.25% in SA). Unlike the accelerating Fed, the SARB sees no point in rushing rates to lower levels, and instead, it believes that a gradual data-driven approach is the most appropriate. Slow and steady will win the race for the SARB. In our view, this makes a lot of sense as the risks to inflation are higher in SA. Eskom’s desire for an astronomical electricity tariff increase of 36% makes a mockery of the SARB’s mandate to move inflation toward 4.5%. Over the short term, the SARB will find that lower petrol and food prices and a stronger rand will make its job easier. Those are, unfortunately, just temporary tailwinds for the SARB. Nevertheless, toward the end of next year or early 2026, we think the repo rate will be cut to just below 7%, leaving the prime interest rate at c. 10.25%.
Unfortunately, we expect interest yields on the income investments to decline as interest rates are cut. The estimates of running yields after the rate cuts on 19 September 2024 are as follows:

We also point out that the fixed-income and currency market reactions to the interest rate cuts have been relatively muted. It seems that markets were reasonably forward-looking and got this one right.
Looking further into the future, we believe that factors continue to favour a stronger rand. Domestically, we are seeing an uptick in confidence as loadshedding seems to have disappeared for now. We also see evidence that our local politicians can put aside some of their differences to make the Government of National Unity (GNU) successful. We have already seen some positive steps taken in this regard.
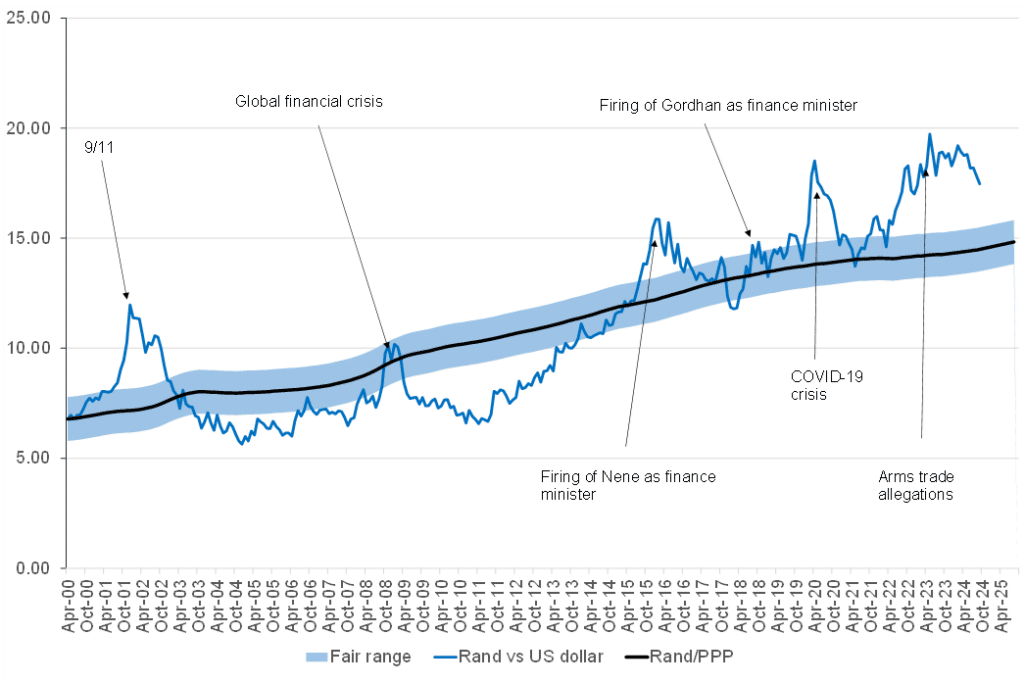
Globally, an interest rate-cutting cycle from most developed markets (DMs) will continue to support the rand. Perhaps our only worry is that China’s economy does not appear to be able to escape its current quagmire. From time to time, we may also see negative market sentiment toward the emerging market (EM) complex. That said, the path of least resistance for the rand is a slow grind stronger from current levels, albeit with bouts of volatility.
Figure 2: Actual rand/US$ vs rand PPP model

Source: Thomson Reuters, Anchor


