Bond markets, by nature, are forward-looking – prices reflect what investors think will happen to the economy in the future. Currently, a rare and powerful trend is unfolding in US bond markets. Since 1982, there have been three cases of a bear steepening during periods of a broader yield curve inversion, including the current one. It has happened on three occasions:
- September 2000.
- May-June 2007.
- July 2023 to the present.
On the first two occasions, a late-cycle bear steepener was observed just before a severe market and economic downturn. Today, many parts of the global economy are slowing down, and a bear steepener will accelerate the tightening effect, raising the risk of something systemically breaking.
What is a bear steepening yield curve?
A bear steepener is a term used to describe a situation where the yield curve rises, but yields on long-dated bonds rise more than those on shorter-dated bonds. A yield curve is a plot of yields for bonds of the same quality but with different maturities.
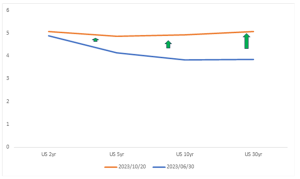
Figure 1 illustrates the bear steepening of the US yield curve from 1 July to 20 October 2023. In this period, the 2-year, 10-year, and 30-year US bond yields rose by 18 bps, 108 bps, and 122 bps, respectively.
Figure 1: US Treasury yield curve: Bear steepening since the start of 3Q23, %

Source: Reuters, Anchor
What is an inverted yield curve?
One of the most widely used measures of inversion (or steepening) is the difference between the yield on the 10-year US bond and the yield on the 2-year US bond, commonly known as the “2v10 spread”. Typically, the 2v10 spread is positive, indicating an upward-sloping yield curve. In some ways, an upward-sloping yield curve is the natural order. When the 2v10 spread turns negative, the yield curve is considered inverted, and a negative 2v10 spread is often seen as a precursor to a recession.
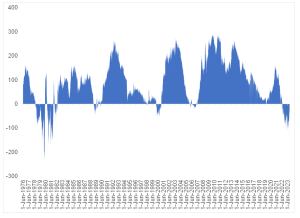
Figure 2: The 2v10 spread since 1976, bps

Source: The Federal Reserve Bank of St. Louis, Anchor
Figure 2 illustrates the 2v10 spread since 1976. Today, the US yield curve has been inverted since July 2022, and the inversion depth is quite unusual. To find something similar, one needs to go back to the early 1980s.
Figure 3: The 2v10 spread since 1976, bps

Source: Reuters, Anchor
Over the past four months, US bond markets have been on an aggressive and extended period of bear steepening of the inverted yield curve. Visually, the curve is flattening (or disinverting). The table in Figure 3 shows how the 2v10 spread has narrowed from -106 bps to -16 bps in just four months, while the 2v30 spread has turned positive over the same period.
In September 2000, a bear steepener was observed on an inverted US yield curve just before the start of a sharp stock market retreat – the fall in the Nasdaq in September 2000. In May and June 2007, a bear steepener was observed on an inverted US yield curve just before the systemic cracks in the US housing market became apparent in July/August 2007. In both cases, a bull steepener (the yield curve falls, but yields on short-dated bonds fall faster than the yields on long-dated bonds) followed to firmly disinvert (or steepen) the curve as the US Federal Reserve (Fed) pivoted.
So why is the US yield curve currently bear steepening?
There are several reasons behind the bear steepening of the US yield curve, and below, we briefly highlight a few of these reasons:
- First, the US fiscal outlook is deteriorating. Rising debt levels, growing budget deficits, and the short-dated debt maturity profile heighten refinancing risks. This pushes bond yields higher, especially long-dated yields.
- Second, incoming US economic data have consistently outperformed expectations, indicating that the US economy is more resilient than initially expected, and the Fed is thus likely to impose higher interest rates for a more extended period. This, in turn, leads to higher growth and inflation uncertainty, which increases the term premium. A higher term premium pushes long-dated yields higher.
- Third, the “higher-for-longer” narrative is gaining traction. This is closely linked to the second point. Consider the US 10-year bond yield as a strip of future Fed funds rates for the next decade, discounted to today. Although the US terminal rate was expected to be higher than 5%, the 10-year US bond yield remained below 4% for a considerable amount of time due to the prevailing yield curve regime, which was bear flattening (the yield curve rises, but yields on short-dated bonds rise faster than the yields on longer-dated bonds). The Fed would impose higher Fed funds rates for the first two years, while the market would anticipate lower economic growth and lower inflation from years 3 to 10. Consequently, the market priced in lower Fed funds rates during these years, converging at around 3% over time. However, recent Fed communication indicates a prolonged period of high Fed funds rates, fewer immediate rate cuts, a higher real Fed funds rate, and more robust economic growth. In response, the market is testing the Fed’s hypothesis by driving up the strips of future Fed funds rates, resulting in a new convergence level of c. 5% over time. Notably, this effect is more pronounced in the outer years, which explains the marginal increase in the 2-year US bond yield.
Why is a bear steepener dangerous?
It is important to note that bear steepeners are acceptable if the economy is healthy. It is good to have long-dated bond yields push higher to reflect the increase in growth and inflation expectations. However, a bear steepener in a weakening economy is concerning. It is even more concerning when it is happening while the recession indicator is on (a negative 2v10 spread).
Bear steepening regimes have a profound and rapid tightening effect on the economy as 30-year mortgage rates rise aggressively and corporate borrowing rates across the curve increase significantly – making credit expensive. Negative mark-to-market (MTM) effects are exacerbated, exposing those corporates that do not have good risk management practices.
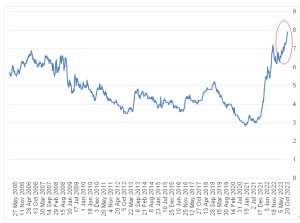
Figure 4: US 30-year mortgage rates

Source: Reuters, Anchor
The rise in long-dated US bond yields has driven the 30-year US mortgage rates higher to levels last seen 25 years ago. US 30-year mortgage rates are currently just below 8% compared to 6.7% on 30 June 2023. This is rapid tightening in just four months. Those who took adjustable-rate (variable) mortgages during low interest rates periods (e.g., 2012-2016 or 2019-2021) will also not be spared as they will face serious challenges when their mortgage rates adjust higher by multiples – ultimately consuming a more significant portion of disposable incomes. The recent rise in long-dated yields will undoubtedly impact the US housing market negatively.
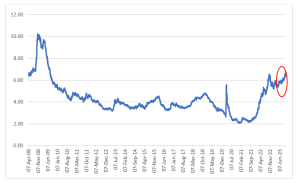
Figure 5: ICE BofA BBB US Corporate Index Yield, %

Source: ICE Data Indices, LLC
Figure 5 illustrates the US BBB-rated 10-year corporate borrowing rate. The rise in long-dated US bond yields has driven corporate borrowing rates higher. The US BBB-rated 10-year corporate borrowing rate has risen to about 6.8%. The average US BBB-rated 10-year corporate borrowing rate in 2013 was 3.7%. This means that a 10-year US BBB-rated corporate loan taken in 2013 is being refinanced today at nearly double the cost. Even US BBB-rated corporates who took shorter loans between 2014-2019 will be refinancing at almost double the cost. Refinancing conditions are difficult for these corporates that have a low credit quality. The US corporate debt market has sizeable debt maturities in 2024 and 2025. As these debt maturities approach, US corporates will face difficult choices. They will need to opt for either reducing their debt levels and scaling down their operations or implementing cost-saving measures, such as job cuts, to facilitate refinancing at double the cost to maintain their sustainability.
The amplification of negative MTM effects during a bear steepener is particularly pronounced. To illustrate this point, a 10-bp rise in the yield of a 30-year bond can result in a MTM impact roughly ten times more powerful than the same increase in the yield of a 2-year bond. This significant difference in impact is attributed to the 30-year bond’s higher duration. It is crucial to keep in mind the inverse relationship between bond yields and bond prices. Since the start of 3Q23, the 2-year US bond yield has risen by 18 bps, while the 30-year US bond yield has surged by 122 bps. To put this in perspective, an investor who purchased a US 30-year bond on 30 June 2023 is down approximately 20% in just four months. This is in stark contrast to a 1% gain for an investor who bought the US 2-year bond during the same period. These differences are massive. Corporates that use long-dated bonds, such as banks, insurers, and pension funds, are at an elevated risk if their risk management practices are not executed properly.
Conclusion
History serves as a helpful guide. We have observed similar macroeconomic conditions in September 2000 and May/June 2007, characterised by prolonged periods of yield curve inversion and slowing economic growth, without actual recessions materialising. In both instances, a late-cycle bear-steepening trend emerged just before severe market and economic downturns. This bear-steepening trend reflected the prevailing conviction that economies could handle higher interest rates for an extended period. A stock market crash in 2000 or the housing market crash in 2007 prompted the Fed to pivot.
While it is challenging to accurately predict what will break or when it fails, a late-cycle bear-steepening inverted yield curve often coincides with the peak in US bond yields for the cycle. It generally corresponds with the peak in 2-year yields, while for 10-year yields, it is close to the peak. When economic vulnerabilities become evident, and we enter a phase of an economic and market downturn, we will likely see a bull-steepening regime. Considering these dynamics, we see value in US Treasury bonds, particularly within the 2-year to 10-year yield range. We also find value in high-quality US corporates such as US AA-rated corporate bonds with similar terms.


