Introduction
Since the start of the COVID-19 crisis, we have seen several significant shifts in the fundamentals impacting the fair yields of bonds. However, until recently, it has been irrelevant since the torrential foreign selling of local bonds in response to COVID-19 had pushed yields to levels where bonds were incredibly attractive on every metric and, at the height of the crisis, we were thumping the table saying buy duration bonds. We have now seen bonds recover about half of their lost ground and the Anchor BCI Bond Fund has reported a gain of 16% since 24 March (to Friday [17 April]). Over the same three-week time frame, the more conservative portfolio construction of the Anchor BCI Flexible Income Fund has resulted in a return of about 2.75%.
Since we last discussed the fair yield of local bonds, we have seen rating agency downgrades of South Africa (SA) from both Moody’s and Fitch. There is also a high probability that we will be downgraded by Standard & Poor’s soon. It is therefore clear to us that the COVID-19 crisis will further impair our already weak fiscal situation and that the local economy is probably going to shrink by c. 5.5% for 2020.
SA’s fiscal situation was unsustainable prior to the COVID-19 crisis and we had previously estimated that government had c. 10 years before an approach to the IMF started to become a plausible discussion. However, the economic consequences of COVID-19 mean that this runway has shortened to maybe 5 to 7 years. The need for policy and fiscal reform has also accelerated. We have seen government respond on the fiscal front, with meaningful action on the government wage bill and on SAA. The ideological challenges to partnering with business, winning back the trust of job creators and addressing labour market rigidity are significant but, unfortunately, we have not seen enough traction on this front. We do not think that government will need to approach the IMF within the next 5 years. Nevertheless, in the unlikely scenario where the government were indeed to approach the IMF, the result would be faster structural reforms towards a sustainable set of policies, which would be immensely positive for the local bond market.
In response to the slump in the economy, the SA Reserve Bank (SARB) cut interest rates by 100 bpts on 20 March and by a further 100 bpts on 14 April.
Below, we discuss the consequences of all of this on the yield curve in order to estimate the fair yield of bonds and their remaining attractiveness.
The SA yield curve
We start by looking at the yield curve as published by the JSE at the close of business on 17 April.
Figure 1: Bonds best decency par yield curve
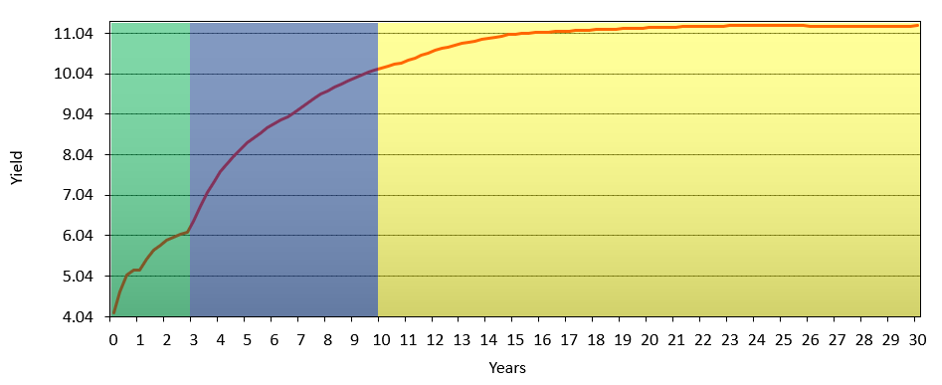
Source: JSE
The yield curve is showing that, for government bonds maturing in 2021 (i.e. in one year), investors can expect to earn just over 5.04% as an interest rate. However, if an investor extends that to 2040 (i.e. over 20 years) then the interest rate earned jumps to slightly above 11.04%. Figure 1 above (colour coded for ease of reference) also shows the interest rate applicable to all possible maturities of SA government bonds.
The SARB sets the repo rate, which is a short-term rate. As a result, short-dated bonds are most responsive to rate cuts and central bank action. The SARB has the greatest influence on how bonds and interest rates in the green band (Figure 1) behave.
As we move into the blue band, the SARB’s influence on interest rates start to diminish and the blue band serves to connect the green band to the yellow band. This area of the yield curve marries central bank actions, to future inflation expectations and to credit risks associated with the country. The impact of changes in inflation expectations is usually the dominant influence here.
The yellow band is sufficiently far out that central bank interest rate cuts and inflation play less of a role in the fair yield of these bonds. Instead, we now see that the credit standing and economic trajectory of the country are the predominant factors. The temptation is for a central bank to try and bring this yield down by buying bonds. However, we caution that these benefits are temporary and cease as soon as a central bank stops buying bonds. We also highlight that Turkey tried this during the global economic crisis and learnt that quantitative easing (QE), combined with a weak fiscal situation, meant that their yields increased as the central bank started buying bonds. The experience with QE for emerging markets (EMs) is that it can drive interest rates higher but not lower. To influence this part of a yield curve the country needs to manage its affairs prudently and sustainably.
If we think that interest rates will be cut again and that the inflation rate will remain low, then we want to invest in bonds within the green and blue bands. Conversely, if we think that we will see structural reform and an improved economic outlook, then we start to invest in the yellow band. Our portfolios are currently concentrated in the green and blue bands.
We also highlight that bonds have a defined maturity date. The R2030, for example, will mature in the year 2030 and therefore is a 10-year bond. Next year, this will be a nine-year bond. Over time, bonds approach maturity and will move from the yellow band, to the blue band and eventually to the green band. As bonds do this, their yields should decline giving us some capital gains. Currently, we prefer the R186 and R2030 because these bonds should benefit most from this phenomenon.
The final point worth noting is that the yield curve at year-zero starts close to 4%. This means that the market thinks that there is a reasonable prospect of another interest rate cut of 50bpts before this is all done.
Fair yield for bonds
Taking all the above into account, we have amended our fair yield for the R186 and the R2030.
Figure 2: Anchor SA bond yield monitoring – R186
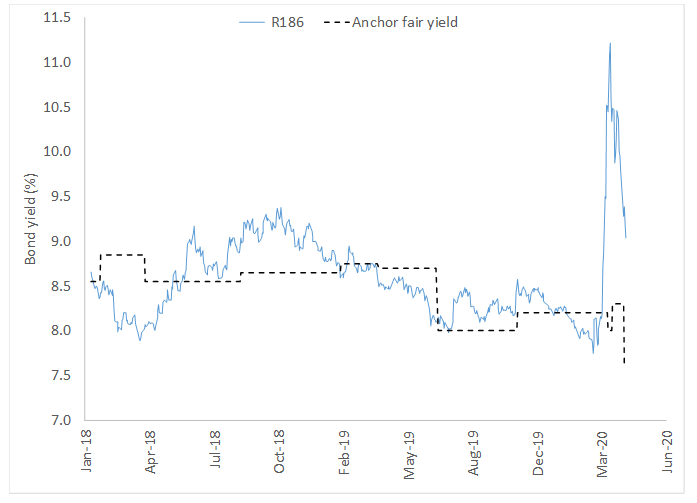
Source: Thomson Reuters, Anchor
Figure 3: Anchor SA bond yield monitoring – R2030
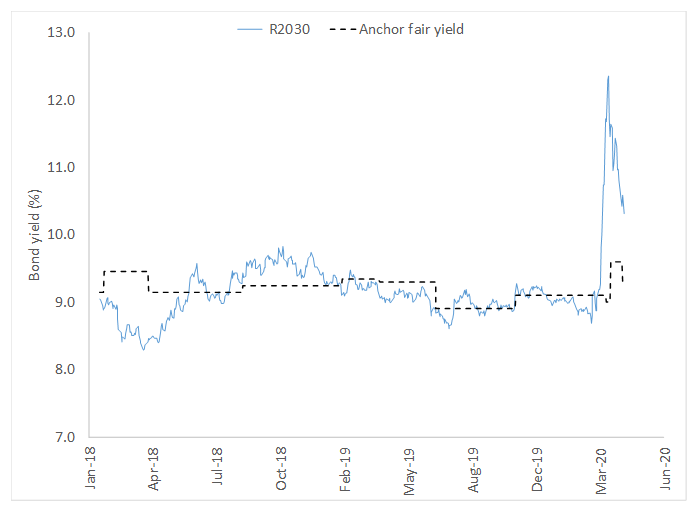
Source: Thomson Reuters, Anchor
The effect of the interest rate cuts is greater for the shorter bond (the R186), while the impact of the downgrades is greater for the longer-dated bond (R2030). Overall, the fair yield on the R186 has declined by 0.60% to 7.60%. Conversely, the fair yield on the R2030 has pushed 0.20% higher to 9.30%.
Implications for the Anchor BCI Bond Fund
The Anchor BCI Bond Fund’s yield has pushed up to about 10.3% as at Friday (17 April). Much of the snapback in yields has occurred already as is evident from Figure 3 but we think that there is about a 100-bpt recovery left for longer bonds. This would equate to c. 6.6% of capital gains for the Anchor BCI Bond Fund, after which it will revert towards its historic volatility patterns with a portfolio yield of c. 9.3%. We have been building a concentration of R2030 bonds in the portfolio, which will benefit from a rolldown over time.
In our view the recovery of the Anchor BCI Bond Fund will continue, just at a slower pace but we expect yields to remain volatile. The COVID-19 crisis is far from over and where it goes, this portfolio will follow. An escalation of the crisis will see this portfolio come under pressure. The portfolio will also become increasingly sensitive to fiscal and political developments in SA. However, as compensation for the higher volatility, the yield on offer will be meaningfully higher than that of our other portfolios.
Implications for the Anchor BCI Flexible Income Fund
Broadly speaking, we are targeting a portfolio construction as per Figure 4:
Figure 4: Targeted Anchor BCI Bond Fund construction
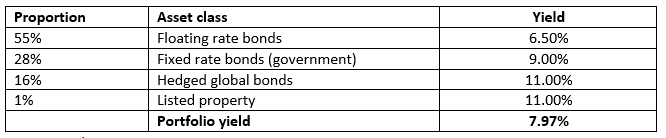
Source: Anchor
Strong inflows into the portfolio have resulted in an excess cash position while we are buying bonds. Our purchases have been focusing on SA government bonds (fixed-rate bonds), which are showing the most value. We expect that once all of our cash is deployed the portfolio yield will stabilise at around 8.00%.
The greater opportunity in fixed-rate bonds does mean that we have increased the portfolio’s duration exposure which means that the portfolio will be slightly more volatile than previously, albeit not meaningfully so. We think that the R186 has about a 150-bpt recovery available to it. This will see further recovery for the portfolio of about 1.1% from its closing levels on Friday. We also see some scope for recovery in global bonds and eventually, we believe, in listed property which will in due course give a further boost to the fund. This portfolio will continue to give the best blend of capital preservation with an attractive yield. The steep yield curve means that money market funds are likely to see their portfolio yields drift towards 5%, making flexible income significantly more attractive, in our view.