Most major global equity markets continued to struggle in March (MSCI World -4.4% MoM/-1.7% YTD/1Q25) as unprecedented policy uncertainty surrounding on-again/off-again tariffs resulted in Trump administration-induced market turmoil. In addition, increasing US recession fears, coupled with frothy valuations, inflation, and weak consumer sentiment, have resulted in a potent negative cocktail for equity markets, with investors having to digest uncertainty and policy changes almost daily. Selling pressure once again increased towards month-end after US President Donald Trump signed an order to implement a 25% tariff on all auto imports, which is expected to disrupt operations for North American automakers and raise prices for US consumers. Trump called the tariffs “permanent” and said that his reciprocal tariff plan would start with “all countries” on 2 April. The CBOE Volatility Index (VIX), a measure of the US stock market’s volatility, soared as high as 29.57 in March, closing the month at 22.28 vs end December’s 17.35.
US markets have broadly underperformed since Trump’s return to the White House, with the three major US averages posting a dismal 1Q25 performance and significant monthly losses. The S&P 500 was down 5.8% MoM (-4.6% YTD/1Q25), and the Dow fell by 4.2% (-1.3% YTD/1Q25). The tech-heavy Nasdaq was the worst performer for the month – ending 8.2% lower (-10.4% YTD/1Q25). February headline inflation, as measured by the Consumer Price Index (CPI), printed at 2.8% YoY – cooling slightly more than expected (although it does not yet reflect the inflationary impact of Trump’s tariffs) and vs January’s 3.0% print. Core CPI, excluding food and energy, rose 3.1% YoY vs January’s 3.3%. March consumer confidence dropped to the lowest level in four years on concerns about higher prices and the economic outlook amid the Trump administration’s tariffs push. February core personal consumption expenditure (PCE), excluding food and energy, the US Federal Reserve’s (Fed) preferred inflation gauge, printed at 2.8% YoY – up from January’s 2.6% and the highest level since January 2024. As expected, the Fed kept rates on hold at its March meeting. Committee members lowered their GDP forecasts for 2025 and now see inflation rising more than they assessed just 3 months ago.
European equity markets recorded their first MoM decline this year, reflecting the potential negative impact of Trump’s tariffs obsession. Still, YTD, Europe has emerged as an attractive alternative to the US amid a surge in Euro-optimism. For the month, Germany’s DAX declined 1.7% (+11.3% YTD/1Q25), while France’s CAC closed 4.0% lower (+5.8% YTD/1Q25). The euro recorded its strongest monthly performance against the US dollar since November 2022, surging by c. 4.3% in March as a softer dollar and optimism over the EU’s fiscal plans, including increased defence spending and Germany’s debt reform, buoyed the unit. February eurozone headline inflation eased to 2.3% YoY vs January’s 2.5%, while core inflation was down to 2.6% – its lowest print since January 2022.
The UK market also ended March weaker, with the FTSE 100 down 2.6% (+5.0% YTD/1Q25). February UK inflation slowed to 2.8% from 3.0% in January. Core inflation also slowed – coming in at 3.5% in February vs January’s 3.7%.
While heightened concerns ahead of a fresh round of US-imposed automaker tariffs weighed on Asian markets, China’s stock markets ended the month slightly higher on the back of positive policy signals from Beijing and the possibility of new tech innovations after DeepSeek. Hong Kong’s Hang Seng rose 0.8% (+15.3% YTD/1Q25), while the Shanghai Composite rose 0.4% (-0.5% YTD/1Q25). China’s official March manufacturing PMI continued to expand, coming in at 50.5 (the highest since March 2024) vs February’s 50.2. The non-manufacturing PMI, which includes services and construction, climbed to 50.8 from 50.4 in the prior month. A reading above 50 reflects expansion, while below 50 suggests contraction.
Japan’s benchmark Nikkei tumbled to its lowest level since September 2024 on 31 March, ending 4.1% lower MoM (-10.7% YTD/1Q25) as concerns over the adverse impact of US tariffs on Japan’s economy mounted. As an aside, Japan, South Korea, and China held their first economic dialogue in five years on 30 March, seeking to facilitate regional trade as they brace for Trump’s tariffs. Japan’s February core inflation printed at 3.0%, down from January’s 3.2% YoY but surpassing expectations and reinforcing concerns about persistent price pressures.
In commodities, on the back of escalating global trade tensions and heightened US tariff threats, investors flocked to safe-haven assets in March, resulting in the gold price (+9.3% MoM/+19.0% YTD/1Q25 – its best quarter since 1986) reaching a new record high of US$3,145/oz. Among platinum group metals (PGMs), platinum rose 5.1% MoM (+9.9% YTD/1Q25), palladium advanced by 7.4% MoM (+8.6% YoY/1Q25), and rhodium gained 20.6% MoM (+24.6% YTD/1Q25). Brent crude rose by 2.1% MoM (+0.1% YTD/1Q25) on concerns that oil supplies could decline if Trump follows through on threats to impose more tariffs on Russia and possibly attack Iran.
In South Africa (SA), a flight to safety saw mining counters, especially the gold and platinum stocks, outperform and do most of the heavy lifting. The FTSE JSE All Share Index gained 3.1% last month (+5.4% YTD/1Q25), closing at an all-time high of 90,149.7 on 19 March, while the Capped SWIX ended 3.6% higher MoM (+5.9% YTD/1Q25). The Resi-10 (+19.5% MoM/+32.3% YTD/1Q25) accounted for most of the gains, while the rest of the market constituents did not exactly shoot the lights out. Property shares declined (Listed Property Index -1.2% MoM/-3.8% YTD), as did industrials (Indi-25 -0.6% MoM/+3.7% YTD/1Q25), while financials underperformed (Fini-15 +0.2% MoM/-1.7% YTD). The rand strengthened by 2.0% MoM against a weaker US dollar (+2.8% YTD/1Q25).
In economic data, the SA economy exhibited modest 4Q24 growth, with GDP expanding 0.6% QoQ, following a slight contraction (-0.1%) in 3Q24. GDP grew 0.6% for the full year. February headline inflation was unchanged at 3.2%, while core inflation eased for a fifth consecutive month to 3.4% YoY vs 3.5% in January. In line with expectations, the SARB’s Monetary Policy Committee (MPC), at its March meeting, decided to keep the repo rate unchanged at 7.5%. Similar to its January statement, the SARB placed considerable emphasis on the ongoing volatility in the global economic environment. After being delayed in February, the Budget was presented on 12 March, eliciting mixed reactions from the market and reflecting a complex balancing act by the government.
Figure 1: March 2025’s 20 best-performing shares, MoM % change
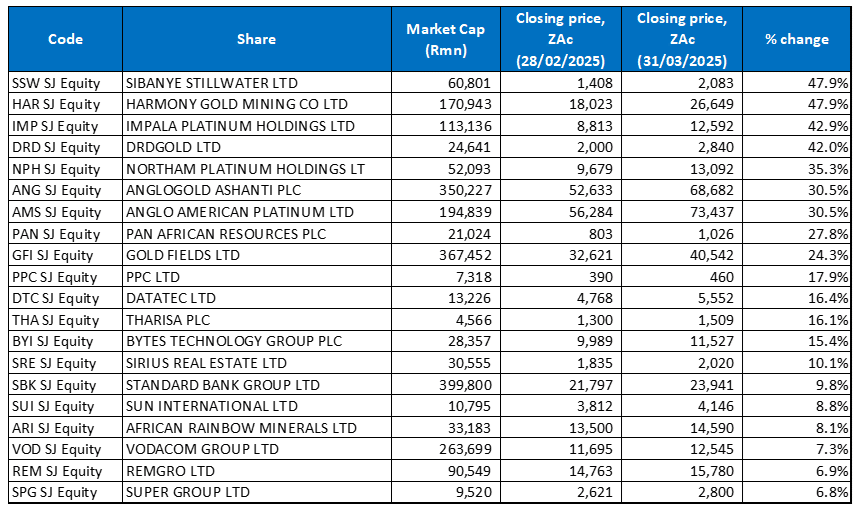
Source: Bloomberg, Anchor
After a dismal performance in February, precious metals miners once again soared in March as the gold price jumped 9.3% MoM, while platinum, palladium and rhodium prices also soared (up 5.1%, 7.4%, and 20.6% MoM, respectively). Trump’s tariff plans and his unpredictability around trade and foreign policy buoyed demand for safe-haven assets, which in turn saw the gold price rally strongly. This comes as expectations rise that a global trade war will fuel inflation, slow economic growth, and exacerbate already heightened geopolitical tensions. Gold’s performance, in turn, saw the gold miners’ share prices soar, with six of March’s nine top-performing shares being gold miners.
Sibanye Stillwater, which mines and processes PGMs, gold, and copper, and gold miner Harmony shared the top-performing share spot with impressive 47.9% MoM gains. Sibanye’s challenges have seen it underperform its gold and PGM peers (in February, the share was down 21.8%). Still, the company received an adrenaline shot last month as precious metals prices soared after the World Platinum Investment Council (WPIC) forecast a deeper-than-expected global platinum deficit. The WPIC expects the global platinum supply to continue declining in 2025 due to a weaker recycling supply and lower output from SA’s PGM mines. While demand is also forecast to decrease, dwindling supply will result in a global platinum deficit of over 840,000 ounces, according to the WPIC. YTD, the platinum price is up c. 10%, with the JSE’s biggest PGM miners reaping the rewards of the price rise. Shares in Impala Platinum (Implats – the third best-performing share), Northam Platinum (the fifth-best performer) and Anglo American Platinum (Amplats – coming in at seventh position) gained 42.9%, 35.3% and 30.5% MoM, respectively.
Last month, Harmony reported 1H25 results, which showed that its revenue rose to R37.1bn from R31.4bn posted in 1H24, while diluted EPS increased by 31.9% YoY to ZAc1,257. The Group also reported another record high in its free cash flow (FCF) and dividend payouts as operating FCF rose by 46% YoY to a new half-year record of R10.39bn, while shareholders will receive an interim dividend of ZAc227/share.
Besides Harmony (mentioned above), the runaway gold price has also boosted the share prices of other local gold miners including DRDGold (in fourth spot with a 42.0% MoM gain), AngloGold Ashanti (sixth place with a 30.5% MoM rise) and Gold Fields (ninth position with a 24.3% increase) recorded double-digit gains in March.
In its 1H25 results, Implats reported a revenue decline of 2.6% YoY to R42.28bn, while its diluted EPS stood at ZAc207 compared to ZAc180 in 1H24.
Northam saw its earnings nearly halve in 1H25, battered by soft PGM prices during the period under review (to 31 December 2024). Headline EPS plummeted 49.7%, and Northam cut its interim dividend (tied to a 25% headline earnings policy) from R1 by 85% to ZAc15.
Pan African Resources, a gold producer that focuses on the safe and efficient extraction of gold from mineral deposits, rose 27.8% MoM. It was followed by Gold Fields (+24.3% MoM) and cement producer PPC Ltd (+17.9% MoM) in the ninth and tenth spots. In its operational update for the ten months ended 31 January 2025, PPC said that its revenue had declined 3.0% YoY, primarily due to a drop in revenue from its Zimbabwe operations, while the SA and Botswana group delivered a flat performance. Group EBITDA margins improved to 16.6% from 13.4% in the comparable period, resulting in a 20% increase in total Group EBITDA. Last week, the PPC board approved R3bn for the construction of the company’s new integrated cement plant in the Western Cape. The PPC share price leapt 12.8% on the day following the announcement. The plant will have a capacity of 1.5mn tonnes of cement p.a. and will replace and increase the capacity of the existing Western Cape PPC site.
Figure 2: February 2025’s 20 worst-performing shares, MoM % change
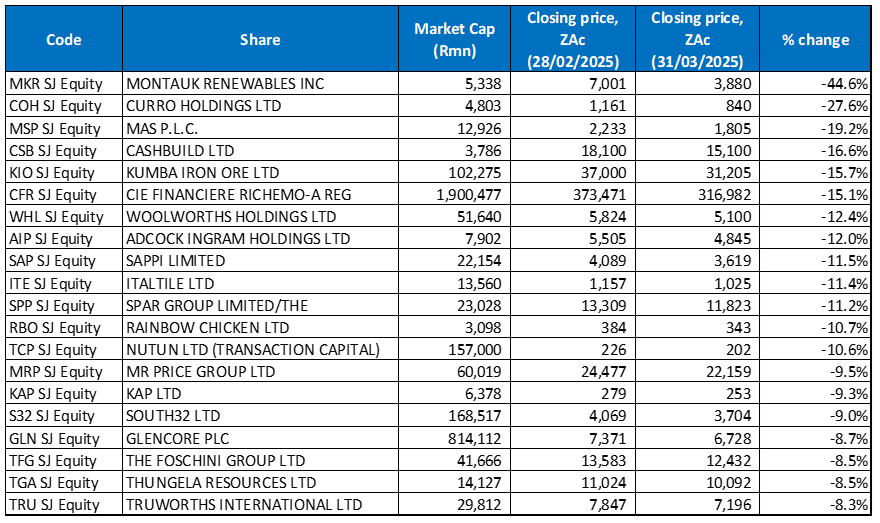
Source: Bloomberg, Anchor
Montauk Renewables, which specialises in management, recovery and conversion of biogas into green energy and is also listed on the Nasdaq, was March’s worst-performing share -down 44.6% MoM. On 17 March, Montauk reported a 30% YoY slump in its FY24 headline earnings to US$11mn. Its share price fell by c. 18% on the day. The results disappointed, with revenue up only 0.5% YoY and HEPS dropping by 27% YoY.
Montauk was followed by Curro (-27.6% MoM) in second place and MAS P.L.C (+-19.2% MoM) coming third. In its FY24 results released in March, SA’s biggest independent school Group reported that revenue advanced 8.0% YoY to R5.1bn, while its diluted EPS stood at ZAc18.60 vs ZAc7.00 posted in FY23. However, Curro’s numbers showed lower enrolments and a decline in the number of pupils in lower grades as SA families continue to face economic hardships. MAS Plc’s latest earnings announcement showed substantial revenue and profit growth. Still, it was accompanied by news that MAS remains in negotiations to reach an agreement to unwind its complex relationship with developer PKF.
In fourth spot, building materials retailer Cashbuild (-16.6% MoM) reported lacklustre 1H25 results in early March, with its gross profit margin down 40 bps as revenue rose just 5% YoY to R6.1bn. HEPS advanced by 4% YoY to ZAc572.8, with the Group noting that the trading environment in SA remained challenging.
Kumba Iron Ore, Richemont, and Woolworths followed Cashbuild with MoM losses of 15.7%, 15.1%, and 12.4%, respectively. The price of iron ore has been under pressure for a while now (down 1.7% in March), with reports that China is planning to slash crude steel output by 50mn tonnes in 2025 also weighing on iron ore prices. While Richemont has performed well YTD (+14.2%), the share took a breather in March. In January, Richemont reported robust sales (+10% YoY at constant exchange rates) for the festive season quarter and double-digit growth in all its regions except Asia Pacific. The Americas and Europe were standout markets, with sales increasing by 22% and 19% YoY, respectively, driven by strong local and tourist demand. Japan, the Middle East and Africa also performed well, recording gains of 19% and 20%, respectively. Retailer Woolworths released its 1H25 results in early March, with revenue increasing to R39.9bn from R37.9bn posted in 1H24, while its adjusted diluted HEPS declined by 19.4% YoY. The results showed that the retailer had suffered a drop in its apparel division at home and in Australia, which overshadowed the strong showing for its food division. Woolworths also cut its interim dividend by 28% YoY.
Adcock Ingram, Sappi, and Italtile rounded out March’s worst-performing shares with MoM declines of 12.0%, 11.5%, and 11.4%. In its 1H25 results, Italtile reported a revenue decline of 0.3% YoY to R4.78bn while its diluted EPS stood at ZAc70.6, compared with the ZAc67.5 recorded in 1H24.
Figure 3: Top-20 best-performing shares, YTD/1Q25
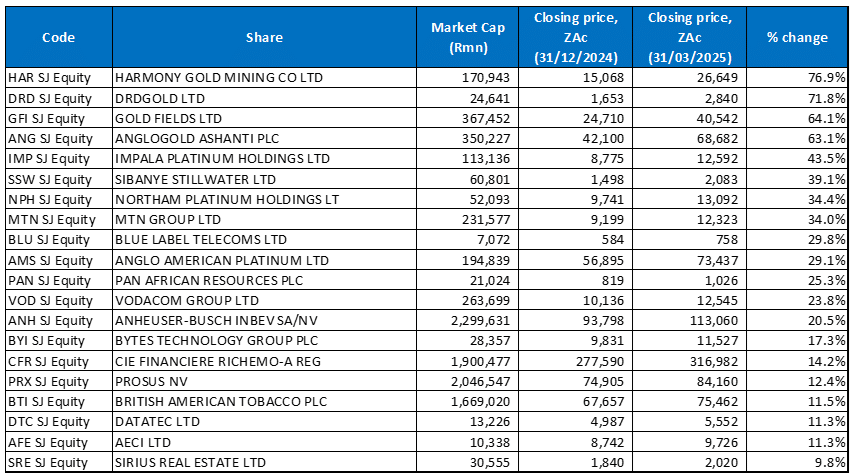
Source: Anchor, Bloomberg
The YTD best-performing shares (to end March) overlapped with those to the end of February as the precious metals miners, whose prices soared again in March, featured prominently among the YTD best performers despite their poor performances in February. Twelve of the year-to-end February’s best performers remained in the year-to-end March, with five new shares entering the top 20, including Implats, Sibanye Stillwater, Northam, Amplats, Pan African Resources, Bytes Technology, Datatec, and Sirius Real Estate.
Harmony was the top performer YTD with a gain of 76.9%. It was followed by DRDGold, Gold Fields, and AngloGold Ashanti with YTD increases of 71.8%, 64.1%, and 63.1%, respectively.
Impala, Sibanye and Northam (all discussed earlier) followed with YTD advances of 43.5%, 39.1%, and 34.4%.
MTN Group (+34.0% YTD) released its FY24 results in March, which showed a revenue decline of 15.0% YoY to R188.0bn. The Group also reported a 68.9% YoY drop in FY24 HEPS to ZAc98, while adjusted headline earnings fell 32% YoY due to currency weakness and inflation. MTN declared a dividend of ZAc345/share vs ZAc330/share in FY23. Despite the decline, earnings exceeded expectations, and the dividend guidance was raised from R3.30 to R3.70. The Group has also streamlined its operations by exiting Afghanistan and Guinea and is seeking to exit Iran due to political and legal concerns. MTN said its financial results were impacted by the conflict in Sudan and foreign exchange devaluation, particularly for the Nigerian naira, which has dropped by over 70% since mid-2023.
Blue Label Telecoms (29.8%) and Amplats (+29.1%) rounded out the ten best-performing shares YTD.
Figure 4: Bottom-20 worst-performing shares, YTD/1Q25
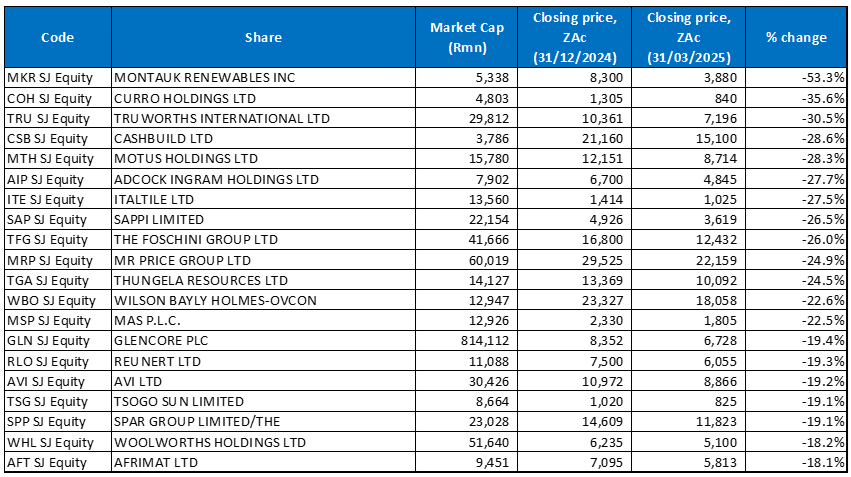
Source: Anchor, Bloomberg
There was also a significant overlap between the year to end-February’s worst-performing shares and the worst-performers to the end of March (YTD), with fourteen shares unchanged and six new entrants to the grouping – Curro, MAS P.L.C, Glencore, Tsogo Sun, Spar Group, and Woolworths. After a strong 2024 performance, SA Inc., or domestically focused, shares have struggled this year, with the clothing retailers among the hardest hit as Truworths, The Foschini Group, and Mr Price all featured prominently among the YTD losers.
Montauk (-53.3% YTD; discussed earlier) was March’s worst-performer, followed by Curro (-35.6% YTD; discussed earlier) in second place and Truworths (-30.5% YTD) in the third spot. Truworths’ share price has been on a downward trajectory due to a combination of factors, including weak sales growth, a decline in its Africa segment, and a drop in gross profit margins, which has led to a decrease in HEPS.
Truworths was followed by Cashbuild (-28.6% YTD) and vehicle retailer Motus (-28.3% YTD). Motus’s half-year revenue decreased by 2% YoY to R56.1bn due to reduced contributions from new vehicle sales of R1.9bn. This was offset by increased contributions from pre-owned vehicle sales of R629mn and parts and other goods sales of R224mn. Motus’ SA operations contribute 55% to its overall revenue. It also has operations in the UK and Australia.
Adcock Ingram and Italtile were down 27.7% and 27.5% YTD. Pharma group Adcock reported lower profit at the interim stage, with the Group’s operational and financial performance affected by sector-specific factors. Its revenue decreased 0.6% YoY to R4.7bn due to a slowdown in its independent and pharmaceutical wholesale channels. HEPS declined by 9.4% YoY to ZAc265.5.
Finally, Sappi (-26.5% YTD), Foschini (-26.0% YTD), and Mr Price (-24.9% YTD) rounded out the ten worst-performing shares. Sappi released 1Q25 results recently, which showed its sales rising to US$1.36bn from US$1.27bn, while its diluted EPS stood at USc12.0 vs a loss per share of USc23.0 in 1Q24. The company said that despite continued challenging global macroeconomic conditions and weak paper markets, it delivered an adjusted EBITDA of US$203mn – above expectations and last year. However, its net debt rose 16% YoY because of higher capex. Sappi said that external pressures (a slowdown in China, weaker European markets and uncertainties around tariffs) and the planned work at its Somerset Mill that will see it shut for c. 70 days could result in weaker 2Q25 results.