A few weeks ago, South African Reserve Bank (SARB) Governor Lesetja Kganyago mentioned in a speech that South Africans should not assume that our large banks are risk free and that they cannot come under stress during these difficult times. This raises questions around how secure the SA banking system really is and how safe our deposits are in SA banks? In this note, we attempt to answer these questions and we also highlight the current positioning of SA banks in light of the COVID-19 pandemic and the ensuing lockdowns.
Background
The core business of banks is to take deposits from depositors and to allocate this money to productive long-term investments. Proceeds from these long-term investments are returned to depositors, linking savers with the growing economy. This transformation of short-term deposits into long-term investments facilitates economic growth. However, before deposits are made, depositors require some degree of confidence in a bank. Maintaining and enhancing public confidence in a country’s banking and financial system is at the heart of financial sector regulations.
Current regulatory environment
In February 2013, the Financial Regulatory Reform Steering Committee (FRRSC) published proposals to introduce the Twin Peaks model to regulate the SA financial services sector. Under this model, the SARB as SA’s Prudential Authority (PA) will regulate and supervise the country’s entire financial system (including banks, insurers, stock exchanges and clearing houses), while the Financial Sector Conduct Authority (FSCA) will protect investors by regulating the behaviour of financial institutions and markets. In June 2017, Parliament approved the Financial Sector Regulation Bill, which was signed into law in August 2017 and which established a Twin Peaks model for separate prudential and market conduct authorities. In April 2018, the Financial Services Board (FSB) was split into two regulators:
- The PA (housed within the SARB) is responsible for regulation and supervision of the entire SA financial system and it ensures financial institutions comply with minimum requirements related to capital, liquidity, leverage, and other metrics of financial stability.
- The FSCA is responsible for monitoring the conduct of financial institutions and markets.
In recent years, major regulatory reforms have been implemented to enhance the resilience of the financial sector. However, regulation does not replace management and, despite the regulator’s best efforts, the key determinants of the soundness and the safety of banks are management and the market forces that exercise discipline on that management. When investors and/or management fail in their respective roles to enforce effective risk management practices, a safety net is required to cushion the negative implications. This safety net is likely to be provided by the government.
Historically, the government has supported the banking system during periods of stress. Government has previously compensated depositors for their losses on a case-by-case basis when a bank has failed. This meant that taxpayers had to bear the failure cost of individual commercial enterprises, indirectly. An example is the failure of African Bank in 2014, where the SARB stated that senior bondholders and wholesale depositors would take an outright 10% loss. However, the failure of the VBS Mutual Bank in 2018 showed that government’s ability, and willingness, to pay the cost of bank failures had diminished as the SARB allowed the bank to fail.
In SA there is a misconception that deposits in banks are guaranteed by government should such a bank fail. Currently, SA does not operate a deposit insurance scheme (DIS) to protect those depositors in domestic and foreign banks. Should a bank fail, there are no explicit arrangements in place to protect its depositors or a reliance on National Treasury (NT) to use taxpayer’s money to reimburse the depositors. Simply put, the regulator’s current efforts can fall short in wholly protecting your deposits should your bank face solvency challenges, especially at a time of crisis and in the current fiscal setting. The SARB and NT are also in the process of establishing a deposit insurance and bank resolution framework, which will reduce the requirement for public sector funds to be mobilised in the event of a bank failure.
COVID-19
The SA banking system is not immune to the disruptions caused by the COVID-19 pandemic, which is expected to exacerbate the already difficult local operating environment. The fallout from the outbreak will likely weaken the creditworthiness of SA banks by hurting loan performance and profitability as well as capitalisation positions. Furthermore, with the domestic economy plagued by homemade woes and political tensions, which have significantly eroded business confidence, the growth prospects for local banks over the immediate and medium-term horizons seem muted, leaving deposits at higher risk, in our view. Banks are also currently experiencing a shift in wholesale deposits (deposits from large corporates, especially asset managers). This shift involves a move from long-term deposits to short-term deposits as risk aversion sets in.
The SA banking universe
Figure 1 below is a brief overview of the SA banking system and an approach guide that depositors can use to analyse the credit strength of a bank, ultimately assessing the safety of their deposits, especially at a time of a crisis. It is important to highlight that the analysis done below is on a standalone basis and the idea of implicit support from government, given the systemic importance of the bigger banks, was ignored.
Figure 1: SA banking system
Source: SARB, BA 900
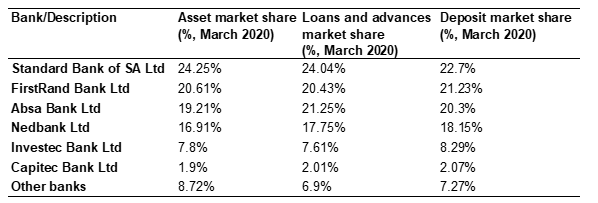
As at 31 March 2020, the local banking system comprised of 74 banks and representative offices and reported total assets of c. R6.58trn. The segment that contributes the most to banking assets is loans and advances (c. R4.48trn), consuming c. 68% of total banking assets.
Figure 2: Local banks’ credit to the SA private sector by segment
Source: SARB, Quarterly Bulletin March 2020
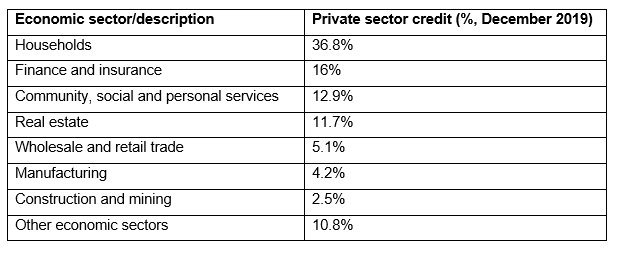
The loan books of local banks are most exposed to private households, which accounted for c. 37% of private-sector loans, as at the end of December 2019.
The SA banking system reported total deposits of c. R4.41trn as at the end of March 2020. Institutional deposits, which mainly included deposits by money market funds, asset management companies, insurance firms and pension funds, accounted for over 25% of banking system rand-denoted deposits, as at the end of December 2019.
Standard Bank is the largest lender and deposit-taker in SA, with respective shares of c. 24% and c. 23% of system loans and deposits as of 31 March 2020. Nonetheless, the local banking system is concentrated, with the four-largest banks by assets (the big-four banks) accounting for c. 81% of total banking assets as at 31 March 2020.
SA banks’ financial credit strength analysis
Analysing a bank’s financial credit strength is centred on three pillars: earnings, asset quality and capitalisation. No single pillar can provide a comprehensive view of a banking institution’s financial strength and thus, we believe, a robust bank must clearly exhibit strength on all three counts – a guide that depositors can use to assess the safety of their deposits in a bank.
Without healthy earnings, a bank is unable to manage periods of adversity and financial loss, or to build capital to continue to expand its business and absorb losses. Similarly, a bank which lends under loose credit criteria will most likely suffer high loan losses, thereby endangering its profitability and resulting in its liquidity drying up.
Earnings
We view this pillar in terms of earnings and capital generation, specifically common equity tier 1 (CET1) – the highest-quality form of capital because of its ability to absorb losses immediately when these occur. Profitability is also an important contributor to a bank’s resilience because retained earnings are a key source of new loss-absorbing capital (CET1 capital).
Figure 3: The SA banking system’s return on equity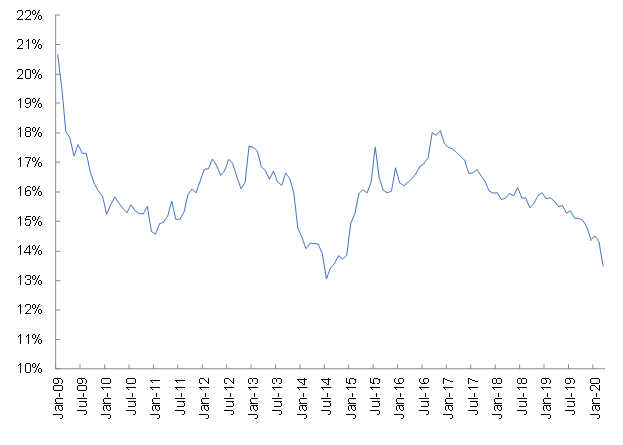
Source: SARB, Anchor
The SA banking system’s earnings position as indicated by return on equity (ROE) has been declining in recent years, pulling back from its 2016 highs, as subdued domestic growth weighed heavily on earnings. The local banking system’s ROE declined to c. 14.3% in February 2020 (its lowest level in 5 years) after peaking at c. 18% in 2016. Smaller banks have experienced a greater ROE pull back and are most vulnerable to the domestic economic environment because of their business models not being as diversified as those of the larger banks (both in terms of geography and product offerings).
Among SA’s big four banks, FirstRand (c. 21%) and Standard Bank (c. 17%) had superior earnings positions compared to their peers in December 2019. Systematically important financial institutions (SIFI), defined as the big-six SA banks by assets (a pool of banks that control c. 90% of SA banking assets), reported a combined ROE of 15% in February 2020 – down from the 2016 peak of c. 20%.
By using headline earnings (HE) as a percentage of risk-weighted assets (RWA) measuring capital generation among the big-four banks, it shows that Standard Bank and FirstRand (on an annualised basis) had the strongest generation of CET1 in December 2019, positioning themselves favourably compared to their peers.
Going forward, we expect to see downward pressure exerted on net interest income (NII) due to lower lending rates following this year’s 275-bpt cut in the main repo rate, as well as the lower loan growth (as lending will be extended cautiously in the current difficult economic environment). Contextually, a 25-bpt cut in the repo rate is likely to shave off c. R125mn-R180mn from the big-four banks’ total NII in 2020. Lower client activity will also dampen non-interest revenue (NIR), detailing material declines in ATM volumes, card and point-of-sale (POS) activity during the lockdown period.
Figure 4: The SA banking system’s cost-to-income
Source: SARB, Anchor
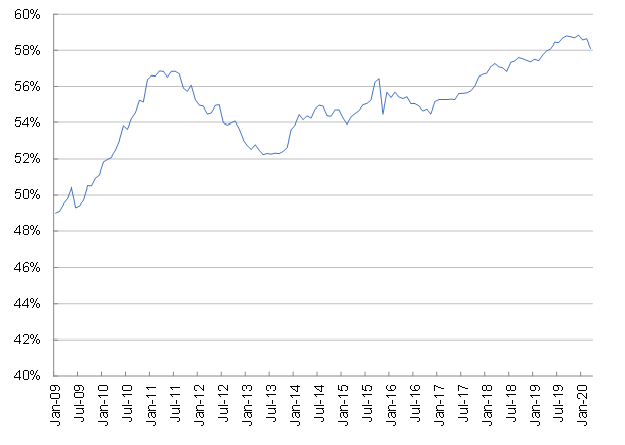
Costs have also been consuming an increasing proportion of banking income in recent years due to high digital investments. Operating expenses (opex) growth is likely to be muted in the immediate term as high digital investments will be offset by significant cost-cutting measures. Loan-loss provisioning needs will increase, in our view, in a proactive response to increased credit risk as problem loans (defined as stage 3 assets) rise and lower loan recoveries are experienced.
Meanwhile, we expect that bank revenues will come under material strain in the immediate term, exerting downward pressure on earnings given the aforementioned. As a depositor, one can use this pillar to assess a bank’s ability to generate earnings, which is a key source to generate capital buffers to manage periods of adversity and financial loss. Healthy earnings help build the capacity to absorb losses – the larger this capacity, the more runway a depositor has.
Capitalisation
Figure 5: Capital levels
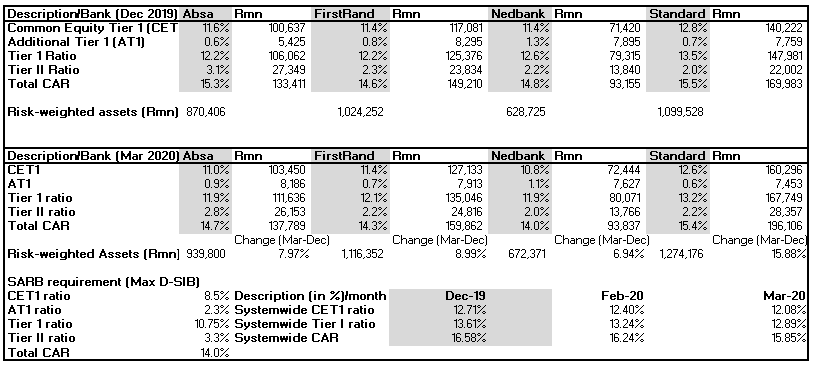
Source: Anchor analysis, Company data; SARB, PA
The purpose of a bank’s capital is to absorb unreserved losses that may be incurred. If a bank suffers a loss, the capital can be used to absorb the first loss, acting as a cushion, and thus allowing the bank to continue operating and thereby avoiding insolvency in stress periods. For this reason, deposit-holders’ rights are unsubordinated to equity-holders and holders of capital issues of the bank. When gauging the bank’s capital position, size is the ultimate yardstick. Size is important in both absolute terms (in rand in this case) and in relation to risk (the loan book).
SA banks are subject to regulatory minimum capital requirements set by the SARB and must report their capital levels to the SARB periodically. From the analysis above, the SA banking system is referred to as “system-wide”.
Following SA’s adoption of Basel III reforms, capital adequacy requirements for banks have risen. The key focus of Basel III was to strengthen the capital base of the banking sector, thus enhancing its capacity to absorb losses. Capital quality was improved by increasing CET1, simplifying Tier II and removing Tier III. Tier I capital provides loss-absorption features while a bank is still a ‘going-concern’, while Tier II is ‘gone-concern’ capital. Thus, if a bank fails, Tier II capital must absorb losses before depositors and other creditors do.
An additional cushion against bank failures was introduced in the form of a capital conservation buffer (CCB), which added a further CET1 capital requirement of 2.5% of RWAs. This buffer is over and above the basic minimum regulatory requirement of 4.5% of RWAs CET1. All banks are also required to hold a systemic risk buffer (Pillar 2A [P2A]) amounting to 1% of RWAs (of which at least half must include CET1 capital). The PA has additional capital requirements for domestic systemically important banks (D-SIBs) to account for the increased risk that their failure could cause to a country’s financial system. The PA also sets additional individual capital requirements (Pillar 2B [P2B]) for all banks, based on individual risks.
RWA is calculated by risk weighting all bank exposures (these are mostly loans and advances). It is important to note that, during an economic downturn, as more borrowers fail to repay loans (or are expected to do so), the risk weights for these loans increase. From December 2019 to March 2020, the risk nature of the system’s book has risen, resulting in RWAs increasing across the board. This RWA increase is largely driven by increased credit and market risk, leading to a higher amount of regulatory capital required to be held. For example, Standard Bank’s underlying exposures risk increased the most (by c. 16%) compared to its peers over the same period.
Standard Bank and FirstRand’s strong ability to generate CET1 was displayed as both banks’ highest-quality capital responded favourably compared to their peers, both in absolute terms and in relation to risk. Absa has the largest, weakest quality capital in relation to risk, comprising of subordinated debt issuances (additional Tier I [AT1] and Tier II), which do not carry as many loss-absorbing features as CET1 and are of shorter tenor. Overall, Nedbank has the weakest capital buffers in absolute terms and in relation to risk as its capital adequacy ratio (CAR) took the biggest knock (c. 0.8pps) over the same period.
Nonetheless, the big-four banks were still comfortably meeting minimum SARB capital requirements, depicting the well-capitalised nature of local banks. Some regulations have been temporarily relaxed to allow banks to draw down on their capital and liquidity buffers, thus encouraging the continued flow of credit into the economy. Surplus capital adequacy (defined as system CAR minus regulatory CAR) has declined in recent years, but remains above the 2% level last seen in 2008, surplus capital adequacy was reported at c. 3% in February 2020.
Going forward, we see some pressure on capital ratios stemming from lower capital generation and weaker loan performance. Downward pressure on capital positions is not only applicable to the big-four banks but is also visible across SA banks as systemwide capital ratios softened in March 2020, compared to the levels reported in December 2019. Nonetheless, SA’s financial system is particularly well-capitalised, and the buffers provide a fair degree of runway. In conclusion, a depositor can use this pillar to gauge the subordination buffer a bank has in absolute terms and in relation to risk – the bigger the buffer, the better.
Asset quality
Figure 6: SA banks latest reported numbers
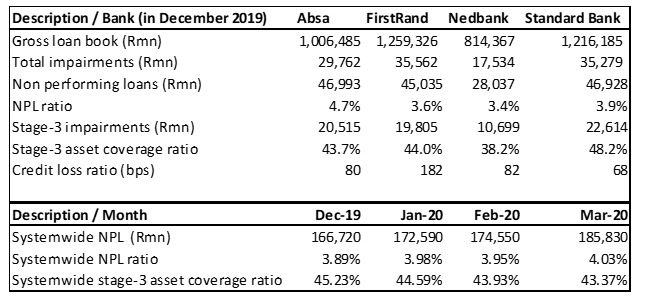
Source: Anchor analysis, Company data, SARB, PA
Different business models require varying underwriting and risk management expertise, which can be analysed through trends of non-performing loans (NPLs: defined as Stage 3 assets or problem loans) in absolute terms and in relation to the loan book (NPL ratio), provisioning volatility and the quality of collateral held. The aim of assessing asset quality is to form a view on the potential loan losses of a bank. The severity of loan losses will directly affect the profitability position of the bank, while consistent or large losses, depending on capital adequacy, could lead to potentially default scenarios. Consistent loose lending can have second-order effects on access to funding, drying up of liquidity and constraining growth. SA banks have robust risk management capabilities, tight credit underwriting standards, strict regulations on household and unsecured lending and a developed legal framework that allows lenders to efficiently foreclose collateral.
Figure 7: SA banking system NPLs
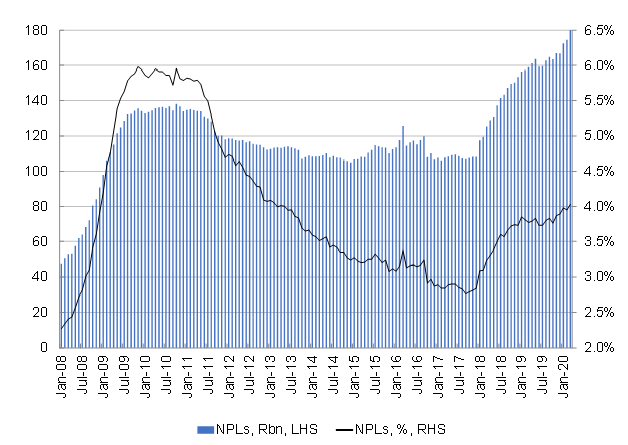
Source: SARB, Anchor
In recent years, borrowers’ ability to service debt has been deteriorating, as shown by the gradual increase of the NPL ratio. In 2018, the NPL ratio trended as low as 2.8%, while in December 2019, the reported systemwide NPL ratio was c. 3.9%. Among the big-four banks, Absa had the highest NPL ratio, showing a higher degree of problematic loans on their book. Conversely, Nedbank and FirstRand are the most favourable banks in this regard. In March 2020, systemwide NPL ratios pierced through the 4% mark, which was last seen in 2013, reporting at c. 4.03%.
The stage 3 coverage ratio (defined as the loss allowance on stage 3 assets as a percentage of total stage 3 assets) has also been tracking higher in recent years. For most of the asset classes showing significant stress (retail unsecured term loans, retail revolving credit [consisting mainly of overdrafts and unsecured loans with a revolving component]), provisioning has increased over the period. This is a positive sign, because it indicates that banks are proactively responding to increased credit risk. The favourable banks in this regard are Standard Bank and FirstRand.
Conclusion
Going forward, we expect the COVID-19 outbreak to exacerbate the already challenging operating environment. Small and medium-sized enterprises (SMEs) and borrowers in sectors such as mining, tourism, real estate and construction are likely to be hardest hit by the novel coronavirus outbreak, straining cash flows and making it hard to manage loan repayments. Prolonged disruptions in economic activity will exert upward pressure on NPL ratios to levels beyond 2009, impairments and provisioning needs will also increase placing considerable strain on asset quality.
Recent interest rate cuts are likely to not carry their traditional benefits to asset quality in the immediate term but, overall, we believe that these will rather act as a cushion to asset deterioration. Fiscal measures such as the recent R500bn fiscal package will also support asset quality and we believe that risks are towards the downside. In conclusion, a depositor can use this pillar to assess the severity of loan losses (losses on those long-term investments), which will ultimately affect the profitability of a bank.