Global markets whipsawed in February (MSCI World -2.5% MoM), initially because of Russia’s troop buildup along the Ukraine border and then the eventual invasion of that country. In the aftermath of the invasion, the US and its allies provided varying levels of military aid and adopted sanctions against Russia, including freezing the assets of Russian President Vladimir Putin and his foreign minister, Sergei Lavrov. In addition to other economic sanctions, they also placed sanctions on the Russian central bank and removed a “select” number of the country’s lenders from the Swift interbank global payments system. Other countries such as Japan, Canada, Australia, and South Korea, have also adopted sanctions against the Putin regime. The consensus view, following several days of fighting, seems to be that the invasion is not going Putin’s way as Ukraine frustrates Russia’s progress, but Moscow has ramped up its assault as diplomatic talks held on Monday (28 February) seemed to fail.
While US markets recovered somewhat on Friday (25 February), volatility returned on Monday as global investors processed new developments in Russia’s invasion of Ukraine. The blue-chip S&P 500 gauge dropped 3.1% in February (-8.2% YTD), while the Dow Jones closed the month 3.5% lower (-6.7% YTD) and the tech-heavy Nasdaq lost 3.4% MoM (-12.1% YTD).
On the US economic data front, January inflation hit its highest level in 40 years at 7.5% YoY (vs December’s 7.0% YoY print) – the fourth straight month of US inflation coming in above 6%. Excluding the volatile food and energy prices components, core CPI rose 6% YoY – its sharpest increase since 1982. MoM, US inflation was up 0.6%. This as soaring demand and a lack of supply caused by disruptions to global supply chains due to COVID-19 continue to drive up the prices of goods. US 4Q21 GDP growth was revised 0.1-ppt higher from January’s advance estimate – growing at an annualised rate of 7.0% vs the 2.3% growth recorded in 3Q21.
The UK’s blue-chip FTSE 100 ended last month 0.1% down (+1.0% YTD), while in economic data, UK 4Q21 GDP is estimated to have increased by 1.0% YoY, following a downwardly revised 1.0% rise in 3Q21. Following a 9.4% drop in 2020, UK GDP for 2021 increased by an estimated 7.5%. Meanwhile, January UK inflation hit its highest level (of 5.5%) in 30 years.
In Europe’s largest economy, Germany, the DAX closed February 6.5% down (-9.0% YTD), while the eurozone’s second-biggest economy, France’s CAC Index fell by 4.9% MoM (-6.9% YTD). According to Eurostat, eurozone inflation rose 5.1% YoY in January – above both November and December 2021’s levels of 5% and 4.9% YoY, respectively. It was also the highest level since recordkeeping started in 1997, with energy prices (+28.6% YoY) playing a major role in the jump.
In China, Hong Kong’s Hang Seng Index was down 4.6% MoM (-2.9% YTD), while the Shanghai Composite Index rose 3.0% MoM (-4.9% YTD). In economic data, China’s official manufacturing purchasing managers index (PMI) rose to 50.2 in February after falling to 50.1 in January. China’s official non-manufacturing PMI, which measures business sentiment in the services and construction sectors, advanced to 51.6 last month vs 51.1 in January. The 50-point mark separates expansion from contraction.
Elsewhere, Japan’s benchmark Nikkei closed February 1.8% lower (-7.9% YTD), while that country’s economy grew by an annualised 5.4% in 4Q21 as a drop in COVID-19 cases propped up consumption.
Among commodities, oil prices spiked in February (Brent crude +10.7% MoM [+29.8% YTD]) ending the month above the US$100/bbl level. This as the global economy recovers from the worst of COVID-19 restrictions, while natural gas prices in Europe have surged because of depleted winter reserves, lower supplies from Russia and its invasion of Ukraine. After falling 1.8% in January, the gold price soared 6.2% (+4.4% YTD) in February as demand for safe havens took the gold price above US$1,900/oz (to close the month at US$1,908.99/oz). Platinum and palladium prices gained 2.5% and 5.8% MoM (+8.1% and 30.9% YTD), respectively. After jumping 11.6% MoM in January, the iron ore price fell 10.4% MoM but is still 7.7% higher YTD. In a note, Huatai Futures wrote that the recovery in China’s steel consumption has been slow and below market expectations, adding that demand optimism is easing.
While most major global markets ended in the red, mining sector stocks drove South Africa’s (SA’s) FTSE JSE All Share Index 2.4% higher in February (+3.2% YTD). Diversified miners, oil, platinum group metal (PGM), and financial counters were the outperformers on the JSE, with the Resi-10 soaring 14.3% MoM (+18.8% YTD) and the Fini-15 rising by 3.6% MoM (+7.1% YTD) as the banks released better-than-expected trading updates, showing strong earnings momentum than expected (Nedbank +14.7% MoM, Standard Bank +8.9% MoM, FirstRand +7.2% MoM). For a second month running, the Indi-25 and the SA Listed Property Index were the laggards – down 7.7% (-9.6% YTD) and 3.3% MoM (-6.0% YTD), respectively. Highlighting February’s best-performing shares by market capitalisation, the large-cap commodities companies outperformed, with Anglo American Platinum (Amplats) soaring 29.4% MoM, Impala Platinum (Implats) jumping 25.5% MoM, Anglo American leaping 15.4% MoM, Glencore rising 13.8% MoM, and BHP, now the largest company on the JSE, up 5.9%. Once again Prosus and Naspers disappointed – down 26.0% and 21.7% MoM, respectively, while Richemont lost 5.6% MoM. The rand was basically unchanged MoM vs the US dollar (+0.1%) and is now 3.7% firmer YTD.
In local economic data, January’s annual headline inflation, as measured by the consumer price index (CPI), appears to have passed its peak, printing at 5.7% YoY vs 5.9% YoY in December. Stats SA said the key drivers were once again food, energy, and transportation costs. Retail sales rose more than expected in December (printing at 3.1% from 2.7% for November), primarily driven by the relaxation of lockdown restrictions, which created an enabling environment for consumers to shop around and the usual festive season splurge. Although the emergence of the Omicron variant led to various travel bans by key tourist markets for SA, local tourism boomed. Pent-up demand, accompanied by lenient lockdown restrictions were further supportive of this.
National Treasury’s (NT’s) 2022/2023 Budget was tabled in Parliament on 23 February. Minister of Finance Enoch Godongwana’s maiden budget turned out to be a fairly neutral affair with the market having already largely priced-in many of the ‘good news’ elements of the budget. The anticipated revenue overrun was partly used for a permanent reduction in the debt/GDP ratio and partly absorbed by expenditure increases, while the final tax revenue figures for the 2021/2022 financial year exceed the 2021 Budget estimate by R181.9bn and the 2021 Medium Term Budget Policy Statement estimate by R61.7bn. This better-than-expected performance, while broad-based, has largely been driven by corporate income tax (CIT) – CIT’s sterling performance is attributed to high commodity prices, which have boosted the profits of mining companies over the period.
On the pandemic front, as at 28 February, Department of Health data show that 31.4mn vaccines have been administered to date (vs 29.89mn as at 31 January), while the total number of confirmed COVID-19 cases in SA since the start of the pandemic stood at 3.67mn vs 3.61mn on 31 January.
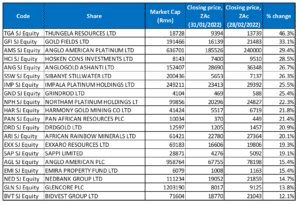
Figure 1: February 2022’s 20 best-performing shares, % change
Source: Bloomberg, Anchor
Local mining and resources counters were the star performers on the JSE in February buoyed by strong gains in commodities and metals prices, especially in those commodities that Russia is a major producer of including platinum (+2.5% MoM), palladium (+5.8% MoM) and Brent crude oil (+10.7% MoM). This as the West stepped up sanctions on Russia for invading Ukraine. Gold also closed at US$1,908.99/oz, recording its best monthly performance since May 2021.
Against this backdrop, Thungela Resources (+46.3% MoM) was February’s best-performing share by far. Thungela, which was previously owned by Anglo American under its thermal coal unit, released an impressive trading update on 11 February, which saw its share price rocket c. 12% on the day. According to the trading update, earnings per share (EPS) for the year-ended 31 December 2021 (FY21) are expected to be between R60.32 and R61.27, reflecting a significant increase of between R65.63 and R66.58/share on the R5.31 loss per share it recorded for FY20. Headline earnings were also projected at between R6.9bn and R7bn vs a headline loss of R0.3bn in the previous year. Thungela said that the earnings surge was due to a rise “in revenue driven by the strong price environment for thermal coal” during 2021.
Thungela was followed by Gold Fields in second spot, with a 33.1% MoM gain. The gold miner released FY21 results, which were buoyed by increased output and higher gold prices. Group revenue rose to US$4.20bn from US$3.89bn posted in the previous year, while diluted EPS increased 8.6% YoY to ZAc88. Gold Fields said that South Deep recorded a standout performance with its gold production significantly exceeding original guidance. Gold production rose 29% YoY to 9,102kg, while total all-in costs decreased by 1% YoY to R655,826/kg.
Amplats was February’s third best-performing share, gaining 29.4% MoM after releasing record-breaking FY21 results. The Group achieved an all-time high production of 5.1mn ounces of refined PGMs, and its sales rose 82% YoY to 5.2mn ounces. A 22% YoY increase in the rand cost of PGMs contributed to the record results. This saw its FY21 headline EPS soaring to R300.42 from R115.54 the prior year (FY20). The company also announced that it is paying out R80bn in dividends (a c. R300/share payout).
Hosken Consolidated Investments (HCI), AngloGold Ashanti, and Sibanye Stillwater followed Amplats, with MoM gains of 28.5%, 26.7%, and 26.3%, respectively. AngloGold Ashanti’s share price rose in February despite the firm reporting a 38.7% YoY drop in FY21 profit and headline EPS of USc146 – down from USc238 a year ago. This was mainly due to lower sales volumes for gold owing to the disposal of its SA operation, higher operating costs, and unfavourable exchange rate movements. The company said that it experienced a “challenging 2021” period characterised by COVID-19 disruptions, lower grades, and the temporary suspension of production at a key mine in Ghana. Meanwhile, Sibanye Stillwater, the world’s largest PGM producer, benefitted from soaring PGM prices.
Sibanye was followed by Implats (+25.5% MoM) and Grindrod Ltd (+25.4% MoM). Implats gained on the back of the Russia/Ukraine conflict and the resultant elevated strength in PGMs, which will benefit local suppliers. Implats also released 1H22 results, which showed headline earnings coming in at R13.8bn (-4% YoY) and headline EPS of ZAc1,690 (-9% YoY). The company said that it has spent R9.2bn on acquiring 35.3% of the shares in Royal Bafokeng Platinum (RBPlat) during the period, and it has made an offer for the rest of the shares at R90/share plus 0.3 Implats shares (the offer is valued at c. R178/share).
Rounding out the 10 best-performing shares were Northam Platinum (Northam), which rose by 22.3% MoM, and Harmony Gold, which recorded a 21.8% MoM gain. These counters were boosted by broad-based gains in mining sector stocks as investors continued to digest the latest developments in the Russia-Ukraine conflict and a risk-off environment supporting gold (in the case of Harmony). On Monday, Harmony also released 1H22 results, which showed a 65% YoY drop in half-year profit, due to a one-off gain recorded a year earlier and higher production costs. Headline EPS came in at R2.48 vs with R7.13 a year ago and the gold miner announced a dividend of ZAc40/share.
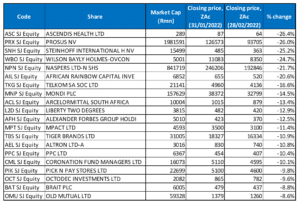
Figure 2: February 2022’s worst-performing shares, % change
Source: Bloomberg, Anchor
Pharmaceutical company, Ascendis Health (-26.4% MoM), was February’s worst-performing share. Shares in Ascendis remained under pressure after the company, in its 1H22 results, said that its revenue had decreased to R298.38mn from R495.94mn posted in the corresponding period of the previous year, while its diluted EPS rose YoY to ZAc48.60. At an operational level, its normalised headline loss strengthened to an R438mn loss, which included recapitalisation finance costs of R366mn. The company said that its recapitalisation was largely complete and that its debt had been reduced by R7.7bn.
Prosus (-26.0% MoM) was February’s second-worst performing share. The share prices of both Naspers (-21.7% MoM) and Prosus plunged last week on renewed concerns about stricter tech regulations in China, which saw a large sell-off affecting their largest asset, Tencent on 21 February (Tencent lost c. 5.0% on the day). Prosus’ share price has been under pressure since China started its crackdown on tech companies around July 2021.
Steinhoff came in third, with an MoM decline of 25.2%. Media reports in February suggested that Steinhoff was suing British businessman Malcolm King, his son Nicholas, and their company Formal Holdings in the UK for c. R1.6bn. According to reports, Steinhoff’s former CEO Marcus Jooste had allegedly used their company as part of a scheme to defraud Steinhoff via a series of fake loan agreements, which the Kings have denied. Steinhoff had previously warned in its annual report that it may look to recover some of the funds it had lost through the fraud by litigation. Steinhoff also recently concluded agreements for a R24bn global settlement scheme with previous litigants against it.
Construction Group, Wilson Bayly Holmes-Ovcon (WBHO; -24.7% MoM), surprised the market last week by saying that its Australian division is headed for business rescue because of a withdrawal of Group financial support. WBHO has provided c. R2bn to the struggling division over the past four years, but a proposed R3bn sale of its 88% stake in Australian unit Probuild fell through last year, reportedly blocked on national security grounds because the buyer would have been a Chinese company. This news sent the WBHO share price down 27.1% on 23 February. WBHO also warned in its FY21 trading statement that it expects to report a headline loss per share of at least R16.11 for 1H22, vs earnings of ZAc82c reported in the previous year. This means a headline loss of about R1bn for the Group (which has a market value of R5.2bn).
WBHO was followed by African Rainbow Capital Investments (-20.6% MoM), and Telkom (-16.6% MoM). So far, 2022 has been a difficult period for Telkom, with investors responding negatively to its decision to challenge SA’s upcoming spectrum auction in court (Telkom withdraw the legal action later), while President Cyril Ramaphosa has asked the SIU to investigate Telkom for possible corruption relating to, amongst other issues, its dealings in Mauritius and Nigeria dating back to 1 June 2006. The share price was hit hard after it reported in early February that the double-digit customer growth in its mobile business was insufficient to offset the continued decline of its traditional fixed-line business and supply challenges in 4Q21. Telkom said customer numbers grew 10% YoY to 16.4mn in its third quarter to end-December, but revenue fell 2.3% YoY to R10.78bn, with its IT services unit struggling to meet orders for hardware because of the global chip shortage.
Rounding out February’s 10 worst-performing shares were Mondi Plc, ArcelorMittal SA, and Liberty Two Degrees, which posted MoM declines of 14.5%, 13.4% and 12.9%, respectively. Paper and packaging company, Mondi’s share price came under pressure amid reports that one of its largest operations is the massive Mondi Syktyvkar plant in Russia’s Komi region, and that it was suspending operations at its plant in the western Ukraine city of Lviv.
Steel producer, ArcelorMittal SA posted its strongest annual results since 2008 last month, buoyed by soaring steel prices, and after cutting its debt by two-thirds. For FY21, headline earnings of R6.86bn recovered from a loss of R2.033bn in FY20, while its headline EPS came in at R6.15 vs an FY20 headline loss per share of R1.85. Revenue increased 61% YoY to R39.7bn on the back of a 13% rise in total steel sales volumes and a 47% increase in net-realised steel sales prices. However, the company’s share price, which has been on a tear over the past year or so (the share soared by 788% in 2021), took a break in February declining for the first time in months.
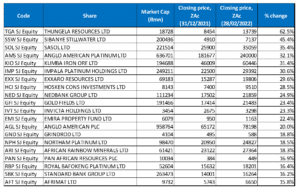
Figure 3: Top-20 February 2022, YTD
Source: Anchor, Bloomberg
Fifteen out of February’s top-20, MoM best-performing shares also featured among the top-20 performers YTD (to end February), with Sasol (+35.4% YTD), Kumba Iron Ore (+31.4% YTD), Invicta Holdings (+23.3% YTD), RB Plats (+16.4%), Standard Bank (+16.2% YTD) and Afrimat (+15.8% YTD), replacing MoM top performers AngloGold Ashanti, Harmony, DRD Gold, Sappi, Glencore, and Bidvest.
Thungela Resources (+62.5% YTD, discussed earlier) took the top spot in both rankings, while Sibanye Stillwater (+45.4% YTD) was in second spot among the YTD best performers vs sixth position MoM. Sasol (+35.4% YTD) was the third best-performing share YTD (Amplats took this honour MoM and was in fourth spot YTD). Sasol reported results for the six months ended 31 December 2021 (1H22) on 21 February. Operationally, it was a disappointing period for Sasol due to lower production volumes at its Secunda Operations on the back of “operational challenges.” However, this was offset by strong crude oil and chemical prices, coupled with increased demand. Earnings before interest and tax came in at R24.3bn (+12% YoY), while adjusted earnings before interest, tax, depreciation, and amortisation (EBITDA) jumped 71% YoY to R31.8bn. Although net debt/EBITDA halved YoY to 1.3x, it was higher than we had expected, especially given that it was at 1.5x on 30 June 2021 and all earnings have been retained over the period. The company also showed a significant improvement in its balance sheet with the finalisation of some of its asset sales and strong cash flow resulting in Sasol’s long-term debt declining by c. R36bn (short-term debt rose by c. half this amount). Sasol is a cyclical business that is currently benefiting from the tailwinds of strong prices of its commodities. Simultaneously, much lower capex spending and a much-improved balance sheet mean that the risk profile of the business has improved materially over the past couple of years.
Kumba Iron Ore (Kumba) is this year’s fifth best-performing share with a YTD gain of 31.4%. Kumba reported FY21 results on 22 February, with its revenue increasing to R102.09bn from R80.10bn posted in FY20, while diluted EPS rose 46.0% YoY to R103.37. As a commodity producer, Kumba can only really focus on its controllables – volumes, and costs. On those fronts, its 2021 performance was mixed – cost performance was poor, and we estimate that cash cost per tonne ($/t) was up 28% at a Group level. Cost inflation was driven by higher fuel and freight costs, supply-chain disruptions and the rand strengthening by 10% during the period. Production was up 9% in 2021 but that was largely a result of production levels normalising after pandemic-related volume declines in 2020. Despite a poor operational performance in 2021, it was still a great year for Kumba thanks to phenomenal iron ore prices – the 2021 realised iron ore price of $161/t is the second-highest price on record, beaten only by $166/t realised in 2011. Kumba once again generated a tonne of cash – R103 of HEPS and R133 of free cash flow per share. It declared a dividend equal to 100% of HEPS (DPS=R103) and ended the year with R56/share in net cash.
Kumba was followed by Implats, Exxaro, HCI, Nedbank, and Gold Fields, with YTD gains of 30.6%, 29.6%, 28.5%, 24.9%, and 23.4%, respectively. Nedbank said in a trading update last month that it expects its FY21 headline EPS to rise by a better-than-expected 108%-118% YoY. The bank said that the jump in profit was due to “… a stronger-than-expected performance in the last few months of 2021, as operating conditions for the bank and its clients continued to improve”.
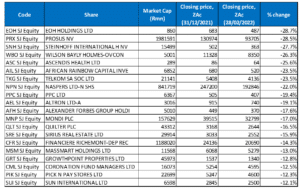
Figure 4: Bottom-20 February 2022, YTD
Source: Anchor, Bloomberg
Among the YTD worst-performing shares, 13 of the 20 worst-performers MoM also featured among the 20 worst performers for the year to end February. EOH Holdings (-28.7% YTD), Quilter Plc (-16.5% YTD), Sirius Real Estate (-15.9% YTD), Richemont (-14.3%), Massmart (-13.0% YTD), Growthpoint Properties (-12.8% YTD), and Sun International (-12.1% YTD), replaced the MoM worst performers that included ArcelorMittal SA, Liberty Two Degrees, MPact, Tiger Brands, Octodec, Brait and Old Mutual.
While Ascendis Health was February’s worst-performing share, EOH Holdings took that position YTD with a 28.7% share price decline to end-February. EOH was followed by Prosus (-28.5% YTD), Steinhoff (-27.7% YTD), and WBHO (-26.3% YTD) – these three occupied the same spots among the MoM worst performers.
Following WBHO, was Ascendis Health, African Rainbow Capital Investments, and Telkom with YTD declines of 25.6%, 23.5%, and 23.5%, respectively. Naspers (-22.0%), PPC (-19.4%) and Altron (-19.1%) accounted for the remainder of the 10 worst-performing counters YTD.

