Most major global equity markets delivered a mixed but resilient performance in February (MSCI World +0.8% MoM/+3.0% YTD) with major indices oscillating between losses and rebounds amid volatility linked to artificial intelligence (AI) sentiment, questions about AI disruptions to various industries and ongoing macroeconomic and geopolitical pressures. Historically, February has been a mediocre month for equities and is often characterised by moderate market volatility.
A central theme was the scale and sustainability of technology investment. Major US tech firms announced their 2026 AI-related capital expenditure (capex) plans, projected to increase by 40%-plus to c. US$650bn, following an estimated US$450bn spent in 2025. While AI demand continues to exceed expectations, supporting significant investment across cloud platforms and chipmakers, investor focus has shifted from enthusiasm to return discipline, with markets increasingly differentiating between companies generating sustainable earnings growth and those primarily expanding spending.
Geopolitics and policy also contributed to the uncertainty. Tensions between the US and Iran intensified, while the US Supreme Court ruled that several tariffs introduced by President Donald Trump were unconstitutional, citing Congress’s authority over taxation. Trump’s State of the Union address reinforced his uncompromising stance on tariffs, sustaining policy uncertainty. The three major US indices ended February mixed, with the S&P 500 down 0.8% MoM (+0.7% YTD), while the Nasdaq fell 3.4% MoM (-2.5% YTD). The Dow ended 0.2% firmer (+1.9% YTD) – its tenth straight monthly gain.
US macroeconomic data were mixed. January headline inflation moderated modestly to 2.4% YoY vs December’s 2.7% reading, though core inflation, which strips out volatile food and energy prices, remained sticky at 2.5% YoY (vs the prior month’s 2.6%). US 4Q25 GDP growth slowed to 1.4% annualised, well below consensus estimates for a 2.5% gain and 3Q25’s 4.4% growth. December’s core personal consumption expenditure (PCE), excluding food and energy, the US Federal Reserve’s (Fed) preferred inflation gauge, printed at 3.0% YoY, up from November’s 2.8%. December retail sales momentum softened, coming in flat after rising 0.6% in November. Consumer confidence rebounded more than expected in February, rising above prior months following January’s slump. The minutes of the Fed’s last meeting highlighted the differing views among policymakers regarding the appropriate path for interest rates.
European equities extended their YTD gains, supported by improving economic data and capital flows seeking diversification from US equity markets and especially mega-cap concentration. The Euro Stoxx 50 Index climbed 3.3% MoM (+6.2% YTD), its eighth consecutive monthly advance. France’s CAC gained 5.6% MoM (+5.3% YTD), and Germany’s DAX advanced 3.0% MoM (+3.2% YTD). On the data front, eurozone annual inflation printed at 1.7% in January, down from 1.9% in December.
UK equity markets were particularly strong, with the FTSE 100 climbing to record levels (+7.0% MoM/+10.2% YTD). January inflation moderated to 3.0% YoY vs December’s 3.4% print – its lowest level since March 2025. Core inflation slipped to 3.1% YoY from December’s 3.2%. The UK economy experienced modest 4Q25 growth of 0.1% (unchanged from 3Q25) as business investment shrank and services stagnated. For 2025, GDP rose 1.3%. Earlier in February, the Bank of England voted narrowly to keep rates on hold at 3.75%, given persistent inflationary pressures.
Performances in Asia diverged. In China, equity markets have shown resilience but were relatively subdued despite positive policy expectations amid anticipated meetings, including this week’s National People’s Congress (NPC), with expectations of further government stimulus and policy support. The Shanghai Composite gained 1.1% (+5.0% YTD), while Hong Kong’s Hang Seng declined 2.8% MoM (+3.9% YTD).
Japan was a standout performer. The benchmark Nikkei ended February up 10.4% (+16.9% YTD), hitting new highs during the month, driven by renewed investor interest in domestic cyclicals, consumer and financial counters and companies leveraged to AI-related supply chains. Japan headline inflation decelerated sharply, falling to 1.5% in January vs December’s 2.1% YoY – the first time since 2022 that overall inflation has dropped below the Bank of Japan’s target.
Commodities strengthened amid heightened geopolitical tension as investors got increasingly jittery over an escalation in the US/Iran conflict. Possible Strait of Hormuz disruptions sent Brent crude prices higher (+2.5% MoM/+19.1% YTD). A flight to safety saw the gold price jump 7.9% MoM (+22.2%YTD), while platinum group metals (PGMs) posted solid advances – platinum +7.9% MoM (+15.0% YTD), palladium +4.4% (+10.4% YTD), and rhodium +7.2% MoM (+29.2% YTD) – reinforcing positive sentiment towards resource-heavy markets.
Against this backdrop, the JSE delivered another strong month. After a shaky start amid global volatility and commodity jitters, the local bourse again flexed its resource muscles, pushing the FTSE JSE All Share Index (ALSI) higher (+7.0% MoM/+10.9% YTD) for a twelfth consecutive month. The rand firmed by 1.3% MoM (+3.9% YTD) against a slightly stronger greenback – US Dollar Index +0.6% MoM (-0.7% YTD). Performance was once again led by resources (Resi-10 +13.4% MoM/+28.4% YTD), supported by elevated precious metals prices. Financials also contributed (Fini-15 +7.4% MoM/+10.5% YTD), while the SA Listed Property Index gained 6.3% MoM (+7.3% YTD). Industrials (Indi-25 -0.1% MoM/-4.1% YTD) were broadly flat as weakness in large investment holdings (conglomerates Naspers and Prosus recorded double-digit declines) offset gains elsewhere.
The SA economic data were broadly stable. January headline inflation eased slightly to 3.5% YoY from 3.6% in December, while core inflation remained contained at 3.4%, advancing from December’s 3.3% and undershooting market expectations. December SA retail sales rose 2.6% YoY, following November’s 3.6% YoY (revised) lift. The 4Q25 Quarterly Labour Force Survey (QLFS) showed that the country’s official unemployment rate continued its easing trajectory, decreasing from 31.9% in 3Q25 to the current 31.4%. The number of unemployed people fell to 7.84mn from c. 8.01mn previously.
The 2026 National Budget largely reaffirmed fiscal consolidation, with national debt projected to peak this year. While fiscal discipline remains essential and SA continues to navigate constrained economic conditions, the overall tone was measured and pragmatic. Encouragingly, soaring gold and platinum prices have seen tax revenues from mines increase, and a R21bn stronger-than-expected revenue collection relative to prior forecasts has supported the fiscal framework, allowing the National Treasury to avoid material tax increases.
Figure 1: The 20 best-performing shares in February 2026, MoM % change
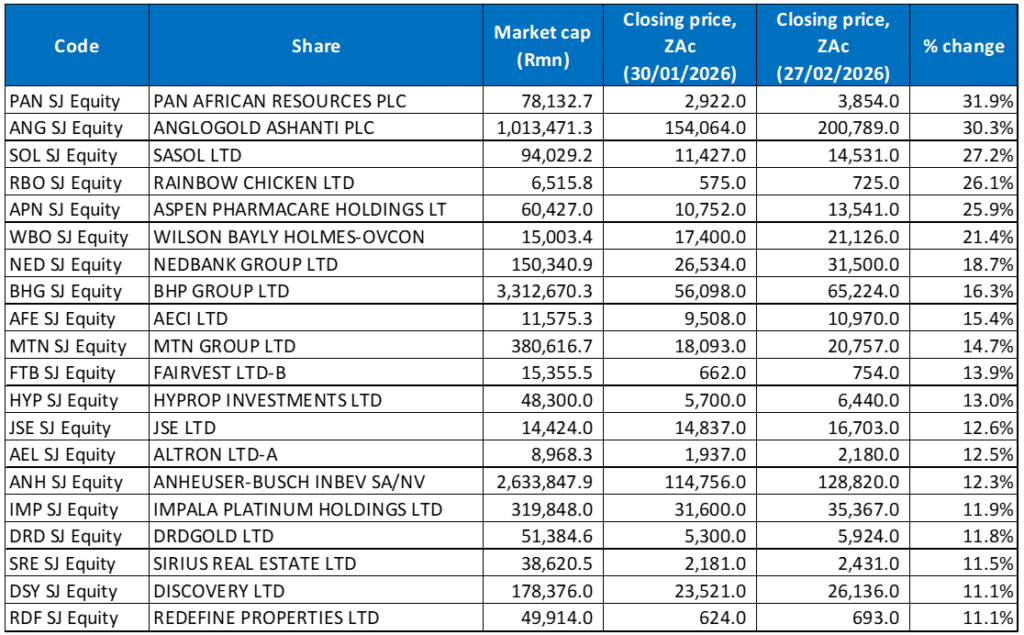
Source: Bloomberg, Anchor Capital
At a stock level, commodity shares on the JSE dominated performance again in February, with metals and energy-linked counters, especially miners, delivering notable gains. Selective performances in financials, property and industrials also contributed to the JSE’s resilience. Pan African Resources (+31.9% MoM) was last month’s best-performing share as 2025’s gold price windfall saw it declaring a maiden 1H26 dividend of ZAc12/share. Revenue rose 157.3% YoY to US$487.1mn, and debt was c. 70% lower at US$46mn. Gold production increased 51.5% in the six months, while profit soared 211.9% YoY to a record US$147.8mn as it benefitted from the higher gold price. Headline earnings per share (HEPS) rose 511.7% YoY to USc7.34.
AngloGold Ashanti (+30.3% MoM) reported record FY25 profits and significant shareholder payouts. Its headline earnings nearly tripled (+186% YoY) to US$2.725bn, driven by the gold price boom, integration of the Sukari mine and higher production (annual production rose 16% YoY to 3.1mn ounces). Core earnings surged 129% YoY to US$6.3bn. Higher revenues translated directly into record cash flow and earnings. Adjusted EBITDA increased 129% YoY to a record US$6.3bn in 2025 (vs FY24’s US$2.7bn), while free cash flow (FCF) rose 204% YoY to US$2.9bn.
Sasol gained 27.2% MoM, despite reporting a 95% YoY plunge in half-year earnings caused by lower average oil prices and weaker chemical prices. However, the market seemed to react positively to the potential for higher oil prices as tensions in the Middle East escalated, and Sasol focuses on slashing capital expenditure. Strict cost controls and lower capital spending also helped the Group generate positive FCF for the first time in four years. Still, HEPS fell 34% YoY to R9.27, while earnings before interest and tax (EBIT) were down 52% to R4.6bn. Adjusted EBITDA decreased by 12% YoY to R21bn, showing a 17% fall in the average rand Brent crude oil price and weaker global chemicals prices. The company said improved refining margins, higher sales volumes and lower fixed costs partly offset these pressures. Group revenue was broadly unchanged at R122.4bn, supported by a 3% YoY increase in sales volumes despite what Sasol described as a softer macroeconomic environment.
Rainbow Chicken Ltd, Aspen Pharmacare and Wilson Bayly Holmes-Ovcon (WBHO) followed Sasol with MoM price gains of 26.1%, 25.9%, and 21.4%. The Rainbow Chicken share price jumped after it said in a trading statement that it was on track to more than double its profit for the six months to the end of December. It expects HEPS to range between ZAc69.46 and ZAc76.59, up from ZAc35.64 reported in the same period last year. The growth is driven by a strong agricultural performance, improved operational efficiencies, robust demand for its products and lower feed costs resulting from reduced commodity prices. Meanwhile, construction firm WBHO, which recorded a c. 30% share price decline last year, seems to have turned into a turnaround story. The Group exited its loss-making UK operations and has doubled down on SA and the broader Africa region, pushing towards stronger cash generation and more conservative risk-taking on large projects, which is helping reassure investors. In addition, government and private sector spending on roads, housing, industrial parks, and logistics is growing off a low base, and WBHO is a key contractor in that mix. Last week’s Budget also emphasised using infrastructure development as the primary catalyst for economic growth, job creation, and service delivery. The government highlighted a shift towards growth-enhancing public infrastructure, with R1trn-plus in public-sector spending allocated over the medium term.
Nedbank Group (+18.7% MoM) said in a trading statement last month that it expects its full-year HEPS to be 1% to 3% higher YoY and in the range of ZAc3,667 to ZAc3,740. The banking Group’s net asset value (NAV) per share is expected to be between ZAc24,760 and ZAc25,241 – up between 3% and 5% YoY. In August 2025, Nedbank announced the sale of its 21.2% shareholding in ETI for US$100mn (c. R1.7bn) to Bosquet Investments. The transaction was completed in December after the required regulatory approvals were received. The disposal represents a reset of Nedbank’s strategy in the broader African continent, with a clearer focus on the Southern African Development Community (SADC) and East Africa regions in those businesses it owns and controls.
BHP Group, AECI and MTN Group accounted for the remainder of February’s top-ten performers, with MoM advances of 16.3%, 15.4%, and 14.7%, respectively. BHP reported a stronger-than-expected half-year underlying profit, driven by copper, which for the first time surpassed iron ore in its earnings, as prices for the metal surged on AI-fuelled demand.
Record earnings from its mining division have helped the chemicals solutions Group AECI report a marked improvement in its full-year operational and financial performance. FY25 HEPS increased by 53% YoY to ZAc1,098, with EBITDA from continuing operations up 12% YoY to R3.4bn. Revenue from continuing operations was down 4% to R32.2bn, while a final dividend of ZAc128/share was declared, taking its total dividend for the year to ZAc228.
In February, MTN announced its decision to buy the 75% it does not already own in Africa’s largest cellphone tower operator, IHS, for US$2.2bn (c. R35bn) in an all-cash transaction, with the Group saying the deal will result in a service-revenue uplift and core earnings margin expansions. After the deal, which values IHS at US$6.2bn, the tower operator will delist from the New York Stock Exchange.
Figure 2: The 20 worst-performing shares in February 2026, MoM % change
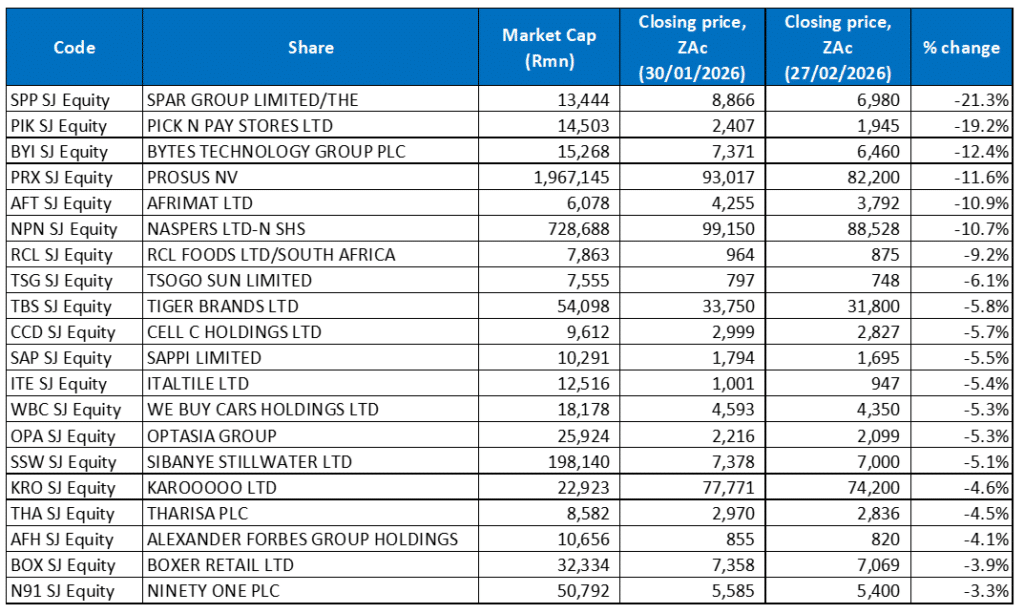
Source: Bloomberg, Anchor Capital
On the downside, the worst-performing shares were generally consumer-facing retailers, and those companies which are less tied to commodities and global cyclicals. Two major SA food retailers, SPAR Group and Pick n Pay Stores, took the first and second spot, with MoM declines of 21.3% and 19.2%, respectively. Shares in SPAR tumbled to levels last seen in 2010 after it released a trading update (18 weeks ended 30 January 2026), which rattled shareholders. By the end of the day (23 February), the share price had dropped by 10%. Over the past year, SPAR has lost more than 50% its value, making it the worst-performing large food retailer in SA. The trading update showed slow revenue growth and heavy margin pressure in an intensely competitive food retail market. SPAR’s wholesale turnover growth in Southern Africa was muted at 0.9% YoY, with total Group sales up 2.1% YoY to R49.4bn. Despite improved momentum in late 2025, profit margins fell due to intense promotions and KZN SAP system issues.
Pick n Pay’s share price dropped the most in a year on 10 February, after it warned its FY26 losses will be larger than previously expected. The share’s sell-off followed a trading update in which the Group said its headline loss per share for the year is expected to worsen by more than 20% YoY after weaker-than-expected trading over the festive season. For the 48 weeks to 1 February 2026, Group turnover rose 3.2%, but growth slowed in 2H26 as Pick n Pay said November trading was particularly poor, reflecting pressure on consumers. The stock has had a difficult start to 2026 and is down 21.9% YTD.
Bytes Technology Group (-12.4% MoM) was the third-largest detractor, extending its recent share price weakness. Prosus NV (-11.6% MoM), Afrimat (-10.9% MoM) and Naspers Ltd (-10.7% MoM) also declined materially over the month. Technology-linked investment holdings, including Prosus, Naspers, and Bytes Technology, were adversely affected by the broader consolidation in global tech shares during February. In addition, Chinese tech conglomerate Tencent, the largest underlying holding of Naspers and Prosus, fell 15.0% MoM, reflecting broad weakness across China’s tech sector.
Mid-tier open-pit mining and materials Group, Afrimat, released a pre-close operating update ahead of its FY26 year-end, revealing solid operational progress despite constrained local economic conditions. Its Aggregates segment delivered a good performance, non-core brick, block and ready-mix assets were successfully sold, and cement losses narrowed in 2H, although the segment remains loss-making. Local iron ore volumes improved on higher offtake from ArcelorMittal, while international iron ore sales were satisfactory despite rail constraints, with pricing averaging US$101/tonne. Its domestic anthracite volumes declined sharply due to ferrochrome smelter shutdowns, which were partly offset by higher exports. In the cement sector, it anticipated a 20% YoY increase in clinker production. Still, despite narrowing losses, the segment faces challenges due to the unpredictability of the domestic market and weather-related disruptions.
RCL Foods Ltd (-9.2% MoM) warned last week that its earnings could drop by as much as 45% for the six months to end-December, highlighting pressure on its operations. The Group said HEPS is forecast to be between ZAc74.3 and ZAc77.5, compared with ZAc109.4c previously, noting that the decline reflects underlying trading performance. RCL has previously said that its sugar business was negatively impacted by tough industry conditions as a surge of low-priced sugar imports flooded the SA market and pushed more of its product into exports, where prices were far weaker. This displacement and the lower international pricing had a materially negative effect on the segment’s performance.
Tsogo Sun and food company, Tiger Brands, were down 6.1% and 5.8% MoM, respectively. Tiger Brands released a quarterly trading update (to 31 January 2026) last month, which showed modest volume growth and improved operating profit as its gross margin strengthened on a favourable mix and continuous improvement initiatives, resulting in operating profit growth and the maintenance of a double-digit operating margin. Revenue from continuing operations rose 1.0% YoY, driven by 2.0% volume growth and 1.0% price deflation. In comparison, adjusted revenue was up 2.0% YoY, supported by 5.0% volume growth, particularly in its Culinary and Milling & Baking segments (which was partly offset by 3.0% price deflation). Still, ongoing pressure on its revenue growth, the competitive local consumer environment and price deflation in its key product categories continue to weigh on investor sentiment.
Finally, rounding out the ten worst-performing shares was Cell C (-5.7% MoM), as muted earnings momentum in its first reporting cycle and a modest revenue increase weighed on sentiment, as did recalibrating growth expectations in a capital-intensive, low-growth sector of the market.
Figure 3: The 20 best-performing shares YTD, % change
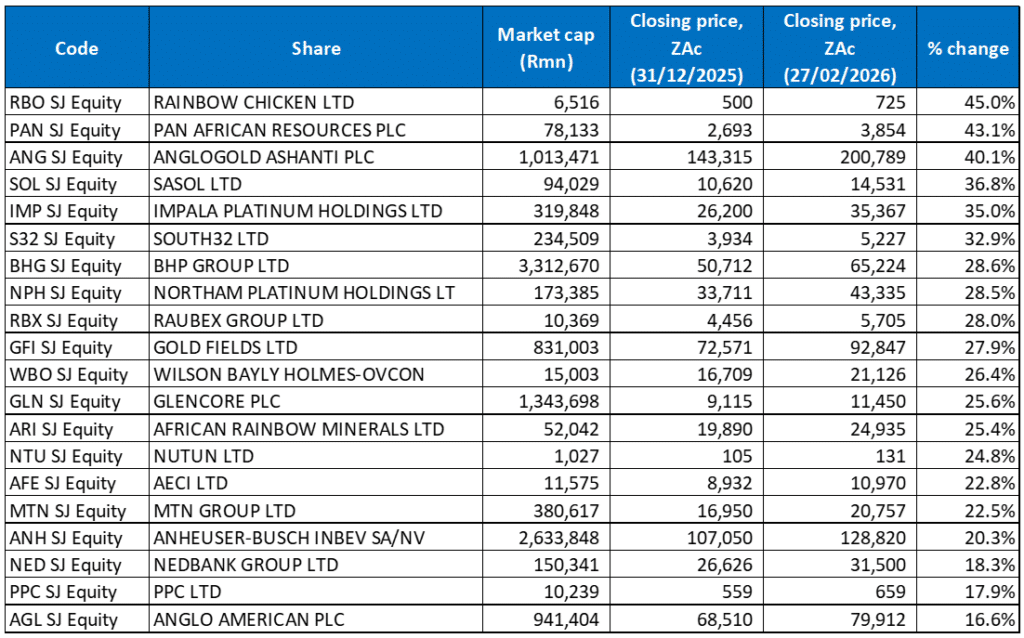
Source: Bloomberg, Anchor Capital
YTD, JSE-listed equities’ performances remained concentrated in commodity-linked shares, reflecting global precious metals strength and investor preference for cash-generative cyclicals in an environment of moderating growth and elevated geopolitical risk. Over half of the YTD best-performing shares featured prominently among February’s outperformers. Rainbow Chicken took the crown with a 45.0% YTD gain, followed by Pan African Resources Plc (+43.1% YTD) in second spot and AngloGold Ashanti in third place (+40.1%).
Sasol, Impala Platinum (Implats) and South32 followed with YTD advances of 36.8%, 35.0% and 32.9%, respectively. Implats’s share price rose after it said in a trading statement last month that HEPS were expected to increase between 392% and 411% YoY for the six months to 31 December 2025. The Group noted that this sharp increase in profit was due to the significant appreciation in achieved US dollar PGM basket pricing and the benefit of “commendable operational delivery.”
BHP Group (+28.6% YTD), Northam Platinum (+28.5% YTD), Raubex (+28.0% YTD), and Gold Fields (+27.9% YTD) accounted for the remaining ten best-performing shares. Northam reported a 60% YoY jump in revenue to R23.3bn in the six months to end-December, while operating profit was up 439% YoY at R5.84bn, and HEPS soared more than tenfold to R15.24. The company rewarded shareholders with a record interim dividend of ZAc700/share (more than triple its final FY25 dividend) as the miner bets on the fundamentals behind soaring PGM prices.
Gold Fields reported strong FY25 results, generating adjusted FCF of US$2.97bn vs US$605mn in FY24 and headline earnings of US$2.58bn compared with US$1.19bn in the same period of 2024. The results were buoyed by the gold price soaring by c. 65% in 2025, driven higher by geopolitical and economic uncertainty, expectations of US rate cuts and increased purchases by central banks.
Figure 4: The 20 worst-performing shares YTD, % change
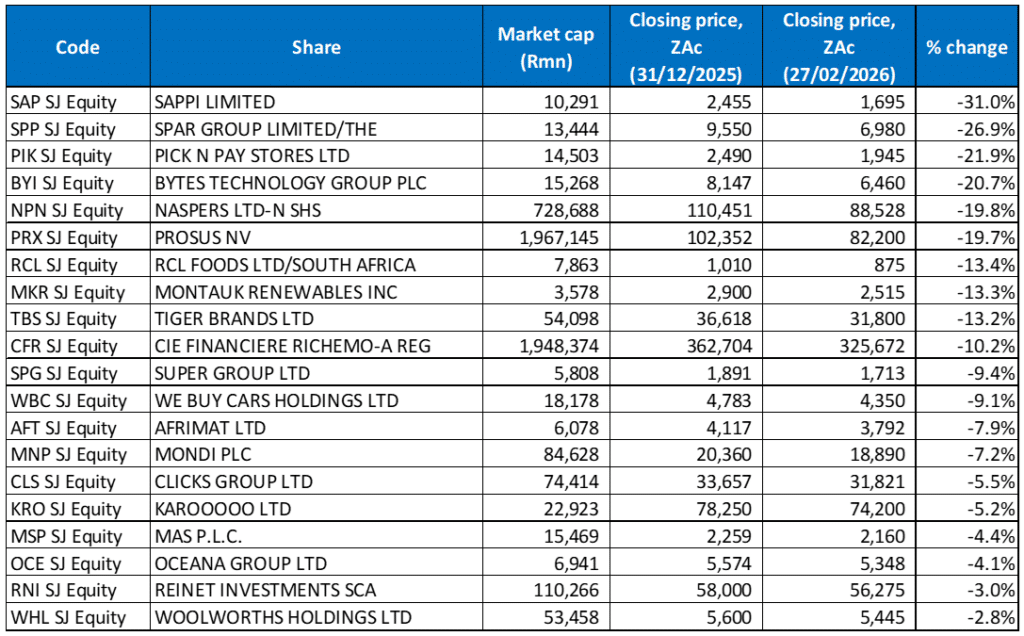
Source: Bloomberg, Anchor Capital
The YTD worst-performing shares were mostly made up of food retailers, industrials and tech-related stocks, with Sappi the worst performer YTD – down 31.0%. It was followed by SPAR (-26.9% YTD) and Pick n Pay (-21.9% YTD). Sappi has been under pressure for a while as its financial performance has deteriorated, with losses and margin pressure reflecting weaker global demand for its products and an oversupply in European paper markets. Rising debt and leverage, the suspension of dividend payments (and freezing of non-essential capex), and credit rating downgrades have further weighed on sentiment towards the share.
Pick n Pay was followed by Bytes Technology (-20.7% YTD) and investment conglomerates Naspers (-19.8% YTD) and Prosus (-19.7% YTD). Naspers/Prosus’ largest investment, Chinese tech giant Tencent (-15% MoM), was a key source of pain as China’s tech companies recorded their worst MoM performance in over 24 months in February.
RCL Foods, Montauk Renewables, Tiger Brands and Richemont accounted for the remainder of the ten worst-performing shares with YTD declines of 13.4%, 13.3%, 13.2%, and 10.2%. Richemont’s poor share price performance in January (-14.5%) has resulted in it remaining among the YTD worst performers despite a share price gain of 5.1% in February. The luxury goods Group delivered a largely positive trading update in January, with organic sales in its key jewellery division up 14% YoY. Despite this, Richemont’s share price struggled as investors focused on the potential impact on margins from surging precious metal prices and potential US tariffs related to the tensions between the US and Europe over Greenland’s sovereignty. Montauk Renewables, which specialises in the management, recovery and conversion of biogas into renewable natural gas, was 2025’s worst performer (-65.1% YoY), and its fortunes have not changed as its share price decline has continued this year.