August began with US recession fears sending shockwaves through global markets, causing steep losses in equities. Japan’s Nikkei 225 plunged 12.4% on 5 August as investors reacted to rising US unemployment and slower job creation data, which suggested an impending US economic slowdown. This pessimistic outlook was compounded by a stronger yen, which added to the challenges faced by Japanese exporters. Another reason touted for the volatility was the Bank of Japan (BoJ) hiking rates and sounding somewhat hawkish in its meeting minutes released on the day. On Wall Street, the sell-off started as soon as the US market opened. The S&P 500 dropped 4% before recovering some ground, ultimately ending the day c. 2.7% down – its worst performance since 2022. The Nasdaq plummeted 6% at one point on 5 August (it ended the day down c. 3.4%) as high-profile, big-tech counters (Apple, Amazon, Meta, Alphabet, Microsoft) and AI investments (Nvidia) – equity market stars in 1H24 – came under pressure. The CBOE Volatility Index (VIX), or “fear gauge”, briefly soared to its highest level since the early days of COVID-19. While these moves were exaggerated, they nonetheless underscored financial markets’ sensitivity to unfavourable economic data.
Fortunately, however, in an impressive recovery, by the second week of August, Wall Street had recorded a strong rally over several sessions before fluctuating between whiplash-inducing gains and losses as investors awaited updates from the US Federal Reserve (Fed) around interest rates. In his speech at the annual Jackson Hole economic symposium, Fed Chair Jerome Powell seemed to affirm that the Fed was finally prepared to cut rates, saying that “the time has come for policy to adjust” but adding the caveat that the timing and pace of interest rate cuts “… will depend on incoming data”. While Powell’s speech did not provide details about the extent and pace of monetary easing, market commentators interpreted it as the Fed’s intent to focus on data reflecting the current state of the US economy and the country’s macroeconomic outlook before deciding. Last week’s US economic releases (upwardly revised GDP data and jobless claims remaining steady and well below recession levels) supported the market’s soft-landing narrative. The prospect of accelerated monetary policy easing by the Fed and major central banks buoyed equities, with most major global markets ending August higher (MSCI World +2.7% MoM/+17.1% YTD).
In the US, the three major indices closed August in the green, with the tech stocks that powered US equity markets in 1H24 the laggards for a second month. The Dow reached new highs and rose by 1.8% MoM in August (+10.3% YTD), while the S&P 500 ended 2.3% higher MoM (+18.4% YTD) and the tech-heavy Nasdaq advanced by 0.6% MoM (+18.0% YTD).
On the economic data front, US July annual inflation slowed to its lowest level since 2021, falling for a third consecutive month, with headline inflation, as measured by the Consumer Price Index (CPI), advancing in line with expectations at 2.9% YoY vs June’s 3.0% print. July core CPI, excluding the erratic food and energy components, rose 3.2% YoY (matching forecasts) vs June’s 3.3% reading. MoM, July headline and core inflation both rose by 0.2%. July US retail sales advanced 1.0% MoM (beating estimates of a 0.3% increase) vs June’s revised print of -0.2%. YoY, retail sales increased by 2.7% vs June’s 2.3% rise. The core personal consumption expenditures (PCE) price index, excluding food and energy, a key Fed inflation gauge, rose 2.6% YoY in August (unchanged from July) and below expectations of a 2.7% increase. MoM, it was up 0.2%. According to the US Commerce Department, the second estimate for 2Q24 GDP growth increased at an annual rate of 3.0%, more robust than consensus expectations and the initial estimate of 2.8%.
Major European equity markets closed higher in August. MoM, Germany’s DAX was up 2.2% (+12.9% YTD), while France’s CAC ended the month 1.3% in the green (1.2% YTD). On the economic data front, July eurozone headline inflation rose unexpectedly to 2.6% YoY from 2.5% in June, higher than the 2.5% print consensus forecasts had expected. July core inflation, excluding energy, food, alcohol, and tobacco prices, hit 2.9% – higher than expected and unchanged from June. In Germany, July inflation rose unexpectedly to 2.3% YoY vs June’s 2.2% print, while France’s July inflation increased by 2.3% YoY vs June’s 2.2% print due to higher energy prices. The second estimate of Germany’s 2Q24 GDP confirmed that the economy contracted by 0.1% QoQ while YoY GDP rose 0.3%. Private consumption retreated by 0.2% QoQ, and investments dropped by over 2% QoQ, while government consumption rose by 1% QoQ. Net exports were also a drag on the growth data.
The UK stock market recorded a small advance, with the blue-chip FTSE-100 up 0.1% in August (+8.3% YTD). UK inflation ticked up for the first time in 2024, at 2.2% in July vs June’s 2.0% print, and edging slightly above the Bank of England’s (BoE) 2.0% target rate. The increase was primarily due to gas and electricity prices falling less than they did a year before. July core inflation (excluding energy, food, alcohol, and tobacco) came in at 3.3% – lower than June’s 3.5% YoY print. On 1 August, the BoE delivered its first interest rate cut in more than four years, lowering rates to 5%. However, BoE Governor Andrew Bailey warned that the central bank needed to “…make sure inflation stays low and be careful not to cut interest rates too quickly or by too much.”
In Asia, Chinese equities are increasingly dragging down EMs’ equity performance amid growing signs that the country’s economic stimulus is failing to boost consumer demand. Last month, Beijing ramped up stimulus to bolster consumption. At its Politburo meeting, chaired by President Xi Jinping, the Chinese government signalled its intentions to support the local economy, allocating CNY300bn (c. US$42bn) of ultra-long-term special treasury bonds to bolster large-scale equipment upgrades and a consumer goods trade-in programme. China’s central bank, the People’s Bank of China (PBOC), also said in August that it would embrace new policies to boost growth. Still, the broader outlook for the country seems uncertain, with the beleaguered property sector continuing to weigh on sentiment.
China’s equity markets remained volatile and ended August mixed, lagging regional peers and seemingly reflecting investors’ broader concerns for the country’s economy. The Shanghai Composite closed August 3.3% in the red (-4.5% YTD), while Hong Kong’s Hang Seng gained 3.7% MoM (+5.5% YTD).
China also recorded mixed economic data in August, with July retail sales rising (+2.7% YoY), the property slump persisting (property investment declined by 10.2% YoY in the first seven months of 2024), urban unemployment rising, and fixed-asset-investment growth slowing to 3.6% in 7M24 (constrained by the prolonged real estate crisis in the country). The annual inflation rate climbed to 0.5% in July 2024 from 0.2% in June, exceeding expectations of a 0.3% print and the highest level since February. The August Manufacturing PMI slowed again (to a six-month low), printing at 49.1, down from 49.4 in July – its sixth straight decline and fourth consecutive month below 50. However, the official non-manufacturing PMI, measuring business sentiment in the services and construction sectors, came in above 50, accelerating to 50.3 in August from 50.2 in July. The 50-point mark separates expansion from contraction.
Japan’s benchmark Nikkei ended August 1.2% lower, although it has run by 15.5% YTD. In economic data, July headline CPI stood at 2.8% YoY – unchanged from June’s print. However, Japan’s core-core inflation (excluding fresh food and energy prices and considered by the BoJ when formulating monetary policy) fell to its lowest level since September 2022, at 1.9% in July vs 2.2% in June. Japan’s 2Q24 GDP beat expectations, expanding by 0.8% QoQ and reversing a revised 0.6% decline in 1Q24. However, YoY GDP retreated by 0.8% – its second straight quarterly decline after falling by 0.9% in 1Q24.
Outside of gold, commodities remained under pressure in August. Although oil prices have been supported by ongoing geopolitical tensions in the Middle East, soft demand in China has negatively impacted the market for months, and the price of Brent crude declined by 2.4% in August (+2.3% YTD). Gold continued its uptrend (+2.3% MoM/+21.3% YTD), posting fresh highs (it reached US$2,531.72/oz on 20 August) and recording gains for four straight weeks, lifted by growing expectations of the US Fed cutting rates in September, its safe-haven status on the back of high interest rates, and worries that the escalating conflict in the Middle East could ignite a wider war. Among the platinum group metals (PGMs), the platinum price fell 5.0% MoM (-6.3% YTD), palladium rose 4.4% MoM (-11.9% YTD), and rhodium was up 1.1% MoM (+6.2% YTD). Iron ore rebounded slightly but ended August unchanged MoM (-27.6% YTD) as China’s inventories continued to decline – a tentative sign that the period of severe oversupply is starting to ease. China is the largest market for iron ore, and stockpiles at its ports have fallen for the past four weeks, providing some hope that demand for the steelmaking ingredient will increase.
In South Africa (SA), as has been the case over the past few months following the more market-friendly election outcome of a government of national unity (GNU) and renewed investment confidence, SA Inc. stocks (domestically focused shares) held up well on the JSE, with property shares, banks, insurers, and retailers the outperformers. The FTSE JSE All Share Index broke above another key point last month, breaching the 84,000 level on 21 August and closing at a record high of 84,553.5 on 27 August before retreating to end the month at 83,749.86. MoM, the index posted a 1.2% gain (+8.9% YTD), while the Capped SWIX rose 1.3% MoM (+11.5% YTD). The worst performers by far were materials counters as the prices of several commodities slipped (Resi-10 -10.1% MoM/-2.5% YTD). The SA Listed Property Index was the star performer, jumping by 8.3% MoM (+20.0% YTD) as property shares rebounded from a prolonged downturn on the back of improving investor sentiment and a flurry of deal-making. Industrial counters, as measured by the Indi-25, rose 4.0% (+10.2% YTD), while the Fini-15 gained 5.5% MoM (+17.1% YTD).
Highlighting the August share price performances of the largest JSE-listed shares by market cap, BHP Group, the biggest share on the exchange, declined by 2.9% MoM. Last month, BHP reported muted FY24 earnings growth and increased its underlying profit by a lacklustre 2% YoY to US$13.7bn. It also cut its dividend as it held on to cash to invest in organic growth in copper, which now accounts for c. 30% of its underlying profit. Meanwhile, the second and third-biggest shares on the bourse – Anheuser-Busch InBev (AB InBev) and Richemont were up 0.1% and 1.1% MoM, respectively. The rand strengthened by 2.2% against the US dollar in August and is now c. 3.0% stronger YTD against the greenback.
On the local economic data front, after remaining steady in the 5%–6% range for ten months, July headline inflation eased to 4.6% YoY from 5.1% in June, marking the lowest inflation rate in three years. This decline was driven by lower annual rates across several product groups, particularly in food and non-alcoholic beverages (NAB), transport, and housing and utilities. Core inflation (excluding food, fuel, and electricity) came in at a muted 4.3% YoY, below estimates of a 4.5% YoY print. June SA retail trade sales accelerated to 4.1% YoY, surpassing May’s upwardly revised 1.1% and exceeding consensus forecasts. MoM retail sales rebounded sharply, with a 1.6% increase following May’s 0.7% decline. Unfortunately, SA’s rising unemployment continued to cast a shadow over the country’s economic recovery. The latest Quarterly Labour Force Survey (QLFS) data released by Stats SA showed that SA’s official unemployment rate increased to 33.9% in 2Q24 from 32.9% in 1Q24. This is the third consecutive quarter that SA’s official unemployment rate has risen, taking it closer to the record high of above 35% reached in 2021 during the height of the COVID-19 pandemic.
Figure 1: August 2024 20 best-performing shares, MoM % change
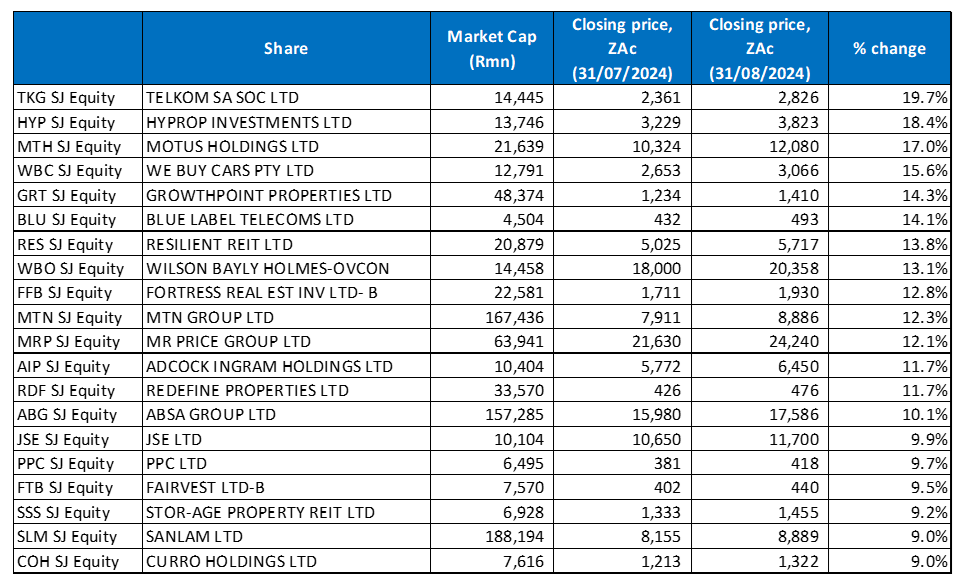
Source: Bloomberg, Anchor
Property stocks were the star performers in August, with financial and industrial domestically focused counters also recording a solid showing. Lower bond yields and surprise inflation numbers, which suggest that interest rates will likely be cut sooner and further than previously expected, helped boost sentiment in this segment of the market as property companies tend to be more sensitive than other sectors to interest rate expectations and bond yields. In addition, over recent weeks, a flurry of deal-making in the sector has bolstered a rebound in investor sentiment, bringing the SA Property Index’s YTD rally to 20.0%, with seven of the twenty top-performing shares in August coming from the property sector.
Still, Telkom SA, which has seen its share price come under pressure this year (for the year to the end of July, the share was down 20.6%), recorded a turnaround in its fortunes, soaring 19.7% MoM and taking the mantle of August’s best-performing share. The telco company released a 1Q25 trading update in early August, which showed that Group revenue rose by 3.9% YoY to R10.9bn, buoyed by growth in demand for its next-generation (NGN) offerings and ongoing demand momentum for data traffic and mobile with fixed traffic jumping 25.8% and 33.0% YoY. NGN revenue now accounts for 80.7% of total Group revenue. Its Openserve business recorded a 7.1% YoY increase in NGN revenue, with a Fibre-to-the-Home (FTTH) connectivity rate of 49%. Its BCX subsidiary’s IT segment contributed to a 2.4% YoY revenue increase, while Swiftnet’s revenue jumped 5.2% YoY with progress in its planned rollout of Power-as-a-Service (PaaS). Telkom also improved its debt profile through an R750.0mn bond issuance.
SA property Group, Hyprop, was in second place with an 18.4% MoM share price gain. Hyprop and Attacq, two of SA’s largest shopping mall owners, are selling their stakes (to the tune of c. R1bn) in malls across Nigeria and Ghana to focus on their investments in SA (Hyprop also has a portfolio in Eastern Europe). The deals involve the disposal of the companies’ holdings in Ikeja City Mall, Nigeria, and several prominent malls in Ghana. In notices to shareholders on 12 August, both companies said that the disposal of the portfolios relates to their strategic focus on SA, which includes a planned exit from sub-Saharan Africa. Combined, Hyprop and Attacq own some of the biggest shopping malls locally, including the country’s busiest mall, Mall of Africa, and regional staples such as Canal Walk and Rosebank Mall.
Motus, a leading provider of automotive mobility solutions and vehicle products and services, was third, with a 17.0% MoM share price gain. Motus has a local market presence and selected international offerings in the UK, Australia, Southeast Asia, and Southern and East Africa.
We Buy Cars (+15.6% MoM) came in fourth, followed by Growthpoint Properties (+14.3% MoM). The We Buy Cars share price is up 50.3% since its unbundling from Transaction Capital and JSE listing on 11 April 2024.
Blue Label Telecoms (+14.1% MoM), Cell C’s biggest shareholder, recorded a 14.5% share price jump on 21 August (its biggest one-day gain since May 2020) after it said in a trading update that it expected to report surging earnings for the full year to the end of May (FY24). It reported results on 29 August, which showed its revenue decreasing by 23.8% YoY to R14.18bn but diluted EPS soaring to ZAc72.03, compared with ZAc30.07 in the previous year. Blue Label still needs to claw back R2.2bn in losses from Cell C before it can start recognising contributions from the mobile operator in its financials. Blue Label CEO Brett Levy said it was taking on “short-term pain for long-term gain” when it came to Cell C (he expected most of this pain to be felt in 2024/2025). Cell C has been laden with long-term debt of R8.7bn, prompting Blue Label and Lesaka Technologies (formerly Net1), which previously held a 15% stake, to write down their combined R7.5bn investment in Cell C to zero.
Blue label was followed by Resilient REIT (+13.8% MoM), which invests in major retail centres with at least three anchor tenants and primarily leases to national retailers, Wilson Bayly Holmes-Ovcon (WBHO; +13.1% MoM) and Fortress Real Estate -B- (+12.8% MoM). Resilient released its 1H24 results last month, with the real estate investment trust (REIT) reporting higher total revenue of R1.78bn, compared to R1.66bn in 1H23, while its diluted EPS rose to ZAc408.48 from ZAc293.48 posted in the previous year. Resilient also recorded a 6.2% YoY increase in average rentals due to Eskom’s improving power supply. The company added that using solar energy and an R11.1mn reduction in diesel expenses significantly improved its net property income. Meanwhile, Fortress reported better-than-expected FY24 results last week, with revenue of R4.38bn vs the R3.79bn reported in FY23. Its diluted EPS rose 30.8% YoY to ZAc365.67. Fortress owns a c. 16% minority stake in NEPI Rockcastle.
Rounding out August’s ten best-performing shares was MTN Group (+12.3% MoM). MTN reported 1H24 results last month, with revenue coming in at R90.84bn, a 19.8% YoY decrease, and a diluted loss per share of ZAc409 vs EPS of ZAc225 reported in 1H23 due to other African currency devaluations, and the weak macro-economic environment. However, MTN said that its underlying performance remains strong, with growth seen when reporting on a constant currency basis. According to Group CEO Ralph Mupita, strong operational momentum was maintained, and the business’s resilience was reflected in its ecosystem’s growth, with data traffic and fintech volumes up by 35.7% and 18.0% YoY, respectively. MTN’s fintech platform continued to expand, driving good growth in advanced services. It said that strategic initiatives were initiated, particularly localisations and portfolio optimisation.
Figure 2: August 2024 20 worst-performing shares, MoM % change
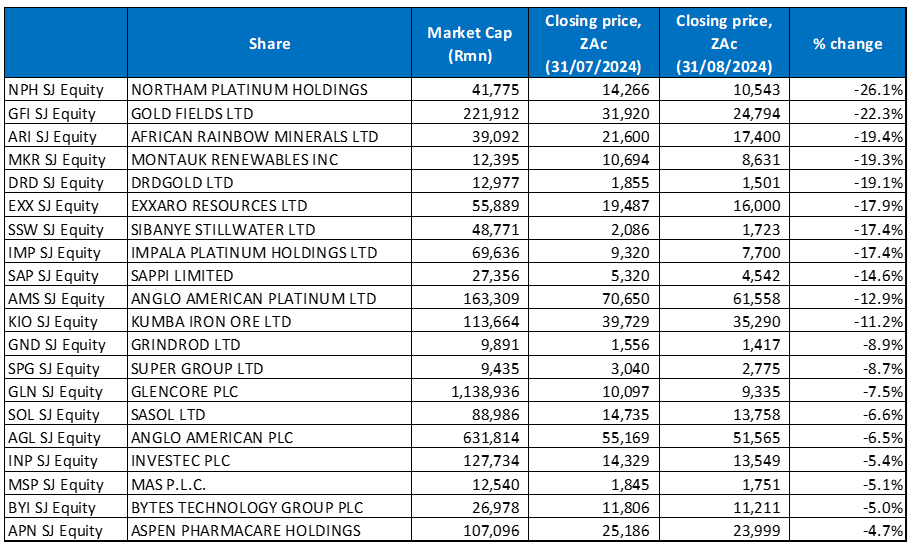
Source: Anchor, Bloomberg
Faced with a decline in commodity prices, mining/resources counters drove most of the JSE’s losses in August, with gold and especially PGM shares underperforming. Consequently, this market segment also accounted for most of August’s worst-performing stocks as the lower PGM basket price and volume challenges weighed on a slew of company earnings. In addition, as one company said, PGM miners also face challenging and sometimes competing stakeholder expectations from host communities, governments, organised labour, and investors.
Platinum miner Northam was August’s worst-performing share – down 26.1% MoM. In its FY24 results, released last week, the company said that revenue declined 22.2% YoY to R30.8bn, while its headline EPS fell by 81.6% YoY to R4.45, compared with R24.15 recorded in FY23. This was mainly due to lower prices despite higher sales volumes and increased revenue from its chrome sales. Northam said global geopolitical and macroeconomic issues could cause further disruption to the PGM markets and metal prices. Its CEO, Paul Dunne, noted that the local platinum mining industry has entered a phase of irreversible decline as producers struggle with low prices and demand suffers from the rise of battery-operated electric vehicles (EVs). Platinum is used primarily in autocatalysts, and the platinum price at one stage topped US$2,000/oz but is down more than 13% since the beginning of 2023 and ended August at US$929.79/oz. According to Johnson Matthey data, SA’s platinum output peaked at 5.3mn oz in 2006 and has been gradually declining since.
Gold Fields was August’s second worst-performing share, down 22.3% MoM. In its 1H24 results, Gold Fields reported a revenue drop to US$2.13bn vs US$2.27bn posted in 1H23, while its diluted EPS decreased 15.7% YoY to USc43.00. A big contributor to the gold miner missing out on the gold price (+21.3% YTD) boom was its South Deep mine. South Deep produced 1,110 kg less gold in 1H24 despite having one of the world’s largest gold reserves and one of the deepest. It produced 3,633 kg in the reporting period compared to 4,743 kg in the first six months of 2023, blaming the 25% YoY decline in output to backfill rehandling challenges and poor ground conditions. Gold production at Gold Fields’ Australian mine (St Ives) was also down in 1H24, plunging 25% YoY to 139,000 oz due to lower grades of ore mined and processed from the underground mines.
African Rainbow Minerals (ARM; -19.4% MoM) was the third worst-performing share. In its FY24 annual trading update (for the period ended 30 June 2024), the miner expects headline EPS to be between ZAc2,291 to ZAc2,749, lower than the ZAc4,582 recorded in FY23.
ARM was followed by renewable energy firm Montauk Renewables (Montauk), DRD Gold, and Exxaro Resources, with MoM declines of 19.3%, 19.1%, and 17.9%. In its 1H24 results, Montauk reported that its total operating revenues rose to US$82.13mn from US$72.41mn posted in 1H23, while its diluted EPS stood at US$0.01, compared with a loss per share of US$0.02 in the previous year.
DRD Gold, in its FY24 results, recorded revenue of R6.24bn vs R5.50bn posted in FY23 (+14% YoY), while its diluted EPS rose by 3.6% YoY to ZAc153.50. The increases were primarily driven by a 20% rise in the average gold price over the period. However, DRD was another gold miner that would have benefitted even more from the high gold price if it had attained its production targets for the period under review. Its gold production was down 5% for the year due to a 3% reduction in throughput, which led to a 2% lower average yield.
SA’s biggest coal miner, Exxaro’s earnings fell in 1H24 due to weaker export thermal coal prices, declining iron ore prices and lower volumes. Its headline HEPS slumped by 37% YoY to R15.82/share in the half-year period to June 2024. Although revenue inched up 1% YoY to R19bn and its cash from operations rose 24% YoY to R4.8bn, interim earnings before interest, tax, depreciation and amortisation plunged by 34% YoY to R5.1bn. The Group’s coal production and sales for the six months to June were down c. 13% and 12% YoY, respectively, due to lower demand from Eskom and logistical challenges. Total coal sales volumes fell 11.7% YoY to 18.9mn tonnes compared with the previous six months. Sales were down 5% YoY. These volumes were negatively impacted by lower offtake from the Medupi and Matimba power stations due to unit outages and equipment breakdowns. However, the company said a performance improvement was seen in the latter part of the reporting period.
Sibanye Stillwater (Sibanye) and Impala Platinum (Implats) were down 17.4% MoM, followed by Sappi Ltd, which declined by 14.6%. Sibanye will report a 100%-plus decline in basic earnings for the six months ended June (1H24) due to depressed metal prices, which have resulted in another heavy impairment charge, this time for its US palladium and platinum mine Stillwater. In its trading statement, the company said that it was examining further restructuring at Stillwater. Volume challenges also weighed on its earnings with basic EPS expected to come in at a loss per share of between ZAc250.8 and ZAc277.2 vs positive earnings of ZAc262 in the previous period. The earnings losses were positively offset by gains on derivative instruments and an 18% improvement in the average gold price. Still, Sibanye’s SA gold mining production was down by one-fifth to 265,179 oz YoY after its Kloof 4 shaft was closed, and seismicity interrupted output at Kloof and the neighbouring Driefontein mine.
Implats was another casualty of downbeat metal prices, resulting in the Group having to write down the value of its assets and reporting an annual loss of R17.3bn. FY24 revenue fell to R86.4bn from R106.6bn posted in FY23, while its diluted loss per share stood at ZAc1,924.00, compared with EPS of ZAc575.00 in the previous year. For the year to end June 2024 (FY24), Implats was negatively affected by significantly weaker US dollar sales revenues that offset the benefit of strong operational delivery. Implats also said that average palladium and rhodium prices had dropped sharply, negating higher sales volumes and compressing its operating margins and free cash flow.
Pulp and paper Group Sappi’s 3Q24 results (seasonally its weakest quarter) showed that its sales rose slightly to US$1.37bn from US$1.33bn posted in 3Q23, while its diluted EPS increased by 14.3% YoY to USc8.00.
Rounding out August’s ten worst-performing shares was Anglo American Platinum (Amplats), which fell 12.9% MoM as negative investor sentiment and a much lower platinum price YTD (-6.3%) contributed to the decline.
Figure 3: Top-20 best-performing shares, YTD
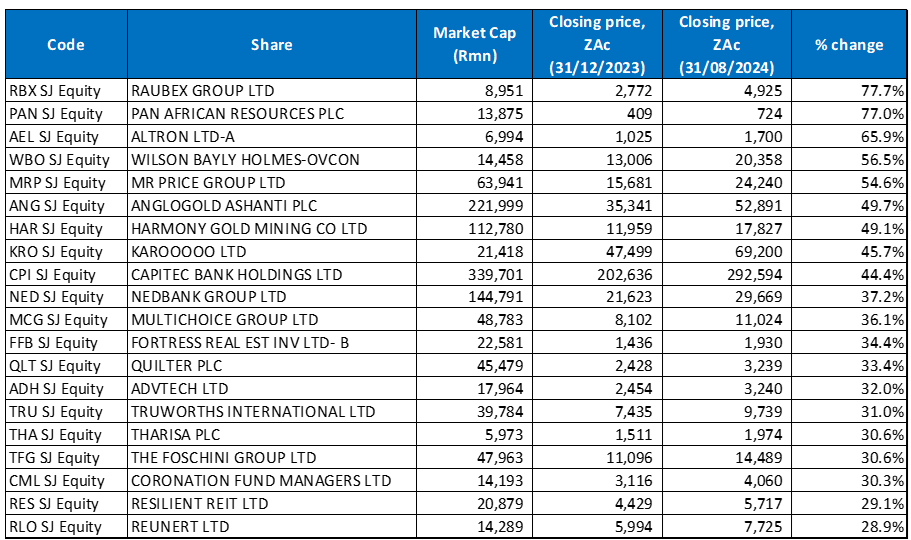
Source: Anchor, Bloomberg
The YTD best-performing shares featured fifteen of the year-to-end July’s best performers, with five shares entering the arena in August – Fortress, Foschini, Coronation, Resilient REIT, and Reunert.
After three consecutive months as 2024’s best-performing share, mid-tier gold producer Pan African Resources was pushed to second position as construction and engineering company Raubex moved to the top spot, having gained 77.7% YTD. This is only 0.7% above Pan African Resources’ 77.0% YTD rise. Tech company Altron retreated by 1.2% MoM in August, moving it to third position with a YTD gain of 65.9%,
Altron was followed by WBHO, Mr Price Group, AngloGold Ashanti, and Harmony Gold, with YTD share price increases of 56.5%, 54.6%, 49.7%, and 49.1%. Harmony has outperformed its gold mining peers on the JSE YTD as the price of the yellow metal continues to rally in anticipation of US interest rate cuts. Last month, Harmony said that its profit for the year ended June (FY24) was expected to surge by over 100% YoY as the gold miner takes full advantage of record gold price levels. Harmony, SA’s largest gold producer by volume, said that its headline EPS is projected to reach a minimum of ZAc1,852 – an over 100% YoY increase from the ZAc800 reported in the previous comparable period. Harmony CEO Peter Steenkamp said that Harmony “… delivered an exceptional combined performance across all our operations in FY24. This achievement was a result of clear strategic intent and successful execution, enabling us to deliver ahead of plan and capitalise on higher gold prices …”
Harmony was followed by Karooooo Ltd, Capitec Bank, and Nedbank, which rounded out the top-ten, best-performing shares YTD, with gains of 45.3%, 44.4%, and 37.2%. In August, Capitec said it planned to further disrupt the SA business banking landscape with new low-cost packaging for its point-of-sale card machine sales. The bank is targeting the growth of its business banking division, predominantly via the small and medium enterprises sector (SME).
Meanwhile, Nedbank reported strong 1H24 results in August, with its headline earnings growing by 8% YoY and its revenue increasing by 4% YoY to R35,159bn. Nedbank also said its net interest income advanced by 2.4% YoY to R20.78bn, while its diluted headline EPS rose by 12% YoY to ZAc1,650.0.
Figure 4: Bottom-20 worst-performing shares, YTD
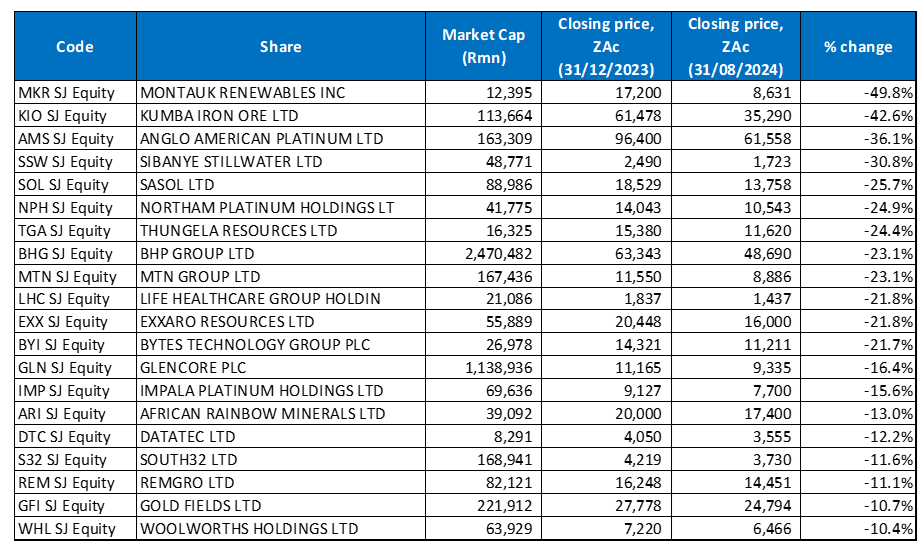
Source: Anchor, Bloomberg
There was some overlap between the year to end-July’s worst-performing shares and the worst-performers to the end of August (YTD), with fourteen shares remaining and six new entrants to the grouping – Northam, Life Healthcare, Exxaro, Impala, ARM, and Gold Fields. Following their poor performance in August, most of these shares came from the commodities space, especially gold and PGM miners.
Montauk (discussed earlier) remained the worst-performing share YTD, declining by 49.8%, with its share price retreating a further 19.3% MoM in August. Montauk was again followed by Kumba Iron Ore (-42.6% YTD), with Amplats bumping MTN (discussed earlier) from the third worst-performing share spot, with a 36.1% YTD drop in its share price.
Steel manufacturer Kumba has been under pressure for a while now as low iron ore prices (down 27.6% YTD) slow growth across the construction sector, while tariffs on goods from China have weighed on its recovery prospects. In addition, it has been facing operational constraints locally due to inefficiencies at Transnet and with the domestic steel market seen by market commentators as being small for Kumba, its focus on the export market will be a significant pressure point for the company given the supply and demand dynamics on global markets such as China, which has come under pressure this year.
Amplats was followed by Sibanye (discussed earlier), Sasol, Northam (discussed earlier), and Thungela Resources with YTD losses of 30.8%, 25.7%, 24.9%, and 24.4%. Sasol was down 6.6% MoM in August after releasing disappointing FY24 results. Sasol posted turnover of R275.11bn, lower than the R289.70bn reported in FY23. It also recorded a diluted loss per share of R69.94, compared to EPS of R13.02 reported in the prior year. The results were negatively impacted by challenging operating conditions, including depressed chemical prices and constrained margins, which were somewhat offset by a stronger rand/oil price, improved refining margins, and higher sales volumes.
Coal mining company Thungela Resources, in its 1H24 results (for the six months ended 30 June 2024), reported revenue of R16.75bn, up from R14.36bn posted in 1H23. Its headline EPS dropped by 58% YoY to ZAc952 as a poor rail performance and a reversal of the record coal prices of 2022 and early 2023 continued to weigh on the company’s financial performance. Thungela has slashed its interim dividend by 80% and will pay out R2/share, compared with R10/share in the previous comparative period.
BHP Group (discussed earlier), MTN (discussed earlier) and Life Healthcare Group rounded out the ten worst-performing shares with YTD declines of 23.1%, 23.1%, and 21.8%, respectively.