November’s US Presidential Election saw Donald Trump emerge victorious, with Republicans winning control of the Senate and the House of Representatives. Trump’s victory saw US equity markets rally as giddy investors seemed to view four more years of a Trump presidency and his promise of tax cuts and deregulation with rose-coloured glasses. The US dollar rallied for most of the month (likely due to expectations of higher inflation and interest rates under the new administration), weighing on commodity prices and the rand. Despite US equity markets’ impressive gains, world markets showed cautious optimism, navigating a complex environment of evolving global economic and geopolitical events that tested all asset classes. European equities had a lacklustre month for the most part, ending lower MoM, while China’s equity markets were mixed, and Japan closed in the red.
Nevertheless, US markets recorded considerable gains, buoying the three major indices to record highs in November. MoM, the Dow surged 7.5% (+19.2% YTD), while the S&P 500 ended 5.7% higher (+26.5% YTD) – both indices’ biggest monthly gains this year. The tech-heavy Nasdaq jumped 6.2% MoM (+28.0% YTD) – its best performance since May 2024.
In economic data, US October inflation printed higher, as expected. Headline inflation, as measured by the Consumer Price Index (CPI), was 2.6 % YoY vs September’s 2.4 % print. Core CPI, excluding the erratic food and energy components, remained at 3.3 % YoY. As expected, the core personal consumption expenditure (PCE) price index, excluding food and energy, a key Fed inflation gauge, edged higher in October, printing at 2.8% vs September’s 2.7%. MoM, core PCE was up 0.3%, matching September’s print.
European equity markets were in negative territory for most of November, ending slightly lower (Euro Stoxx 50 down 0.3%) as rising geopolitical tensions and the spectre of Trump tariffs weighed on sentiment. MoM, Germany’s DAX rose 2.9% (+17.2% YTD), while France’s CAC fell 1.6% (-4.1% YTD). October eurozone headline inflation came in at 2.0 % vs September’s 1.8% YoY. Core inflation remained sticky at 2.7% YoY – unchanged from September.
The UK market reversed October’s losses, with the blue-chip FTSE-100 up 2.2% MoM (+7.2% YTD). October UK inflation rose, printing at 2.3% (its highest rate in six months) vs September’s 1.7% on the back of a rise in energy bills. Core inflation was 3.3% YoY, up from September’s 3.2% print.
In Asia, China’s equity markets ended mixed as Trump’s election victory, which was likely to bring higher tariffs on Chinese exports, dampened investor enthusiasm. While looming tariffs might have contributed to market uncertainty, China’s equity markets rallied towards month-end as investors bet on more forceful stimulus measures being announced at a key economic conference scheduled for December. MoM, the Shanghai Composite rose 1.4% (+11.8% YTD), and the Hang Seng closed 4.4% down (+13.9% YTD). October inflation advanced at its slowest pace in four months – +0.3% YoY vs +0.4% in September. Core inflation rose 0.2% in October, accelerating from September’s 0.1% gain. November’s manufacturing PMI maintained a positive momentum, printing at 50.3 – higher than October’s 50.1. The official non-manufacturing PMI, tracking business sentiment in services and construction, declined to 50.0 vs 50.2 in the prior month (50 separates expansion from contraction).
Japan’s benchmark Nikkei ended November lower (-2.2% MoM) but is still up 14.2% YTD. Core inflation (including oil products but excluding fresh food prices) held above the Bank of Japan’s 2% target, keeping pressure on it to raise its still-low interest rates at its December meeting.
In commodities, the Brent crude oil price retreated by 0.3% MoM (-5.3% YTD), pressured by easing concern over supply risks from the Israel-Hezbollah conflict, the prospect of increased supply in 2025 and weak demand from China. After a four-month rally, a Trump-driven sell-off saw gold drop 3.7% MoM (+28.1% YTD). The announcement of a ceasefire agreement between Israel and Hezbollah and broader strength in the US Dollar Index following Trump’s election victory weighed on the yellow metal. Among platinum group metals (PGMs), platinum lost 4.5% MoM (-4.2% YTD), palladium plummeted 12.2% MoM (-10.6% YTD), and rhodium was down 2.1% MoM (+3.4% YTD). Iron ore retreated 0.3% MoM (-27.2% YTD), with price moves trending in a V-shape – high prices at the start and end of November and lower prices in the middle.
In South Africa (SA), the JSE was down for a second consecutive month. The FTSE JSE All Share Index lost 1.0% MoM (+9.9% YTD), while the Capped SWIX was down 0.9% MoM (+13.8% YTD). Mining counters retreated as commodity prices fell, especially PGMs and gold, pushing the Resi-10 down 6.7% MoM (-4.1% YTD). The SA Listed Property Index was the best performer (+1.1% MoM/+21.5% YTD), while industrials, as measured by the Indi-25, were unchanged MoM (+11.9% YTD), and the Fini-15 advanced by 0.2% MoM (+17.1% YTD). The rand weakened 2.6% MoM (+1.7% YTD) against the US dollar.
SA October headline inflation declined sharply to 2.8% YoY vs 3.8% in September, marking the lowest rate since June 2020 (during the COVID-19 pandemic), when the rate was 2.2%. Falling fuel prices remained a key driver behind the slowdown. Against this backdrop, as expected, the SA Reserve Bank’s (SARB) Monetary Policy Committee (MPC) lowered the repo rate further by a cautious 25 bps to 7.75% p.a. at its November meeting. Positively, the SARB’s improved GDP growth forecast, now reaching 2% in 2027, has provided increased credibility to the SA reform agenda.
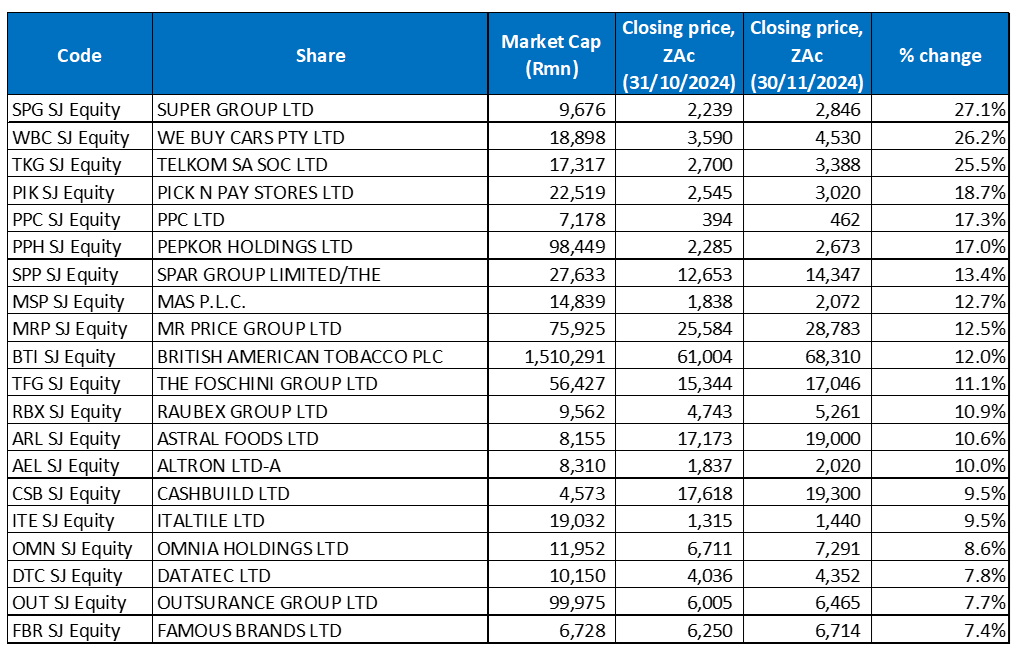
Figure 1: November 2024 20 best-performing shares, MoM % change

Source: Bloomberg, Anchor
SA Inc. (domestically focused) shares performed well in November, with retailers the outperformers on the back of two rate cuts, withdrawals using the two-pot retirement system, and optimism around the country’s economic future following May’s election results and the establishment of a Government of National Unity (GNU). On the day of its results release, retailer Mr Price also highlighted that there were signs that SA was finally entering an upward economic cycle.
Transport and logistics company Super Group (+27.1% MoM) was November’s best-performing share. The share price soared on 25 November after Super Group released a cautionary alerting shareholders that its Australian unit SG Fleet (of which it owns 53.58%) was in discussions with Pacific Equity Partners (PEP) for PEP to acquire all of SG Fleet’s shares at AUD3.50/share (an effective R22 per Super Group share), valuing it at c. R20bn. Super Group said PEP had been granted a period of exclusivity until 29 November to conduct due diligence and potentially put forward a binding offer.
In second place, WeBuyCars (+26.2% MoM), which listed on the JSE in April, said last week that it had sold over 40,000 cars in the three months ending September (the last three months of its financial year-end). The surge in vehicle sales resulted in WeBuyCars reporting a 16.5% YoY rise in FY24 revenue to R23.3bn. Core headline earnings rose to R815.4mn, or ZAc217.4/share, 9.9% higher YoY.
Telkom SA SOC Ltd (+25.5% MoM) was November’s third best-performing share. Its share price shot up after the company said in a trading statement that it expected adjusted headline EPS for the six months ended September to be 50%-60% higher YoY at ZAc292.5-ZAc312.0.
Telkom was followed by Pick n Pay Stores (+18.7% MoM), which completed its two-step recapitalisation plan last month (raising cash to lower Group debt and fix its loss-making core Pick n Pay supermarkets business). The first part of its plan was a rights offer, which was oversubscribed and raised R4.0bn in August. The second was Boxer’s JSE listing on 28 November (the IPO was multiple times oversubscribed at the top end of the price range). With a share price of c. R63, Boxer’s market cap is c. R28.8bn – above Pick n Pay’s R22bn (Pick n Pay will retain a 65.6% stake in Boxer). Pick n Pay’s reinforced balance sheet is expected to help the retailer recover after incurring losses and shedding market share in its supermarket business.
PPC Ltd, Pepkor Holdings, and Spar Group gained 17.3%, 17.0%, and 13.4% MoM, respectively. In its FY24 results, Pepkor reported a return to profitability driven by growth in its retail and financial technology segments. Profit for the year improved to R2.1bn after a R1.3bn loss in FY23, while Group revenue rose 7.8% YoY to R85.1bn. However, challenges remain, with Pepkor recording an R2.7bn impairment on goodwill, trade and brand names due to a continued uncertain trading environment (this impairment was lower than FY23’s R6.6bn). Headline EPS, on a normalised and comparable 52-week basis, rose 10.3% YoY to ZAc140.2. Spar also reported higher full-year earnings, making strides in its strategic priorities as its SA operations stabilised their market share. Group FY24 turnover from continuing operations advanced 4% YoY to R152.3bn, while HEPS rose to ZAc917.9 from ZAc826 in FY23.
MAS Plc (+12.7% MoM), Mr Price Group (+12.5% MoM), and British American Tobacco PLC (+12.0% MoM) rounded out November’s top-ten shares. Mr Price released its 1H24 results in November, showing a revenue increase to R17.6bn from R16.8bn in 1H23, while diluted EPS rose 6.7% YoY to ZAc467.70. In a statement, Mr Price’s CEO said that the “ … increasing sales momentum in the second quarter and the strong start in the second half with sales up 12.4% in the first 7 weeks is encouraging,”.
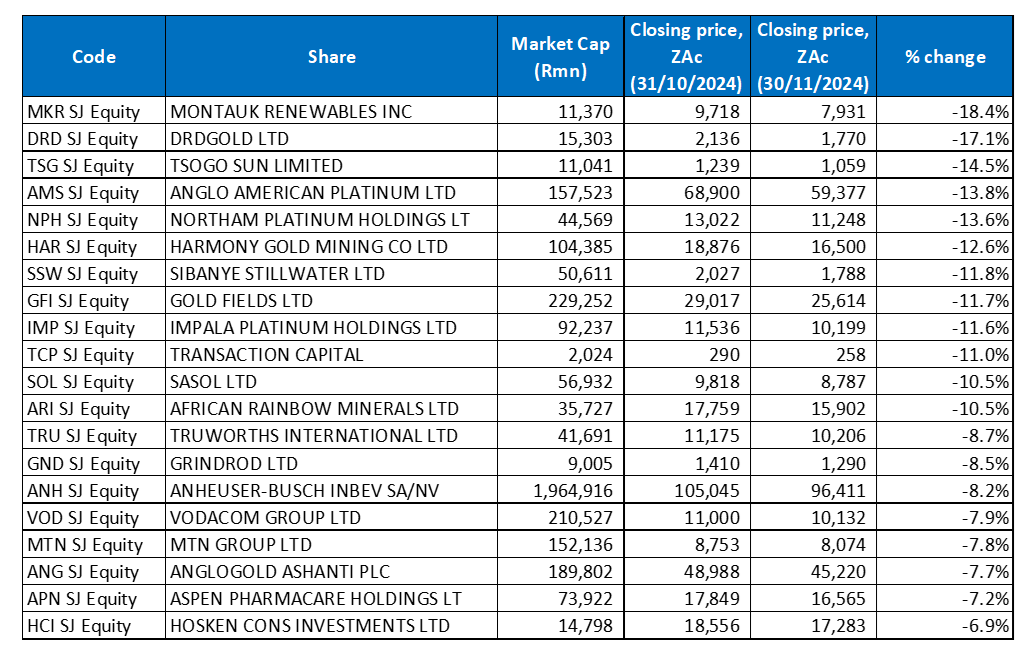
Figure 2: November 2024 20 worst-performing shares, MoM % change

Source: Bloomberg, Anchor
PGMs and gold counters, October’s shining stars on the back of a rally in commodity prices, returned most of those gains as various resources shares posted declines in November. As such, last month’s worst-performing shares list was littered with platinum and gold miners.
Energy firm Montauk Renewables, listed on the JSE and the NASDAQ, was November’s worst-performing share, declining by 18.4% MoM. Montauk reported 3Q24 results last month, where total revenue came in at US$65.9mn – up 18.4% YoY. The increase was primarily related to the rise in US renewable fuel credits or Renewable Identification Numbers (RINs), which the Group self-marketed from 2024 RNG production in 3Q24. Montauk was followed by DRDGold (-17.1% MoM) and Tsogo Sun (-14.5% MoM) – November’s second and third worst-performing share.
DRDGold, which was October’s best performer, gave back most of those gains (as did other gold counters, including Harmony [-12.6% MoM], Sibanye Stillwater [-11.8% MoM], and Goldfields [-11.7% MoM]) as the gold price retreated from its record highs to end November c. 4% down. The lower gold price was due to heavy losses incurred during a sell-off driven by Trump’s election victory. It buoyed the US dollar, fuelling expectations of big fiscal spending, higher tariffs, and tighter borders. This year, gold prices had soared (due to their safe-haven appeal) because of geopolitical tensions and the Fed’s rate cuts. However, the yellow metal now faces pressure as higher tariffs could stoke inflation, leading the Fed to adopt a more cautious approach to cutting rates further.
Platinum shares suffered as market volatility and cautious investor sentiment caused PGM prices to come under pressure in November, plummeting from their October highs. Among PGMs, palladium was down 12.2% MoM, while rhodium and platinum declined by 2.1% and 4.5%, respectively. Counters including Anglo American Platinum (Amplats), Northam Platinum, and Impala Platinum (Implats) tracked these commodity prices lower prices, declining by 13.8%, 13.6%, and 11.6% MoM, respectively.
Rounding out November’s ten worst-performing shares was Transaction Capital, which lost 11.0% MoM. In a disappointing FY24 trading update released last week, the company guided for a headline loss per share between -ZAc18.9 and a positive ZAc1.3.
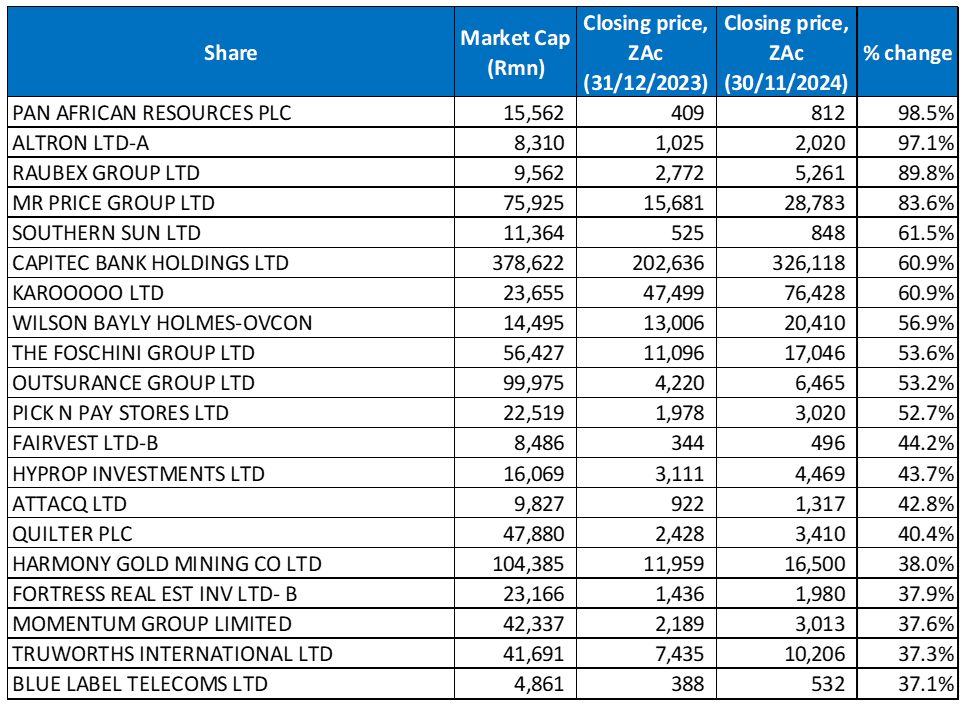
Figure 3: Top-20 best-performing shares, YTD

Source: Anchor, Bloomberg
The YTD best-performing shares featured fifteen of the year-to-end October’s best performers, with five new shares entering the top-20 in November. These include Pick n Pay Stores, Hyprop Investments, Quilter Plc, Fortress Real Estate -B-, and Momentum Group.
The top three shares were unchanged from the year to the end of October, with mid-tier gold producer Pan African Resources (+98.5% YTD) coming first, followed by technology Group Altron (+97.1% YTD) and construction and infrastructure development company Raubex (+89.8% YTD) in third spot.
The UK and JSE-listed gold miner Pan African Resources has had a bumper year, with its share price reaching new highs. Even with the lower gold price weighing on the share prices of gold counters in November, Pan African managed to advance by 0.6% MoM. In October, the miner completed its Mintails project, in which gold from dumps will be re-mined, adding a further c. 50,000 ounces p.a. to its 186,000 ounces p.a. FY24 output. Pan African also announced the US$54.2mn all-share acquisition of Australia’s Tennant Consolidated Mining Group in November. The privately owned Tennant controls the Nobles mine, once that country’s largest open-pit gold mine. Production from Nobles is expected to take Pan African’s production to c. 300,000 ounces p.a. by 2026.
Altron’s share price continued to rise in November (+10.0%) after it lifted HEPS of ongoing operations by over 100% YoY to ZAc79 for the six months to 31 August. Revenue printed at R5.1bn (-6% YoY), impacted by the sale of its ATM Business and a decrease in Altron Nexus’ revenue.
Meanwhile, Raubex (+10.9% MoM) reported stellar results in November, with HEPS for the six months to 31 August rising 49.8% YoY to ZAc284.3c, while revenue increased by 29.7% YoY to R10.95bn.
Raubex was followed by Mr Price, Southern Sun, Capitec Bank, and Karooooo Ltd with YTD gains of 83.6%, 61.5%, and 60.9% (both Capitec and Karooooo). Southern Sun’s 1H24 results showed that its income rose 6.3% YoY to R2.97bn while HEPS jumped 35% YoY. The hospitality Group said it had increased its overall September occupancy rate to 68.2% as demand from SA and international corporate and leisure travellers rose, buoyed by softening inflation, lower interest rates, and SA simplifying requirements for visitors from China and India.
Construction firm Wilson Bayly Holmes Ovcon (WBHO, +56.9%), The Foschini Group (+53.6%), and Outsurance (+53.2%) rounded out the top YTD performers. WBHO has benefitted from the government’s commitment to ramping up infrastructure spending with the GNU Minister of Public Works & infrastructure undertaking “to make SA a construction site.” Foschini’s 1H24 results show that its Group revenue dipped 1.4% YoY to R28bn, while HEPS dropped 5.6% YoY to ZAc371.6. However, the fashion retailer said that retail sales across its regions had improved in post-result trade as “… the cost-of-living pressure eases, and the two-pot pension reforms provided a much-needed liquidity injection to our market,”.
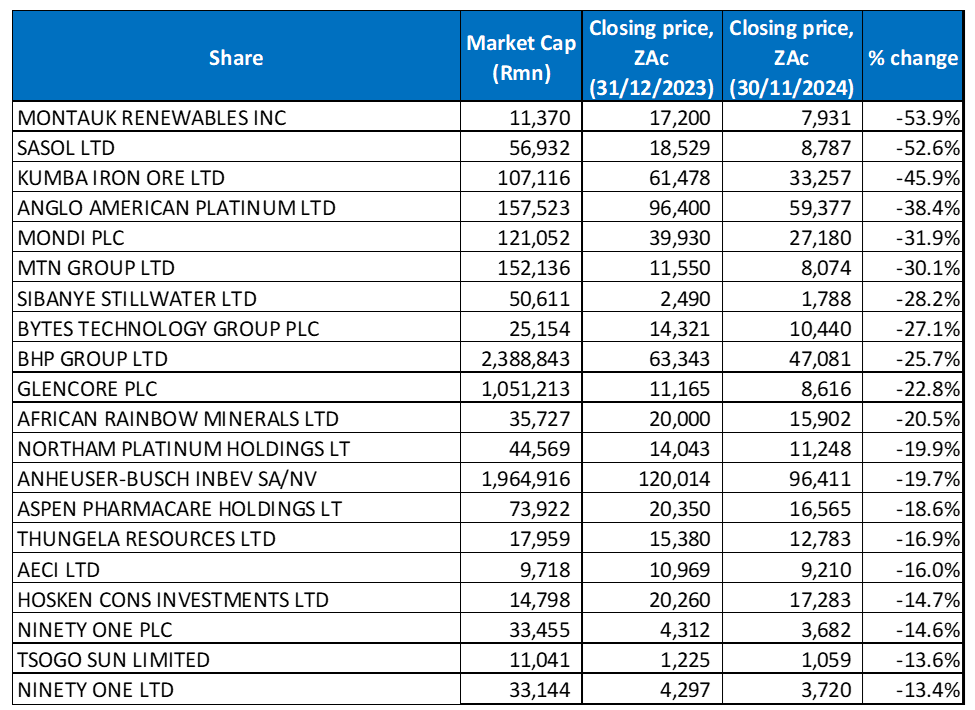
Figure 4: Bottom-20 worst-performing shares, YTD

Source: Anchor, Bloomberg
There was significant overlap between the year to end-October’s worst-performing shares and the worst-performers to the end of November (YTD), with seventeen shares unchanged and only three new entrants to the grouping – African Rainbow Minerals, Northam, and Tsogo Sun.
Montauk (-53.9% YTD; discussed earlier), also November’s worst-performer, returned to the worst-performing share YTD spot, bumping Sasol (-52.6% YTD) to second place. Sasol was again followed by steel manufacturer Kumba Iron Ore (-45.9% YTD).
Amplats, Mondi Plc, MTN Group, and Sibanye Stillwater (discussed earlier) followed with YTD losses of 38.4%, 31.9%, 30.1%, and 28.2%, respectively. MTN’s share price dropped 7.8% in November after the telecoms provider reported an 18.5% YoY decrease in its 3Q24 Group service revenue (voice revenue was down 15.3% YoY and data revenue 15.3% YoY). The results were negatively impacted by a devaluation of the Nigerian naira and operational challenges in Sudan.
Bytes Technology, BHP Group, and Glencore Plc rounded out the ten worst-performing shares with YTD declines of 27.1%, 25.7%, and 22.8%, respectively.


