Most major global markets (MSCI World -4.3% MoM; +11.6% YTD; -3.4% 3Q23) recorded declines for a second consecutive month in September. It was a tough ride for equity markets as optimism faded and worries about the global economic outlook and high interest rates resurfaced. At the same time, a bond sell-off saw longer-term Treasury yields soar, triggering renewed recession worries as the cost of borrowing increases. Additionally, oil prices are surging, and with oil being an input cost for many industries, this could result in companies and consumers cutting back on spending. On top of the abovementioned factors, a potential US government shutdown also weighed on markets. However, this has been temporarily averted as the Senate passed a last-minute spending bill on Saturday (30 September), allowing the government to stay open for 45 more days.
At its September meeting, the US Federal Reserve (Fed) held interest rates steady at 5.5%. This was only the second meeting since March 2022 where the Fed did not hike rates. In US economic data, August headline inflation, as measured by the Consumer Price Index (CPI), increased by 3.7% YoY after slowing to 3.2% YoY in July. August core CPI, excluding the erratic food and energy components, came in at 4.3% YoY vs 4.7% YoY in July. MoM headline inflation rose 0.6% vs July’s 0.2% increase. August US retail sales advanced 0.6% MoM – slightly faster than July’s revised 0.5% and better than market expectations. It also marked the fifth straight MoM gain. YoY, retail sales increased by 2.5%. August core personal consumption expenditure (PCE), excluding food and energy, the Fed’s preferred inflation gauge, rose 3.9% YoY and by 0.4% MoM (below consensus analysts’ expectations) vs a revised 4.3% YoY in July.
US markets posted losses for the month and for 3Q23, with the tech-heavy Nasdaq Composite Index reporting a 5.8% MoM decline (+26.3% YTD/-4.1% 3Q23) and the blue-chip S&P 500 falling by 4.9% MoM (+11.7% YTD/-3.6% 3Q23) – both indices’ worst month of 2023. The Dow Jones declined by 3.5% MoM and is down 2.6% for the quarter (+1.1% YTD).
In Europe, Germany’s DAX was down 3.5% MoM (+10.5% YTD/-4.7% 3Q23), while France’s CAC Index closed the month 2.5% in the red (+10.2% YTD/-3.6% 3Q23). In economic data, eurozone inflation came in at 5.2% in August, down from July’s 5.3% print, while core inflation (excluding food and fuel) eased to 5.3% vs 5.5% in July. Germany’s September inflation fell to its lowest level since Russia invaded Ukraine, at 4.3% YoY vs August’s 6.1%. The core inflation rate, excluding volatile items such as food and energy, declined to 4.6% YoY vs 5.5% in August. France’s September inflation was unchanged from August at 4.9% YoY. The European Central Bank (ECB) opted to raise rates for a tenth consecutive time last month – by 0.25% to 4.5%. The ECB said it believes that rates are now at a level that will make a “substantial contribution” to getting inflation back to 2%, noting that future decisions will be “data dependent.”
The UK’s blue-chip FTSE-100 (+2.3% MoM) was the only major index that ended September higher (+2.1% YTD/+1.0% 3Q23). At the Bank of England’s (BoE) meeting in September, the policy rate was unchanged at 5.25% – the first time since November 2021 that the BoE did not increase borrowing costs. This follows August UK inflation cooling further to 6.7% YoY (down from July’s 6.8% YoY print). Core inflation, excluding the volatile food and energy items, was 6.2% in August vs July’s 6.9%.
September saw overseas investors continue to sell Chinese equities (especially those of financial and personal consumption-related companies) as ongoing worries about China’s macroeconomic outlook and real estate problems weighed on sentiment. For a second consecutive quarter (3Q23), offshore investors sold more shares in companies in mainland China than they bought. MoM, Chinese equity markets recorded losses, with Hong Kong’s Hang Seng Index down 3.1% in September (-10.0% YTD/-5.9% 3Q23), while the Shanghai Composite Index retreated by 0.3% (+0.7% YTD/-2.9% 3Q23). There was some good news on the economic front as China’s official September Manufacturing Purchasing Managers Index (PMI) bounced back into expansion territory (for the first time since April), coming in at 50.2 vs August’s 49.7 print. The official non-manufacturing PMI, measuring business sentiment in the services and construction sectors, came in at 51.7 from 51 in August. The 50-point mark separates expansion from contraction.
Japan’s benchmark Nikkei declined 2.3% MoM (+22.1%YTD/-4.0% 3Q23). Core CPI (excluding the volatile fresh food category but including energy costs) remained at 3.1% YoY in August, unchanged from July’s print and above the Bank of Japan’s (BoJ) 2% target for a seventeenth straight month. The BoJ left rates unchanged (at -0.1%) at its September meeting, noting it was mindful of the “extremely high uncertainties” on the growth outlook domestically and globally.
In commodities, Brent crude oil recorded a fourth consecutive MoM gain, soaring by 9.7% MoM (+10.9% YTD/+27.2% 3Q23) on supply fears as two of the world’s largest oil producers, Russia and Saudi Arabia, have cut back on production and crude stocks at a key US storage hub fell to the lowest level in over a year. Iron ore prices rose 1.7% MoM and are up 3.3% YTD and 6.6% in 3Q23. Meanwhile, gold declined by 4.7% MoM (+1.3% YTD/-3.7% 3Q23). The platinum price fell by 6.6% MoM (-15.5% YTD/+0.2% 3Q23), while palladium ended the month 1.5% higher (-30.4% YTD/+1.4% 3Q23). Natural gas prices rose by 5.8% MoM (-34.5% YTD/+4.7% 2Q23), while thermal coal jumped by 9.8% MoM (-29.8% YTD/+22.6% 3Q23).
South Africa’s (SA’s) FTSE JSE All Share Index declined by 3.4% in September (-0.9% YTD/-4.8% 3Q23), while the FTSE JSE Capped SWIX was down 2.9% MoM (-0.2% YTD/-3.8% 3Q23). It was red across the board on the JSE in September, with the Indi-25 (-5.0% MoM/+8.9% YTD/-7.6% 3Q23) and the Fini-15 (-5.0% MoM/+3.9% YTD/+0.5% 3Q23) recording the biggest monthly losses. The SA Listed Property Index was down 4.3% for the month (-8.9% YTD/-1.6% 3Q23), while the Resi-10 lost 0.1% MoM (-18.7% YTD/-7.2% 3Q23). Highlighting the monthly performances of the biggest shares by market cap on the JSE, the largest company on the exchange, BHP Group, fell by 1.0% MoM, while the second-biggest share, Anheuser-Busch InBev, was down 3.2% MoM. Prosus, the third-biggest listed company, dropped 7.3% MoM, Naspers lost 6.0% MoM, and Richemont fell 13.2% MoM. However, Glencore jumped 7.6% MoM, with Anglo American Plc up 3.6% MoM. The rand retreated by 0.2% against the greenback in September (-11.1% YTD/-0.4% 3Q23),
In economic data, SA’s August headline CPI rose for the first time in five months to 4.8% YoY, vs 4.7% YoY in July. Over the last few months, the deceleration in headline inflation has primarily been driven by strong base effects on fuel inflation, which have now dissipated from the August data. In addition, some of August’s fuel price increases were primarily responsible for this renewed increase in inflation (Brent crude soared over 27% in 3Q23 amid supply cuts from major producers). Unfortunately, this offset further easing in food and non-alcoholic beverages (NAB) inflation, softening from 9.9% YoY in July to 8.0% YoY in August. Except for fruit, all food and NAB categories recorded lower annual rates in August, which assisted in taking some of the heat off the headline rate. However, it was not enough to counteract the rise in fuel prices and increases in municipal tariffs. Core inflation (excluding the volatile food and energy categories) came in at 4.8% YoY in August. Seasonally adjusted July retail sales (released in September) were unchanged from June’s 1.8% YoY decline. At its September meeting, the SA Reserve Bank (SARB) kept the repo rate on hold at 8.25%, with the prime rate remaining at 11.75%, although it cautioned that it might tighten rates further if supported by data developments.
Figure 1: September 2023 20 best-performing shares, MoM % change
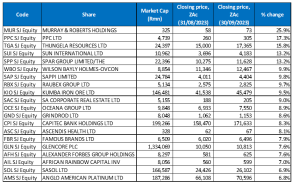 Source: Bloomberg, Anchor
Construction and engineering Group Murray & Roberts’ (M&R) share price rebounded in September (+25.9% MoM), claiming back some of its August losses (-34.1% MoM) and emerging as last month’s best-performing share, albeit from an extremely low base. M&R was August’s worst-performing share after flagging an FY23 earnings plunge of more than 100%, saying that it expected to swing into a basic headline loss per share of as much as ZAc76, hit by the loss of its Australian subsidiaries Clough and RUC Cementation Mining Contractors, which it has restated as discontinued operations. This saw its share price plunge 12% on 28 August. Its FY23 results were released on 30 August, showing that revenue from continuing operations advanced 42.3% YoY to R12.46bn, while it reported a diluted continuing headline loss per share of ZAc71 from a loss of ZAc47 in FY22.
In an operational update for the five months ended 31 August 2023, cement company PPC Limited (+17.3% MoM and in second place) revealed that revenue for PPC’s SA and Botswana group, which excludes Zimbabwe and Rwanda (CIMERWA), rose by 5.0% YoY, driven by an increase in the average selling prices despite weaker cement sales volumes. Group cement sales volumes increased 3.0% YoY due to exceptionally strong growth in Zimbabwe. However, cement sales volumes in SA and Botswana decreased by 6% YoY. The operational update saw PPC’s share price rising 3.2% on the day to a three-month high. YTD, PPC’s share price is up 39.9%. Thungela Resources came in third with a 15.8% MoM gain in its share price for September, likely buoyed by stronger coal prices. YTD, the share price is still down 39.4% after its stellar 234% gain in 2022.
Sun International and Spar Group followed Thungela – both up 13.2% MoM. Investors cheered Sun International’s strong 1H23 results, which included a 11.7% YoY rise in income to R5.8bn, despite the company incurring R60mn in net diesel costs to mitigate the impact of loadshedding. In addition, Sun International hiked its dividend by 68.2% YoY to ZAc148/share. The company’s adjusted core profit, or earnings before interest, tax, depreciation and amortisation (EBITDA), from resorts and hotels (Sun City, Wild Coast Sun, The Table Bay Hotel and the Maslow Sandton) soared by 64% YoY to R314mn, off revenue of R1.4bn (+27% YoY). Adjusted headline EPS increased by 10.1% YoY to ZAc197 for the period under review. Meanwhile, there was a relief rally in grocery retailer Spar after the company said last month that it would sell its loss-making Polish business. In a trading update from 1 October 2022 to 25 August 2023, Spar noted that it has achieved total sales growth of 5.9% with mixed performances from its various business units. Sales from its wholesale grocery business increased by 8.1% YoY, while it also reported a 10.6% YoY rise in turnover for the first 47 weeks of FY23.
Spar was followed by construction and materials company Wilson Bayly Holmes-Ovcon (WBHO), Sappi Ltd, and Raubex with MoM gains of 9.9%, 9.8% and 9.7%, respectively. WBHO returned to profitability in its year to end-June (FY23), thanks to an uptick in construction, roadworks and civil engineering activity in SA and the rest of Africa. It reported a 141% YoY rise in headline EPS to R15.14 from a loss of R36.93 in FY22, while its FY23 revenue rose to R23.8bn from R17.2bn posted in the previous year.
Diversified miner Kumba Iron Ore and SA Corporate Real Estate Ltd rounded out the top-10 performers for September with MoM share price gains of 9.5% and 9.0%, respectively. SA Corporate Real Estate owns a diversified property portfolio in SA and Zambia and reported a 13% YoY rise in interim revenue last month. Its gross income for the six months to June rose to R1.1bn from R972.5m in the previous corresponding period, but operating profit fell to R567.6mn from R631.9mn. Like-for-like net property income increased by 2.5% to R561.9mn. Distributable income reached R318.2mn or ZAc12.65/share and it declared a ZAc11.39 dividend (equivalent to a 90% payout ratio).
Figure 2: September 2023 20 worst-performing shares, MoM % change
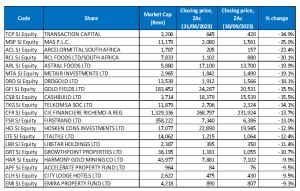
Source: Bloomberg, Anchor
Transaction Capital (-34.9% MoM) was September’s worst-performing share. In a trading and pre-close operational update for the year ending 30 September 2023, the beleaguered business revealed that the ongoing macroeconomic challenges affecting SA’s minibus taxi industry, which started at the onset of the COVID-19 pandemic in March 2020, has prompted an aggressive restructuring of SA Taxi to right-size the business. This restructuring process, it said, continues to impact its full-year core EPS, HEPS and basic EPS. However, it added that it had made progress regarding restructuring SA Taxi’s operations and balance sheet, resulting in a more stable business. It noted that WeBuyCars’ earnings are expected to be c. 20% lower YoY. Separately, Transaction Capital announced that Jonathan Jawno, co-founder and executive director, will, in addition to his role as Chairman of SA Taxi, assume the role of Group CEO, and long-serving CEO David Hurwitz will step down from his position. Hurwitz sought to allay fears that his departure was not amicable. Nevertheless, despite assurances and management changes, the company’s share price slumped more than 20% on the day (12 September). Transaction Capital was followed by MAS Plc (-25.0% MoM) in second place, with steel producer Arcelor Mittal (Amsa; -23.4% MoM) in third spot.
In its FY23 results, released in September, RCL Foods Limited (-20.1% MoM) said that its revenue rose by 17.3% YoY to R37.8bn, while increased costs saw its headline EPS drop c. 46% YoY to ZAc60.6. Like other local food producers, RCL is facing increased costs that cannot be fully passed onto consumers through higher prices. RCL said that loadshedding cost R158.3mn in diesel during the period under review. Its Selati sugar business increased revenue by 23.3% YoY to R11bn on a much higher sugar export price, helping offset the one-off sugar industry special levy of R234.4mn. Its Rainbow Chicken business continued to disappoint, with underlying FY23 EBITDA dropping 74.9% YoY to R86mn. However, according to RCL, agricultural costs, including maize (maize prices used in animal feed have soared since Russia invaded Ukraine in February 2022), were the largest contributor to its costs. RCL said that it has also struggled with declining municipal infrastructure, which affects water and power supply and leads to damaged roads.
Another food company and SA’s largest chicken producer, Astral, followed RCL with a MoM share price decline of 19.9%. In its FY23 trading statement, Astral revealed that it expected its EPS and HEPS to decrease by as much as 165% YoY, compared with ZAc2,781 and ZAc2,762, respectively, recorded in FY22. This will be the company’s first-ever annual loss since listing on the JSE in 2001, after spending R1.9bn on loadshedding-related costs, including feeding birds it could not slaughter on time and suffered through SA’s worst-ever avian flu outbreak.
Metair Investments, DRDGold and Gold Fields followed, with MoM declines of 19.1%, 18.1% and 15.5%. Energy and automotive parts company Metair reported 1H23 results last month, indicating that its revenue rose 31% YoY to R7.64bn (its automotive parts segment generated the bulk [64%] of revenue), while diluted EPS advanced by 14.6% YoY to ZAc47. No interim dividend was declared. A lower gold price weighed on the gold miners, while Gold Fields cut its gold production guidance for 2023 and 2024 last month after announcing a two-month delay in production at its Salares Norte project in Chile because of challenges in securing certain parts.
Rounding out September’s worst-performing shares were Cashbuild and Telkom SA, with MoM declines of 15.5% and 14.1%. In its results released at the end of August, Cashbuild reported a 4% YoY revenue decline (mainly due to opening new stores). Still, the pressure was felt further down the income statement at the operating profit and headline EPS levels, which fell by 73% and 37% YoY, respectively. Operating margins were cut from 7.9% to a paltry 2.2%, the lowest margin it has reported in the past five years. In addition, due to a challenging trading environment, the dividend was cut by more than 42% YoY. Cashbuild recently told News24 that it was experiencing the worst trading conditions in twenty years, with its middle-to-lower-income consumers continuing to abandon home renovation and building projects halfway through due to financial strain.
Figure 3: Top-20 best-performing shares, YTD
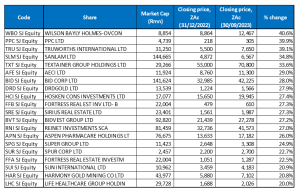
Source: Anchor, Bloomberg
Eighteen out of August’s top-20 YTD best-performing shares were again among the top-20 best performers for the year to the end of September. Following sterling performances in September, PPC Ltd and Sun International were the new entrants, bumping Gold Fields and Old Mutual from the list.
After three months in the top spot, a knockout performance from WBHO (+40.6% YTD; discussed earlier) in September and a share price drop from gold miner DRDGold (+27.9% YTD) bumped it from the number-one spot. Meanwhile, PPC’s 17.3% MoM gain in September (discussed earlier) resulted in the cement producer re-entering the top 20 performers with a YTD gain of 39.9%. PPC was followed by retailer Truworths (+39.1% YTD), which saw its share price gain 5.6% in September.
Sanlam (+34.8% YTD) remained in fourth place despite its share price declining by 3.6% in September. Last month, the insurer, in its 1H23 results, reported that revenue from insurance operations advanced to R4.1bn. At the same time, it recorded a 118% YoY jump in headline EPS to ZAc339 vs ZAc156 in 1H22, as it benefited from lower death claims. Sanlam has been expanding abroad and into other sectors to ensure its resilience as SA’s economy continues to sputter along, and currently, only around half of its business is in SA. Sanlam also announced last month that it had completed its R35bn African tie-up with the international financial services giant German-based Allianz.
Textainer, diversified chemicals Group AECI, and food services company Bid Corp followed Sanlam, with YTD gains of 33.6%, 29.0% and 28.0%. Last month, AECI said it had signed a five-year contract to supply explosives and provide services to Newcrest Mining’s Lihir gold mining operation in Papua New Guinea. AECI has been reviewing its operations to design a new growth strategy that it will unveil in November, and the company has also been tackling lowering its R5.7bn debt pile.
Rounding out the top-10 YTD performers were DRDGold, Hosken Consolidated Investments (HCI) and Fortress Real Estate Investment -B- shares, with YTD gains of 27.9%, 27.4% and 27.3%, respectively.
Figure 4: Bottom-20 worst-performing shares, YTD
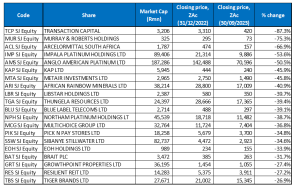
Source: Anchor, Bloomberg
Among the YTD worst-performing shares, eighteen of the twenty shares for the year to the end of August also featured among the twenty worst-performers for the year to the end of September. Growthpoint Properties (-27.4% YTD) and Tiger Brands (-26.9% YTD) were new entrants, which bumped Equites Property Fund and Lewis Group from the bottom 20.
Investment holding company Transaction Capital was again the worst-performing share YTD, with a 87.3% drop after the share price fell a further 34.9% in September (discussed earlier). Once again, Transaction Capital was followed by M&R (-75.3% YTD) in the second spot, despite M&R recording a 25.9% gain in September and taking the top spot last month in terms of share price performance (discussed earlier). Amsa (-66.9% YTD) remained in the third spot.
Amsa was followed by Implats, Amplats, industrial conglomerate KAP Ltd and Metair Investments, which recorded YTD share price declines of 53.6%, 50.5%, 45.9% and 45.8%, respectively. Platinum counters have been in a rout this year as platinum group metals (PGM) prices plummeted (YTD, platinum, palladium, and rhodium prices are down 15.5%, 30.4% and 66.5%, respectively), and China’s economic growth has remained sluggish resulting in lower demand from the world’s second-largest economy.
Finally, diversified miner African Rainbow Minerals (ARM; -40.9%), Libstar Holding (-39.7%) and Thungela (-39.4%) rounded out the ten worst-performers YTD. ARM’s share price was down 5.0% in September after the Group released disappointing results, which showed a decline in profit due to weaker commodity prices, while rail capacity constraints at Transnet hampered iron ore, manganese ore and thermal coal volumes. ARM reported a 21% YoY decline in FY23 profit, while its headline EPS came in at R48.51 compared with R57.87 in FY22. It declared a R12/share final dividend vs FY22’s R20/share.