Stats SA produces two quarterly surveys detailing South African (SA) employment. They are:
- The Quarterly Employment Survey, which examines VAT-registered businesses and includes detailed industry level data on non-agricultural, formal employment; and the
- Quarterly Labour Force Survey, which surveys households and includes details on informal employment, agricultural employment, and demographics of the workforce.
Since these surveys are both samples, they are estimates rather than being exact numbers and there are some inconsistencies between the two surveys. However, we have attempted to combine these reports in a way which gives a picture of employment dynamics, with the aim of identifying those areas of employment which are potentially at risk from the COVID-19 induced lockdown.
Executive summary:
At the end of 2019, SA had 38.7mn people of working age (15–64) which can be broken down broadly into:
- Economically inactive: 12.7mn (these are predominantly students and homemakers).
- Unemployed or discouraged work-seekers: 9.6mn.
- Employed: 16.4mn, which is further broken down into:
- Formal employment: 11.3mn.
- Informal employment: 2.9mn.
- Employment in private homes (predominantly domestic workers): 1.3mn.
- Agricultural employment: 0.9mn.
Amongst those employed, we identified the categories below that seemed to us to be most at risk of losing employment as a result of the COVID-19 crisis and the lockdown:
- Informally employed: 2.9mn, including those working in:
- Wholesale, retail, motor trade, hotels and restaurants: 1.2mn.
- Construction: 0.3mn.
- Community, social and permanent services: 0.4mn.
- Those employed in private homes (predominantly domestic workers): 1.3mn.
- Formally employed: 4.3mn, including those working in:
- Wholesale/retail/motor trade: 2mn.
- Construction: 0.9mn.
- Hotels and restaurants: 0.3mn.
- Real estate activities: 0.2mn.
These categories combined represent around 50% of the current SA labour force. Although within those categories there are many resilient sources of employment, including those involved in “essential retail”.
The good news is that there are some industries with chunky employment that should be reasonably safe through this lockdown (representing about 25% of employment). These industries include:
- Government employees – 2.1mn.
- Banks, insurers, accountants and lawyers – 0.8mn.
- Food and beverage manufacturing – 0.3mn.
- Mining industry – 0.5mn.
If we break down SA’s 38.7mn people of working age (15–64) into the three broad categories highlighted above, Figure 1 shows how these percentages will look by segment.
Figure 1: Working age population
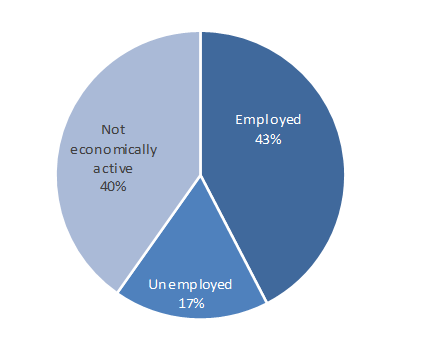
Source: Stats SA, Anchor
We have reclassified 2.9mn people into the “unemployed” category, which Stats SA (in line with global best practice) has included in “not economically active” (and therefore not part of the unemployment numbers). These are people that have become discouraged and are no longer actively seeking employment. That leaves our adjusted numbers with 9.6mn people classified as unemployed, of which more than 80% have either been out of work for more than a year or are discouraged and no longer seeking employment.
Figure 2: Unemployed
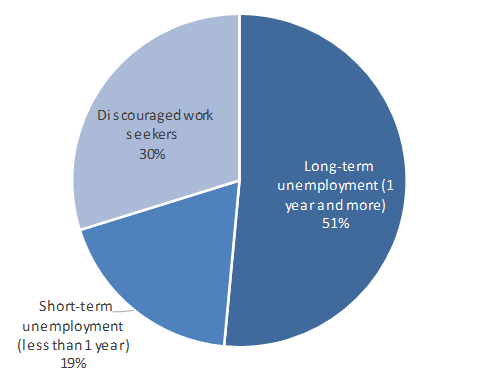
Source: Stats SA, Anchor
Those 12.4mn economically inactive working-age South Africans can be further broken down into the following sub-categories:
Figure 3: Economically inactive
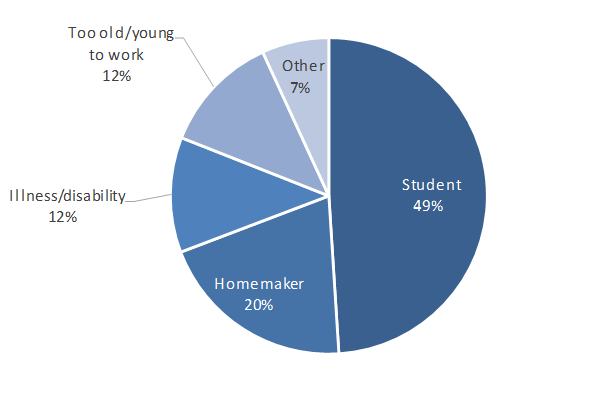
Source: Stats SA, Anchor
SA has approximately 16.4mn people who have some form of employment, broadly broken down into the categories as shown in Figure 4.
Figure 4: Employed South Africans
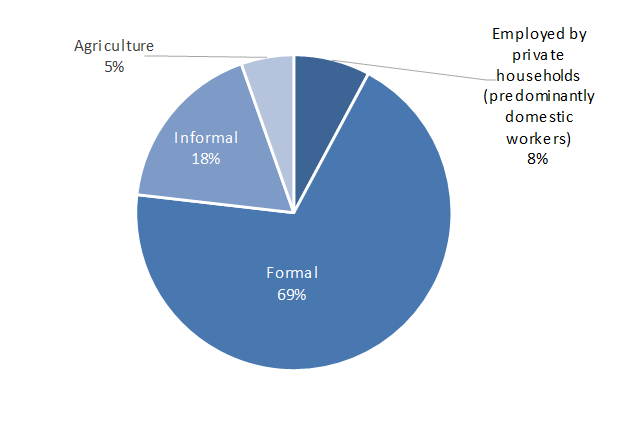
Source: Stats SA, Anchor
The labour force can be further dissected into industry classifications as shown in Figure 5 below.
Figure 5: Employment by industry, in thousands
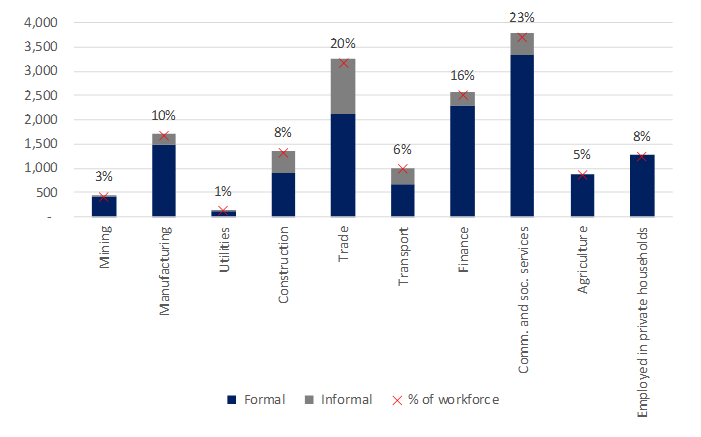
Source: Stats SA, Anchor
The table in Figure 6 further breaks down the labour force into industry and sub-industry levels, split between formal and informal employment. We use a traffic light system to identify those industries where employees might be at risk of losing employment as a result of the COVID-19 crisis and related lockdown. The percentages in the table below represent the portion of our labour force in each of the categories. Those in orange text are categories which may be at risk, but since some of these categories are extremely broad (e.g. retail) they might also include sub-sectors that are not at risk (e.g. those employed at pharmacies or grocery stores). The only category that we have highlighted in red is “hotels and restaurants”, which represent about 2.2% of the total labour force and seems fairly obviously at risk.
Figure 6: Labour force by industry and sub-industry, split between formal and informal employment
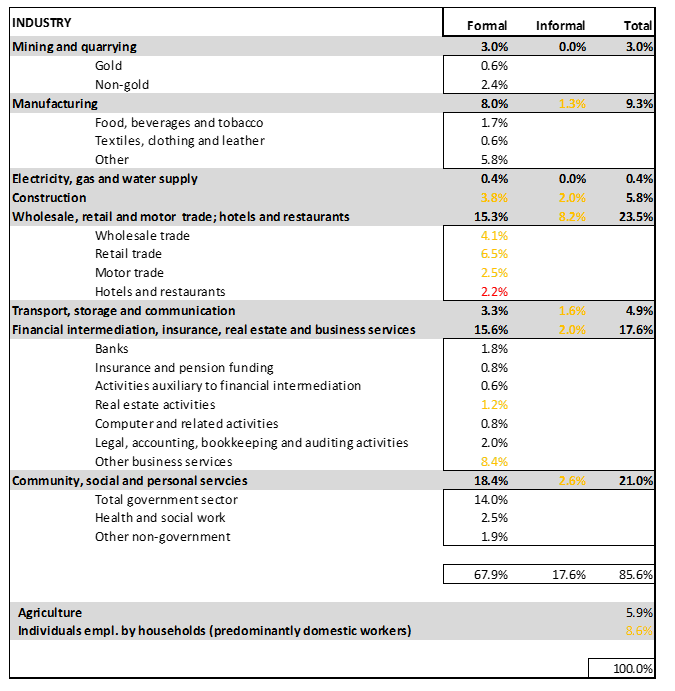
Source: Stats SA, Anchor
SA has about 16.9mn households according the most recent Stats SA survey (2016), which means that even in a best-case scenario (making the unlikely assumption that each household has only one income earner), we’d fall marginally short of having an income for each household. The reality is likely something significantly worse, in which case social benefits would pay an increasingly significant role. As of March 2019, the government was paying 18mn social grants totalling about R14mn/month.
Figure 7: SASSA grants – March 2019
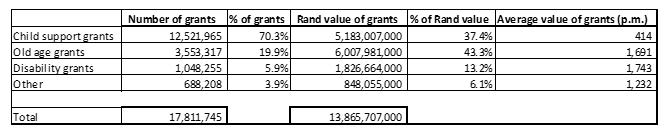
Source: SASSA, Anchor
These grants were apparently paid to 11mn beneficiaries. In practice, about 70% of these grants were child subsidies (c. R400/month) representing around 37% of the monthly grant budget, 20% were old age grants (c. R1,700month) representing 43% of the grant budget and the majority of the rest was paid in disability grants to about 1mn people (c. R1,700/month). We note that, while it is great to know that government is doing a good job of caring for the most vulnerable in society, it still leaves a huge income gap for many adults should informal employment and employment in vulnerable industries come under pressure because of the pandemic and the resultant lockdown.