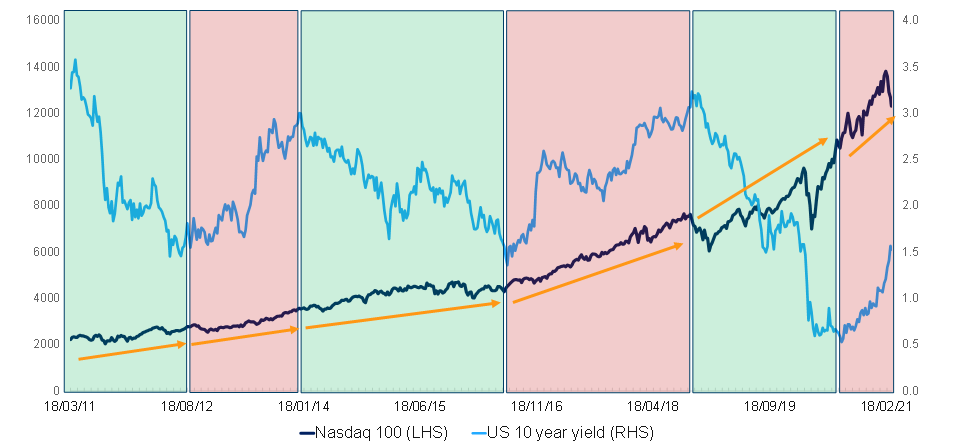
The major market narrative at present is that rising interest rates are bad for stocks – growth stocks in particular. The reality is that stocks can go up (and down) with both rising and falling interest rates. In Figure 1, we highlight the Nasdaq (dark blue line, intended to represent tech and growth stocks) and the US 10-year yield (light blue), while the shaded green and red areas are periods of falling and rising interest rates, respectively. Interestingly, you will notice that, over the past decade, the Nasdaq rose irrespective of the direction of interest rates.
Figure 1: The Nasdaq vs US 10-year yields, March 2011 to date
Source: Anchor, Bloomberg
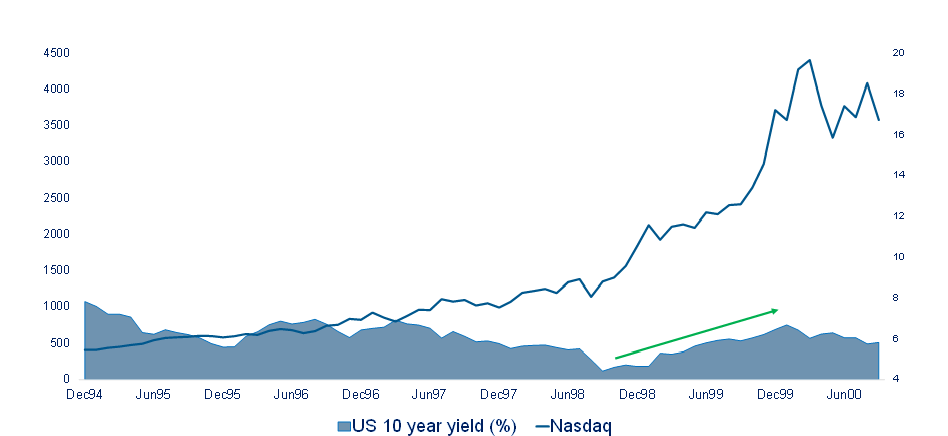
In terms of the argument relating to the absolute level of interest rates, we highlight that the tech bubble took place with the US 10-year yield at around 6%. And the steepest part of the ascent came as yields rose from 4% to 6%. In theory, rising interest rates should put a dampener on valuations, however, in practice, liquidity and animal spirits trump theory.
Figure 2: Will rising rates kill the bull?
Source: Anchor, Bloomberg
That said, the speed (and volatility) of the YTD ascent in yields is important, as it probably would have triggered massively leveraged bondholders to partially unwind their positions, with knock-on effects for other asset classes. The narrative element is also important – to the extent that market participants believe the rates vs stocks and value vs growth narratives, they become a self-fulfilling prophecy, at least temporarily.
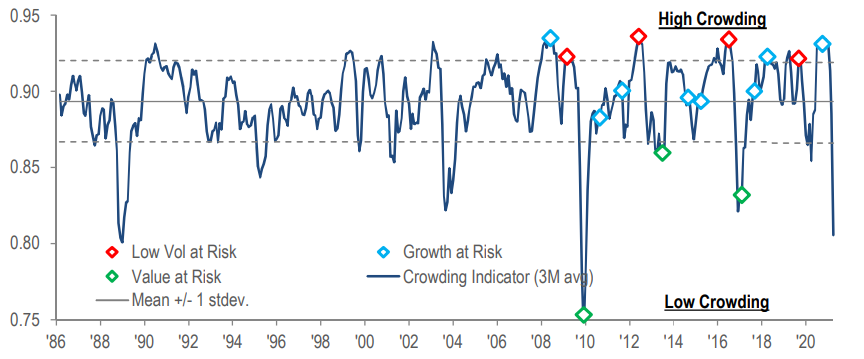
So, where do we stand in terms of the growth vs value trade? Factor timing is, almost by definition, impossible. But to the extent that growth (as a factor) was crowded, that extreme in positioning has pretty much unwound – see the blue diamond on the far right of the chart in Figure 3 below. The unwind has been extreme vs history.
Figure 3: JP Morgan momentum crowding indicator – no more signalling risk to momentum
Source: JP Morgan Chase
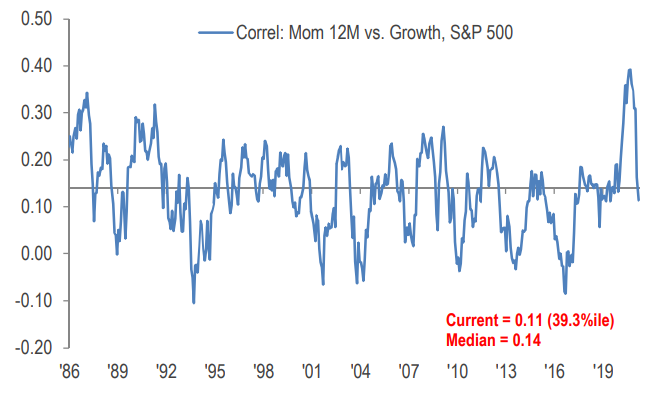
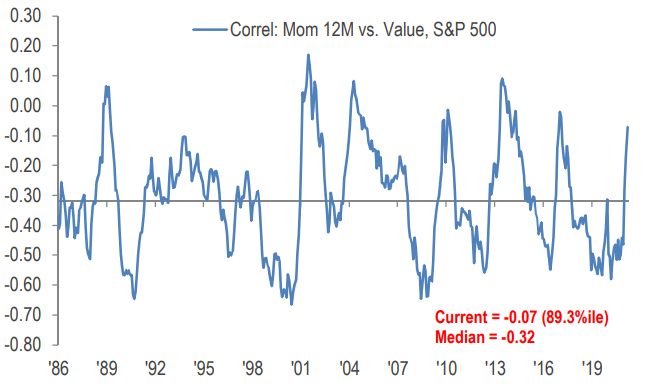
Growth was also highly correlated with momentum (the latter just picks the strongest performers), but that has unwound (see Figure 4). Now, value is more highly correlated with momentum vs its own history – this ratio has some room before it reaches prior peaks and, potentially, rolls over.
Figure 4: Momentum growth correlation – reversed below the median
Source: JP Morgan Chase
Figure 5: Momentum value correlation on a steady rise
Source: JP Morgan Chase
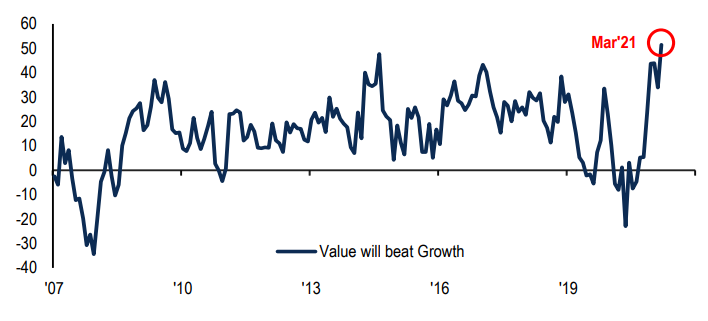
Not surprisingly, market participants expect value stocks to do well:
Figure 6: A record net percentage of asset allocators think value will outperform growth
Source: BofA Global Fund Manager Survey
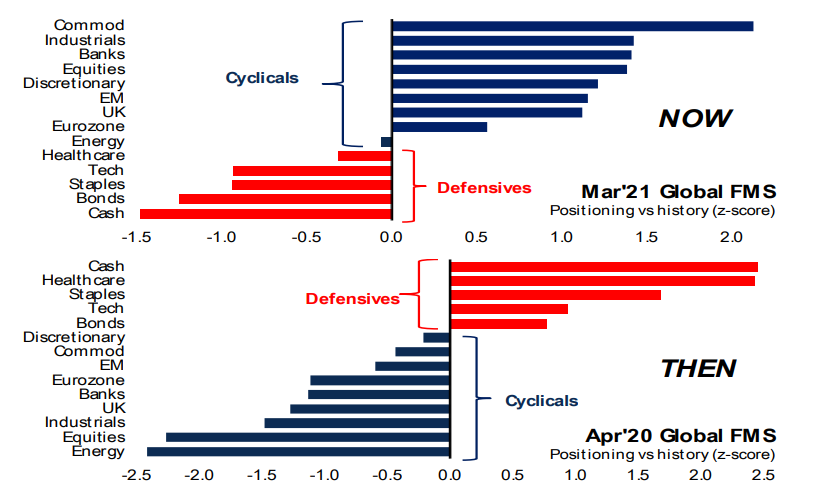
Value frequently correlates with cyclicality, which is clearly how investors are currently positioned:
Figure 7: Bank of America (BofA) Global Fund Manager Survey (FMS) shows cyclical consensus is “cyclical” vs “defensive” a year ago –BofA FMS positioning vs historic z-scores
Source: BofA Global Fund Manager Survey
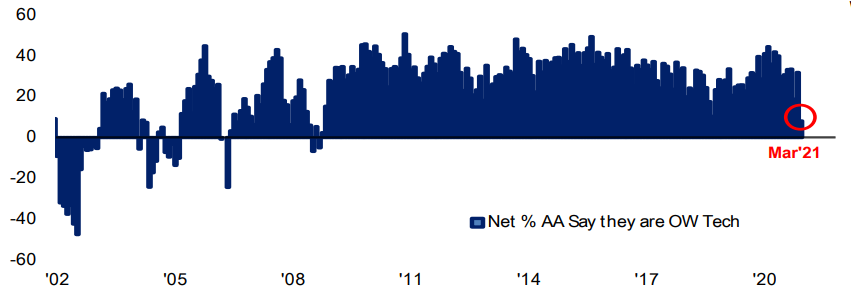
On the flipside, investors have cut their tech exposure to levels last seen more than a decade ago.
Figure 8: FMS tech overweight has been cut to its lowest level since January 2009, net % of asset allocators say they are overweight tech
Source: BofA Global Fund Manager Survey
Putting all of the above together, we suspect (no guarantees!) that the worst of the growth sell-off is over. We do not think tech and growth stocks need the 10-year yield to fall, these counters only need it to stop rising at such a rapid pace. As US hedge fund manager David Tepper pointed out recently, the Bank of Japan is not moving its yield targets, which make US treasuries increasingly attractive to Japanese investors. European Central Bank President Christine Lagarde has also re-emphasised her commitment to maintaining a supportive monetary policy regime, further reinforcing the ceiling on the US 10-year.
We believe that the initial yield shock factor is gone, at least for the short to medium term. While not necessarily at a tipping point just yet, positioning risk has shifted from growth to value. This is not to imply that any factor must behave in any particular way prospectively, but markets have a habit of upending consensus narratives and positioning.


