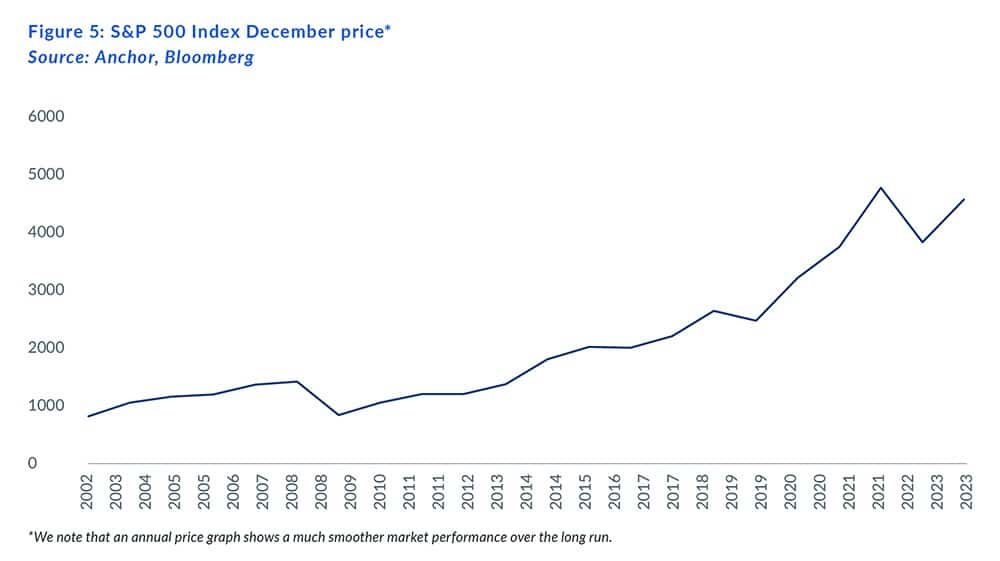
The US stock market has produced an incredible investment return over the past twenty years, far greater than any other stock market. Over the short term, anything can impact prices, but over the long term, an investor’s total return consists of two factors: the change in the index level (i.e., share prices) and the yield you earn each year in the form of dividends. The price of the S&P 500 Index has grown 311% over the past 20 years, or c. 7.4% p.a., and it has paid an after-tax dividend of about 1.67% p.a. over the period or roughly a 34% payout over 20 years. Thus, your total return over 20 years was approximately 345%.
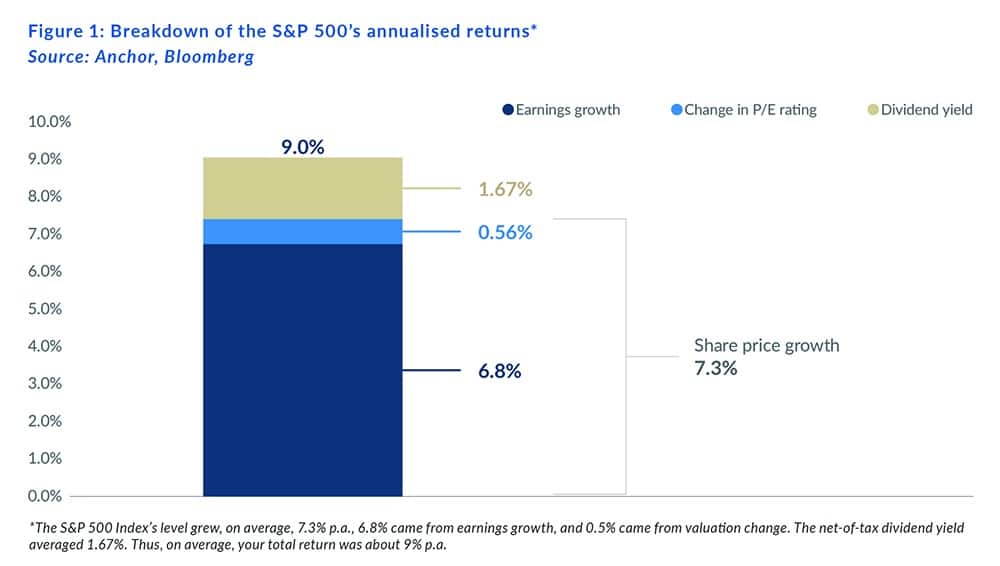
We can see from Figure 1 above that the largest contributing factor to the price of the index over the long term was the performance of the underlying earnings growth of the companies that constitute the index. Over the 20 years, EPS has grown 286% or 6.8% p.a., which is well ahead of US inflation over the same period. This performance has by no means come in a straight line, with multiple periods of boom and bust, but this clearly shows how impressive businesses tend to grow in the long run.
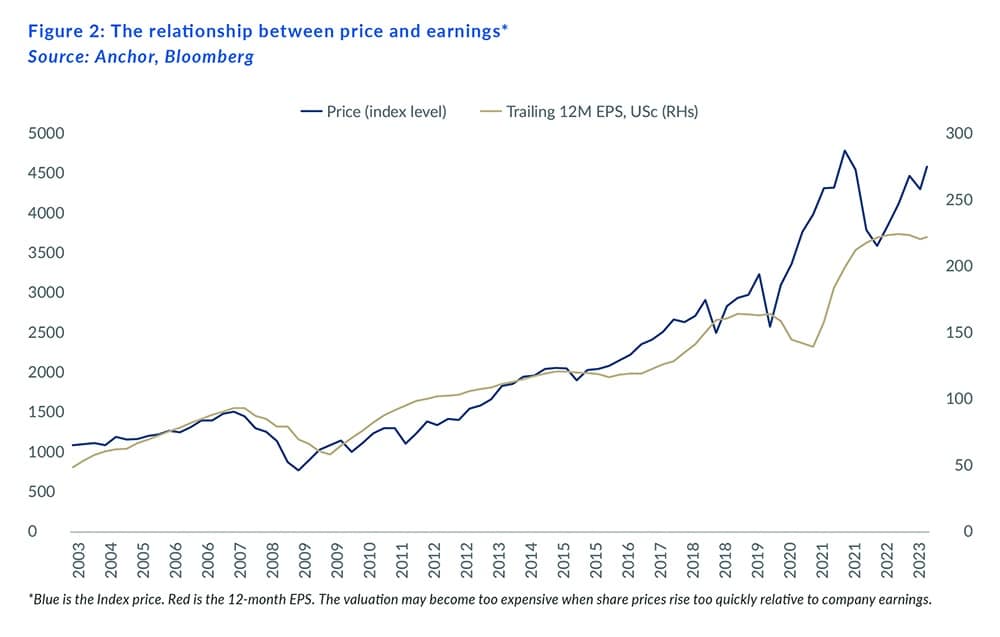
Comparing the EPS of the index with the index price, we can see how well correlated they are over time. The market price is a forward-looking mechanism; thus, we often see the price reacting to events that could impact company performance in the future. If the price rises too aggressively relative to the underlying earnings growth, this would increase the valuation. Conversely, if the price falls too far, this will indicate a possible buying opportunity.
The second component of price is the valuation rating at that time. The simplest metric used is usually the price-to-earnings ratio (P/E). If you buy a company at a 10x P/E and sell it tomorrow at a 12x P/E, then your total return would be 20%, and it would be entirely attributed to the rating change and not earnings growth or dividends earned. From the start date 20 years ago till now, the historic P/E has hardly changed at all and thus has had an insignificant impact on the price of the index over this period.
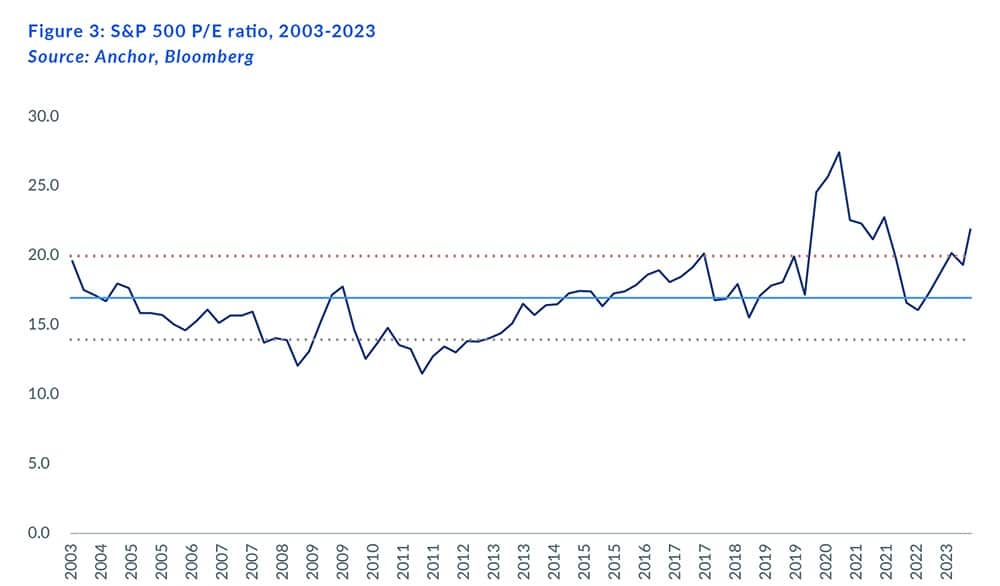
The historic P/E of the S&P 500 has ranged from about 11x to 27x over the past 20 years, with an average rating of 13.7x over the period. An interesting exercise would be to examine what the valuation contribution could have been if we had invested in September 2011 at the S&P 500’s cheapest valuation of 11.2x and held to 21.9x today, increasing 95% or 5.6% p.a. In this scenario, we have almost perfectly timed the buying of the market, and our annualised total return from this point would have been 13.8% p.a. Interestingly, it still would not have contributed more to your total performance than earnings growth, which has grown at an annualised rate of 6.1% since September 2011.
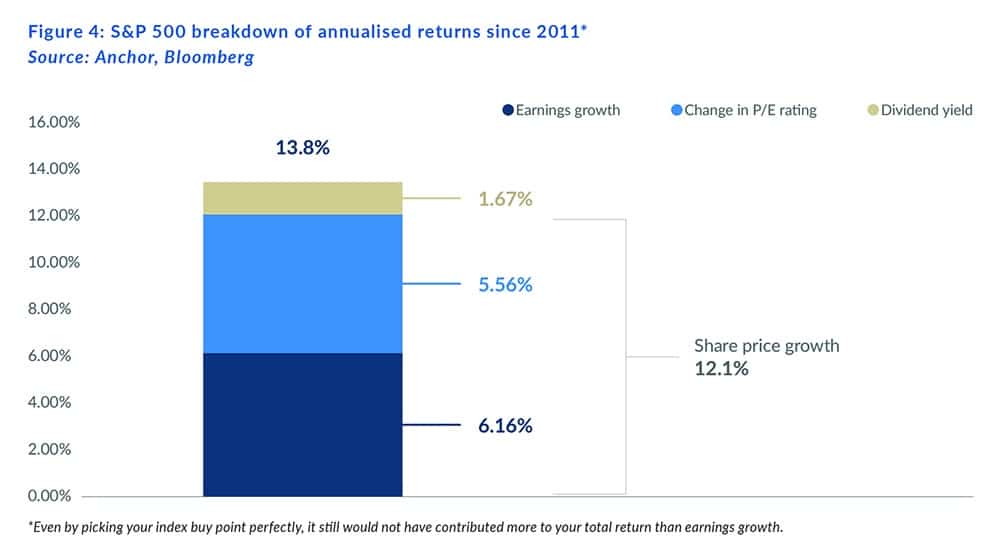
Conversely, if you overpay on the valuation, you may experience a negative return over the short term. Still, you should be confident that future earnings growth will float you back to profitability.
Another interesting exercise is to calculate the total performance over 20 years, where you reinvest it into the market each year instead of spending your earned dividends. On average, the after-tax dividend has been approximately 1.6% p.a. Although this does not sound like much on its own, if we reinvested this cash flow into additional units of the index, we would boost our total return from 345% to 458%.
This proves the age-old adage that “it is not about timing the market, but about time in the market.” Even though markets are very volatile in the short term, they show relatively smooth returns over the long term. If you had the fortitude to only look at your portfolio once per year at the end of December, you would likely have been oblivious to the worst dips that occurred during the year, and your state of mind would be far more at ease.
