Data released by S&P last week suggest that US single-family house prices are up c. 15% YoY in April, continuing a five-month streak of house price increases of more than 10% YoY, which is not a function of prices rebounding from depressed levels due to the pandemic. In fact, the S&P data indicate that aggregate US house prices did not have a single negative month because of the pandemic.
In this note, we discuss:
- Whether we are heading for another housing bubble; and
- how spiking house prices might impact US inflation.
1. Are we headed for another US housing bubble?
The recent rally in US house prices has put them at c. 20% above the peak levels they achieved in the lead up to the 2008 global financial crisis (GFC) for houses in the 10 largest metro areas of the US and 35% above their pre-GFC peak for single-family homes nationally.
Figure 1: US single-family home prices are 35% above their pre-GFC peaks
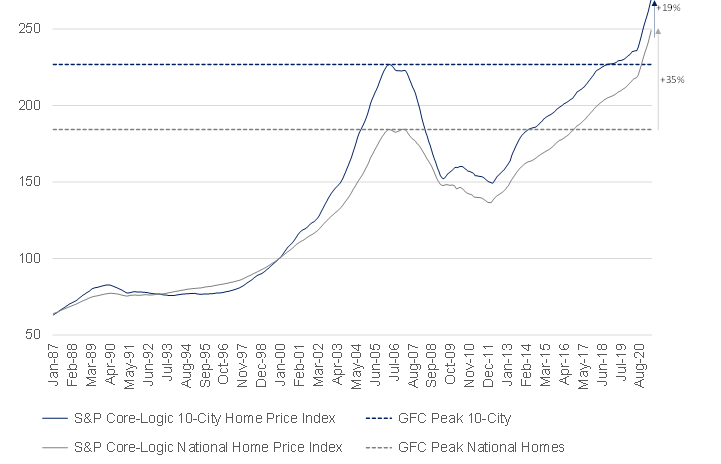
Source: Anchor, Bloomberg
However, once we strip out the impact of inflation, house prices are looking more reasonable relative to pre-GFC peaks, with houses in the US’ 10 largest metros still c. 11% below their pre-GFC peaks and the broader national average at levels roughly similar to the pre-GFC peak.
Figure 2: After adjusting for inflation, house prices look much more reasonable relative to past peaks
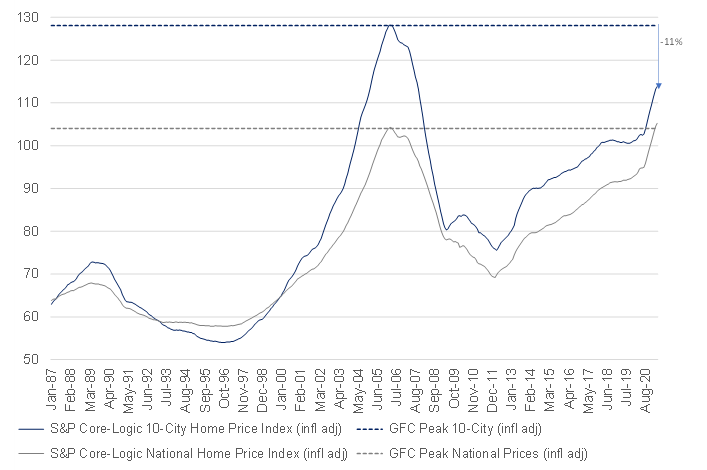
Source: Anchor, Bloomberg
The primary reason that we think that house prices are not yet in bubble territory is the level of affordability. The US National Association of Realtors (NAR) publishes a benchmark of house price affordability based on:
- House prices.
- Incomes.
- Mortgage rates.
It suggests that, even after the recent house price rally, houses are c. 25% more affordable than pre-GFC. This is largely a function of the funding rates, which have come down dramatically over the past two decades.
Figure 3: National average rates for US 30-year, fixed-rate mortgages have more than halved over the past two decades, making homes considerably more affordable at current price levels
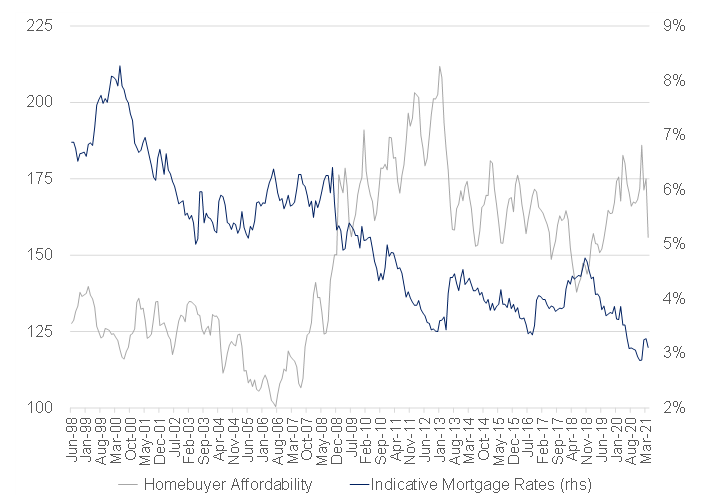
Sources: Anchor, Bloomberg
It is also encouraging that, relative to the GFC, US consumers are not nearly as leveraged as they were going into the GFC, particularly as it relates to mortgage and home equity debt. This is despite debt being considerably more affordable on a relative basis.
Figure 4: The excessive mortgage and home equity debt that helped fuel the previous US housing bubble is conspicuously absent in the current environment
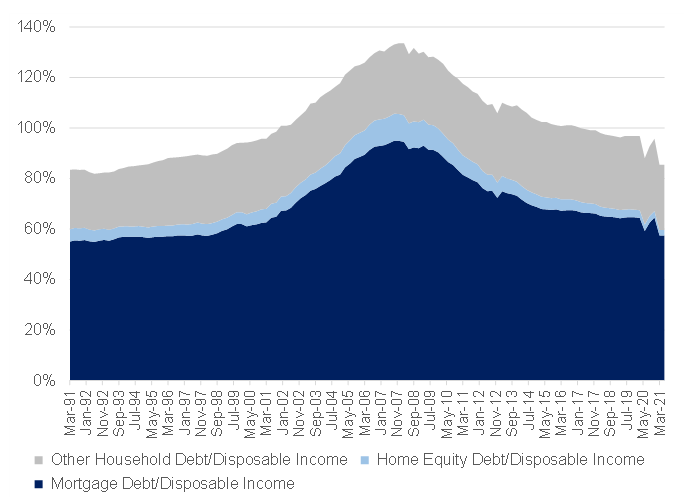
Source: Anchor, Bloomberg
So, we are fairly sanguine that current house price levels are still reasonable, based on the level of house price affordability. We are also more comfortable about the housing sector’s ability to withstand a shock, given the relatively constrained levels of housing debt and manageable consumer balance sheets.
2. How will spiking house prices impact US inflation?
We first assess how likely it is that the recent rally in home prices is sustainable.
We think that the relatively constrained levels of indebtedness, combined with home ownership rates well below the GFC peak, provide a still decent runway of demand that should continue to sustain house price growth, perhaps not at the same pace as the past few months, but certainly at elevated levels.
Figure 5: Home ownership levels are still well below their previous peak and should provide a decent runway of ongoing housing demand
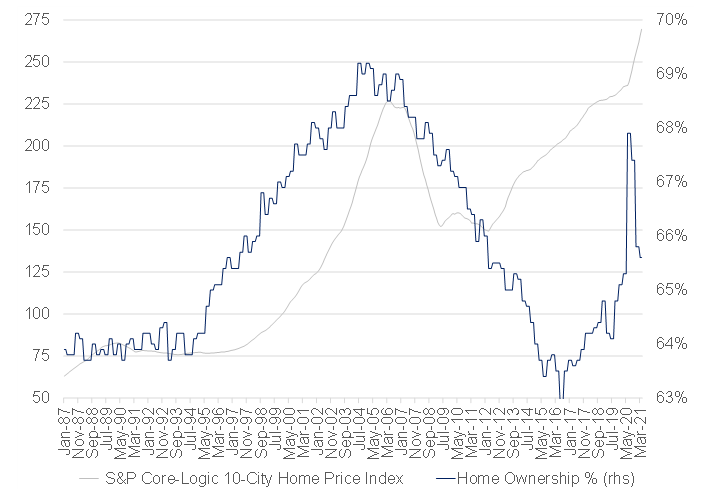
Source: Anchor, Bloomberg
We also note with interest how the pandemic seems to have broadened the base of homes benefitting from the latest price appreciation. In the decade leading up to the pre-GFC house price peak, house price appreciation in the 10 largest US metros happened 50% faster than the national average, while the recovery in house prices since the post-GFC trough has been much less disparate, with home prices nationally keeping pace with those in the major metros. While this trend seemed to be in place even before the pandemic, it is interesting to see how the pandemic and work-from-home (WFM) trends have helped stimulate housing demand outside the most densely populated urban centres.
Figure 6: Trends in YoY house price appreciation suggest that most of the relocated demand is showing up in areas with more space
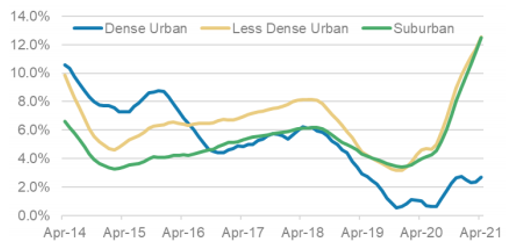
Source: Zillow, Morgan Stanley Research
In addition, we highlight that housing supply collapsed in the wake of the GFC and has been slow to recover in this cycle. More recently, we have seen the impact of this in spiking lumber prices. Single-family homes in the US are predominantly built from lumber and, in the wake of the GFC, many lumber mills were forced to close due to a lack of demand as new home construction activity collapsed. As supply has started to respond we have seen the shortage of lumber mills present a bottleneck to new US home supply.
Figure 7: New private homes complete in the US (thousand) – the decade leading up to the GFC saw 16.7mn new homes completed, while the past decade has seen only 10.1mn new homes completed
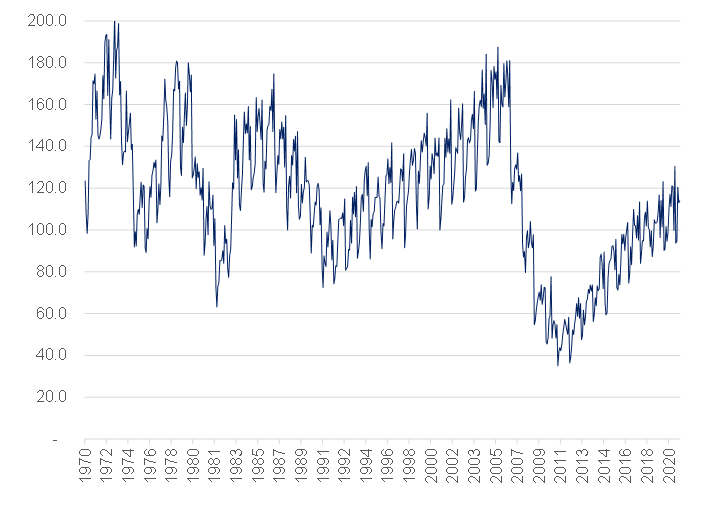
Source: Anchor, Bloomberg
The concern that investors might have with the recent (and seemingly sustainable) rally in US home prices is how this might feed through to inflation and contribute to the US Federal Reserve (Fed) needing to respond with tighter monetary policy.
Here we note that house prices do not directly impact the calculation of inflation. The two home-price related components (shelter inflation) that do form part of the US inflation basket are:
- Rental prices for primary homes.
- Owners equivalent rent, which is a survey-based measure that asks a sample of homeowners what they think it would cost them to occupy their home if they did not own it.
These components account for a significant portion of the US inflation basket – c. 40% of core US inflation and though it is roughly half of that level in the Fed’s preferred inflation basket (c. 20%) it is still by far the biggest component of that basket. As such, it is important to pay close attention to the trends in shelter inflation.
Figure 8: The cost of shelter constitutes c. 40% of the US core CPI basket and c. 20% of the Fed’s preferred inflation gauge basket – core PCE
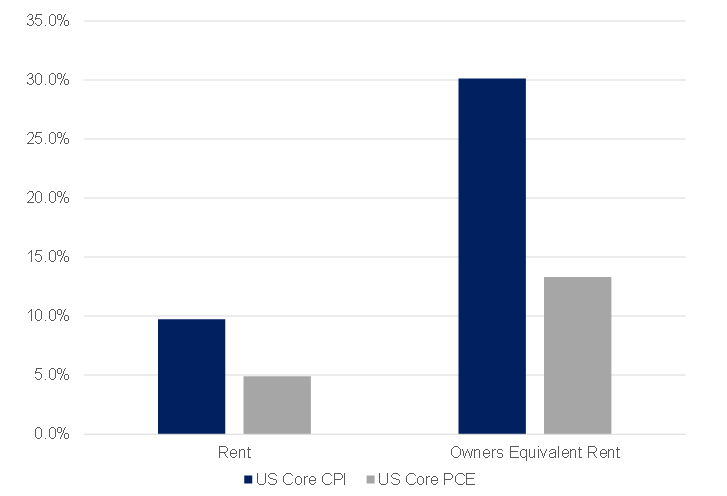
Source: Anchor, Bloomberg
In terms of the relationship between home prices and shelter inflation, there are two important historical trends we rely on:
- Shelter inflation typically exhibits only one-third of the volatility of house prices (e.g., a 15% spike in house prices converts to shelter inflation of c. 5%).
- Shelter inflation has a significant lag relative to house prices. House price movements typically impact shelter inflation with about a five-quarter lag.
Figure 9: Shelter inflation typically lags US house price inflation by around five quarters and is significantly less volatile
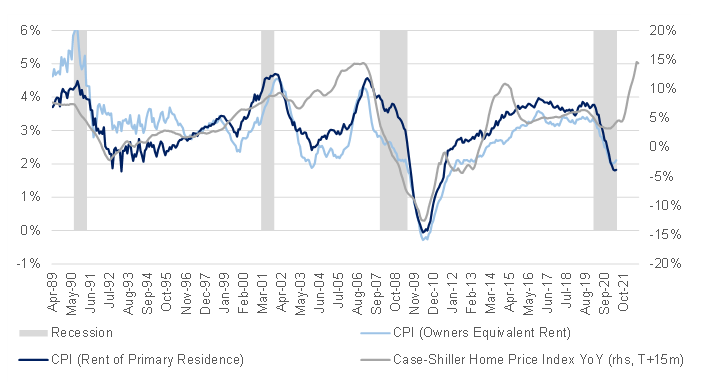
Source: Anchor, Bloomberg
We note that the current environment of rising house prices also coincides with a period of below-average rental vacancies, and this may add pressure to rental price inflation.
Figure 10: The recent spike in house prices coincides with a period of fairly low rental vacancies
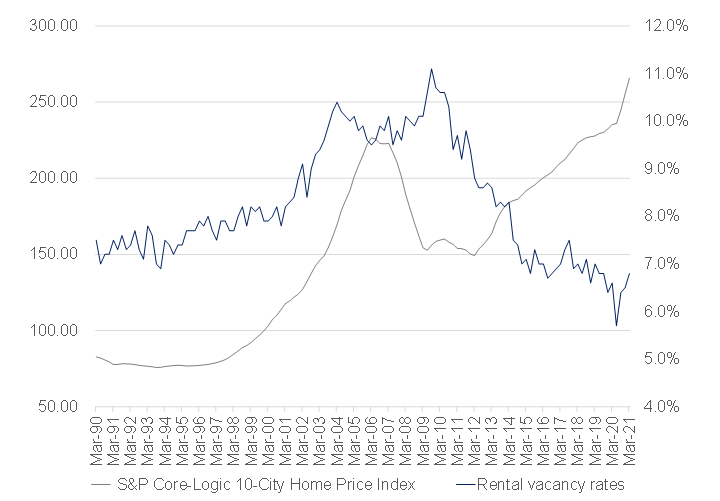
Source: Anchor, Bloomberg
So, as far as inflation goes, we see the current mid-teen house price inflation as likely transitory and, while we expect house price inflation to remain elevated for an extended period, we think this will likely only start to impact the US inflation basket towards the middle of 2022, by which time some of the transitory inflation pressures will have subsided in the rest of the basket. Given the historical ratio of shelter inflation to house prices, we expect high single-digit house price inflation to convert to low single-digit shelter inflation, which is roughly in line with historical shelter inflation levels and, as such, is unlikely to cause the Fed too many headaches.