According to the latest Adobe Digital Insights (ADI) Holiday Recap 2018 data, US shoppers spent a record $126bn online during the 2018 holiday season (the 61 days between 1 November and 31 December 2018). The data, based on transactions at 80 of the top-100 US online retailers, show that online holiday sales jumped by an impressive 16.5% YoY – the final tally includes the huge shopping days of Thanksgiving ($3.7bn), Black Friday ($6.2bn) and Cyber Monday (at $7.9bn this was the biggest US online shopping day overall last year). Average daily online revenues also surpassed $2bn for the first time (coming in at $2.1bn, on average), with 26 days of the 61-day period exceeding that amount (vs 15 days in 2017).
US online holiday retail sales, 2016-2018:
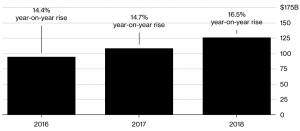
Source: ADI, Bloomberg
Some other takeaways from the ADI report include the following:
The major online retailers such as Amazon, Walmart, Target, Home Depot, Best Buy and eBay continued to take market share away from smaller chains and from big department stores. Smaller online retailers including Etsy, Shopify and Stitch Fix also took sales away from traditional brick-and-mortar stores.
The mobile traffic-to-revenue gap remains but the latest data show it is shrinking as 10% more-than-expected consumers used their smartphones to shop online. For the first time, smartphones accounted for more than half (51.4%) of all online visits during the 61-day period and 31% of all online sales were made via smartphone (+24% YoY).
Revenue market share by device used:
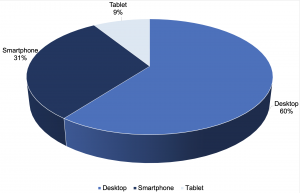
Source: ADI, Anchor
The five-day period from Thanksgiving to Cyber Monday accounted for $1 in every $5 (19.2%) of the total online retail revenue during the holiday shopping period.
The data showed that retailers with “a compelling online and in-store experience” have a significant advantage. This convergence of online and offline is helping retailers gain more sales and benefiting larger retailers such as Walmart, Target, Best Buy, Amazon etc. ADI’s analysis found that those retailers with both physical locations and online stores recorded a 50% YoY rise in the usage of buy online/pick-up in store (BOPIS). ADI noted, however, that BOPIS baskets, in general, contain only a few items and also comprised of cheaper items.
Retailers reached the $100bn mark 11 days earlier in 2018 than in 2017 (15 December vs 26 December).
The top-selling items online were L.O.L. Surprise! and Fingerlings toys, Take-Two Interactive Software’s video game Red Dead Redemption 2, the Nintendo Switch console, streaming devices, as well as Dell and Apple laptops.
Consumers spent an average 40% more per day during the three weeks after Cyber Monday than in the first three weeks of the season, ADI said and sales continued to grow until 17 December.
While the surge in online sales shows how the current low US unemployment and rising wages boosted consumer confidence during the holiday season, brick-and-mortar department stores (Macy’s and Kohl’s have both reported muted comparable sales for the holidays) continued to struggle. Reuters also writes that consumer confidence this year is seen as likely to be strained by the ongoing trade dispute with China, rising rates, market volatility due to concerns over global growth and the political deadlock in Washington which has seen a government shutdown which started on 22 December. Some market commentators have suggested the shutdown could last until mid-February which would make it the longest in history (c. 65 days vs the previous record of 21 days).
Meanwhile, another report from MasterCard, which provides insights into overall retail spending trends across all payment types, including cash and check, released on 26 December said that overall 2018 US holiday shopping season sales were up 5.1% YoY to $850bn-plus. This was the strongest growth in the last six years. According to the MasterCard data, online shopping recorded gains of 19.1% YoY. Total apparel had its best growth rate since 2010 of 7.9% YoY, while home improvement spending continued to surge across the US with spending during the holiday season up 9.0% YoY. However, the survey also found that department stores saw a 1.3% YoY decline, while electronics and appliances sales declined by 0.7% YoY and the home furniture and furnishings category grew 2.3% YoY. MasterCard noted that poor weather did pose an issue during some primetime shopping periods.