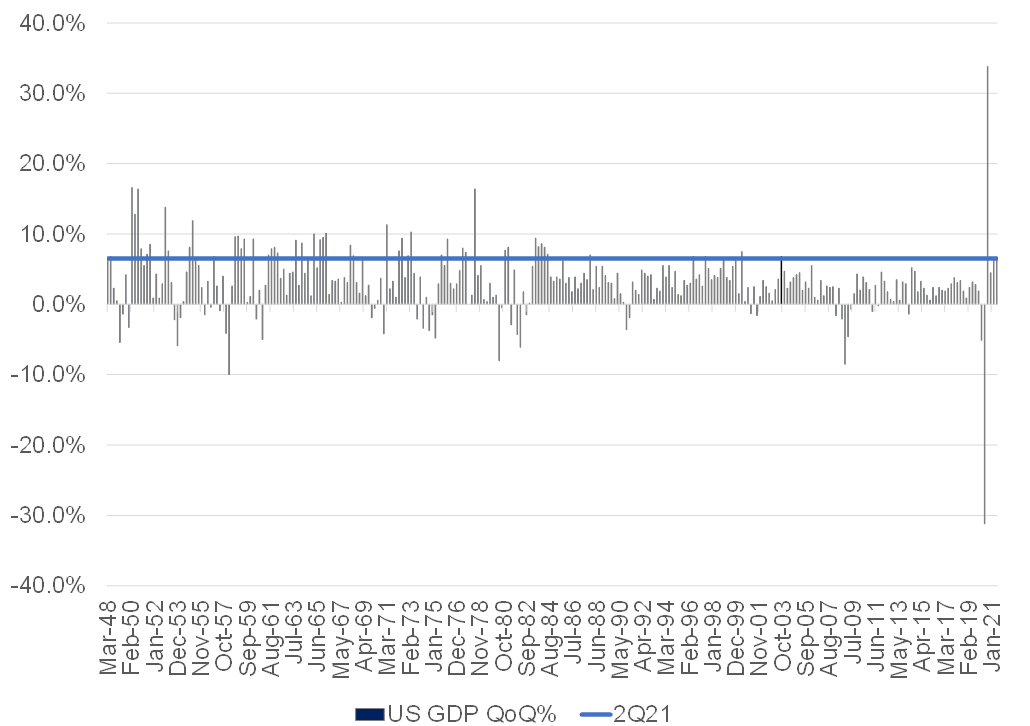
The US released 2Q21 GDP data on Thursday (29 July), that showed US economic activity accelerating by 6.5%annualised QoQ, as economic activity continues to normalise post pandemic. Nevertheless, ignoring the 33% QoQ jump in US economic activity in 3Q20, as the US bounced back from its worst-ever quarterly contraction in economic activity at the start of the pandemic (2Q20: -31.2% QoQ), 2Q21 was the strongest quarterly jump in economic activity in almost 20 years:
Figure 1: Historic US QoQ GDP data

Source: Anchor, Bloomberg
Despite this, the number was well below consensus economists’ forecasts of an 8.4% QoQ print. The key areas where growth disappointed relative to expectations were:
- Inventories were a 1.1% drag on economic activity for the quarter as consumption happened significantly faster than retailers were able to replenish stock (this was exacerbated by supply chain bottlenecks hampering restocking efforts). We believe that this will act as a tailwind to future economic activity as supply bottlenecks ease and allow inventory replenishment to catch up with demand.
- Government consumption, which was elevated in 1Q21 with the cost of processing loans for the Federal Paycheck Protection Program (PPP), slowed on a sequential basis into 2Q21 as the PPP programme wound down.
- Net exports: Imports grew faster than exports (7.8% vs. 6%), which resulted in a drag on GDP growth. Exports are still 10% below pre-pandemic levels, while imports are 4.5% above pre-pandemic levels.
- Residential investment contracted by 9.8% QoQ, but this is off a series of strong quarterly gains and recent data on housing starts and building permits suggest that activity in this area is picking up again into 3Q21. The contraction in this segment is also at least partially a function of the spike in US home prices, where prices grew faster than investment (resulting in negative real GDP growth in the category). Despite the drop, residential investment is still 16% above pre-pandemic levels, in real terms.
Other takeaways from the data include:
- Spending on services gathered momentum (+12% QoQ), rising faster than spending on goods (+11.6% QoQ).
- Services spending still consumes a meaningfully smaller share of consumer spending than pre-pandemic (65% vs 69%) and so, presumably, has significant room to run.
- Spending on durable goods is 29% above pre-pandemic levels, in real terms, and it will be interesting to see what happens to this spending as Americans burn through excess savings and are presented with more opportunities to spend on services as economic activity normalises.
- Core personal consumption expenditure (PCE), the US Federal Reserve’s (Fed’s) preferred inflation gauge rose by 6.1% QoQ. Importantly, we note that this was in line with expectations, the first time in a few months that a US inflation print has not exceeded expectations.
Conclusion
Despite the big miss (on largely technical and transitory factors), this was a solid set of data showing strong economic progress and a US consumer in good health. Nothing in this report should be cause for alarm for the Fed and it is unlikely to have any impact on monetary policy or rate expectations. While the data showed good progress on services spending, for now at least, there are no signs that this comes at the expense of elevated spending on goods and so we will need to keep monitoring future data releases for clues on whether the pandemic has had a structural impact on consumer spending patterns.


