Eighteen months after the global COVID-19 pandemic brought the world as we know if to a grinding halt, we look back at where we have come from, what has changed and what the “new normal” might look like. In this article, we compare pre-pandemic economic activity to the current state of play and the path we have travelled to get here, and we see if it provides us with some clues about what post-pandemic life might look like, at least as it relates to the drivers of economic activity. We focus on the three largest economic regions: The US, the European Union (EU) and China, which collectively represent c. 60% of global economic activity.
If the International Monetary Fund’s (IMF’s) forecasts for 2021 economic activity are correct, the US, the EU and China will see higher nominal economic output (in US dollar terms) of 6%, 10% and 16%, respectively, vs 2019 levels. This, despite the lingering influence of the pandemic on 2021 economic activity. By the same nominal US dollar measure the economies of the US and the EU shrank by 2% and 3%, respectively, in 2020, while China’s economy grew by 3% YoY.

These three economic powerhouses punch significantly above their weight in demographic terms, particularly the US and the EU, which represent c. 10% of the global population relative to the 42% of total global economic output for which they account.

So, perhaps they are not as statistically relevant when it comes to the impact that the pandemic has had on the mortality of populations, but they are relevant when it comes to the ongoing impact that COVID-19 might have on their future economic activity. From this perspective, the reported vaccination rates are encouraging, apart from the US, which might need a little more effort to ensure a higher likelihood of achieving the desired “herd immunity”.
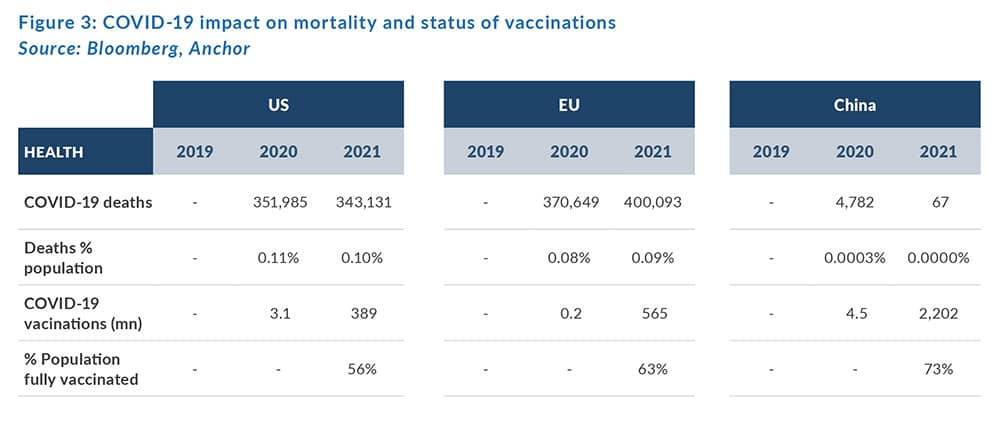
The movement restrictions that governments introduced during the pandemic were aimed at protecting people’s health and avoiding overwhelming hospitals, but these restrictions came with an economic cost and impacted the ability of many people to maintain employment.
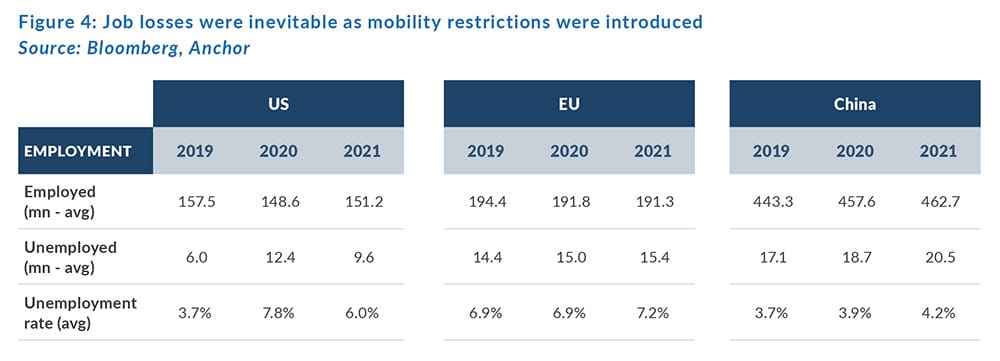
China does not provide the same level of detailed, frequent employment data that the US and the EU do, but available data suggest that the unemployment rate in major Chinese cities increased by less than 1%. The social safety net in the EU meant that the unemployment rate rose fairly slowly as governments used pre-existing systems to support employers, allowing the populace to maintain employment despite being unable to work. The US saw the biggest and most immediate impact on employment, with the number of people employed dropping by c. 25mn within a month of the start of movement restriction – that is the equivalent of roughly 1 out of every 6 employees losing their job within a month of the start of the pandemic.
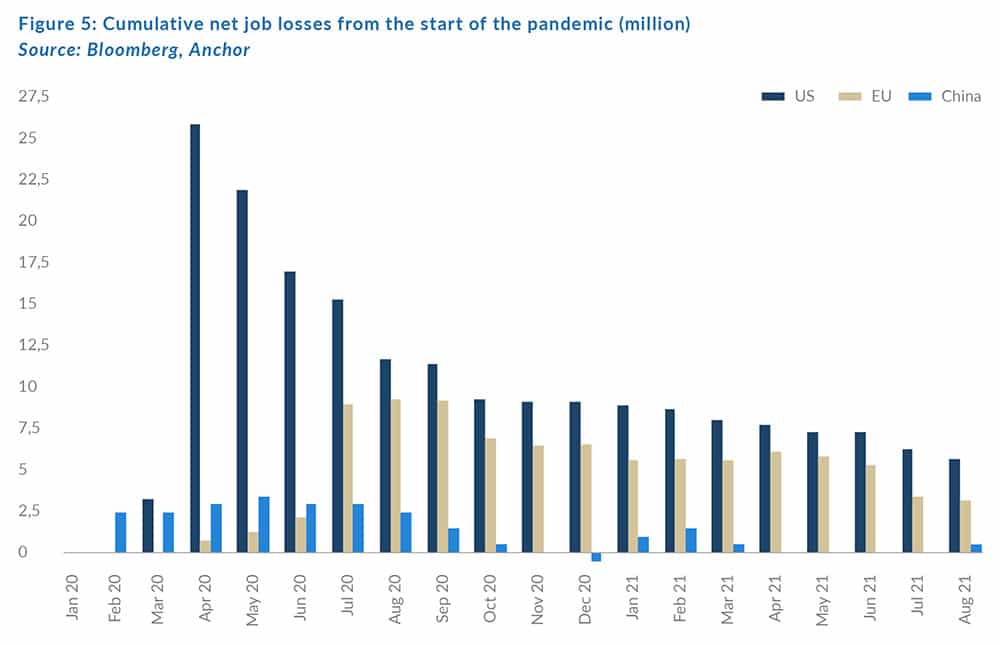
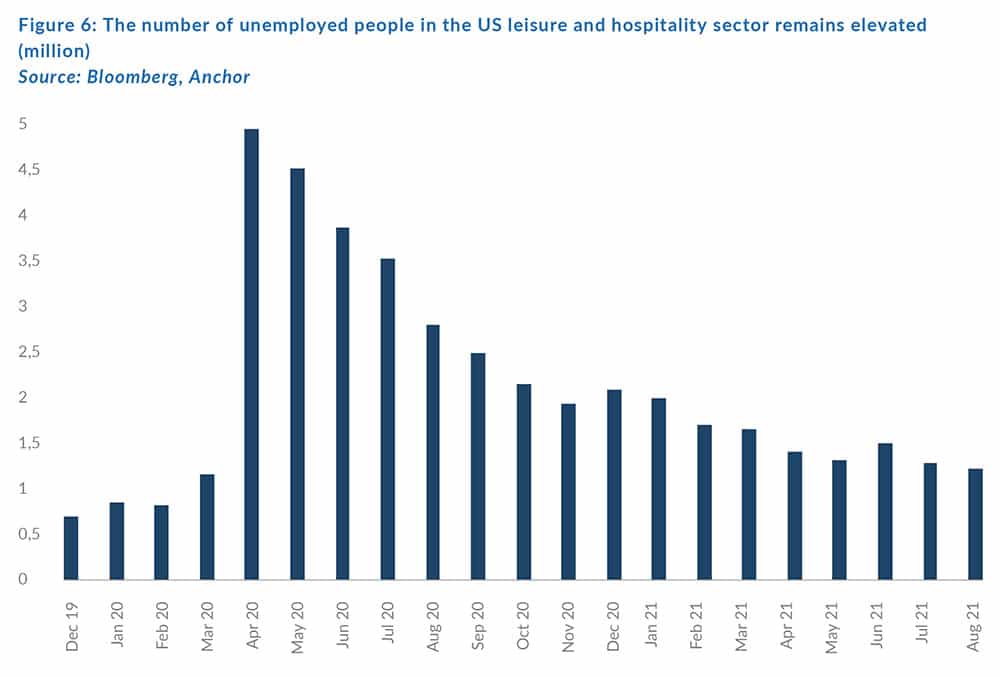
Unemployment rates are still elevated relative to pre-pandemic levels, although they appear to be on a positive recovery trajectory. However, we note that low-paying service sector jobs, particularly in leisure and hospitality, are yet to fully recover.
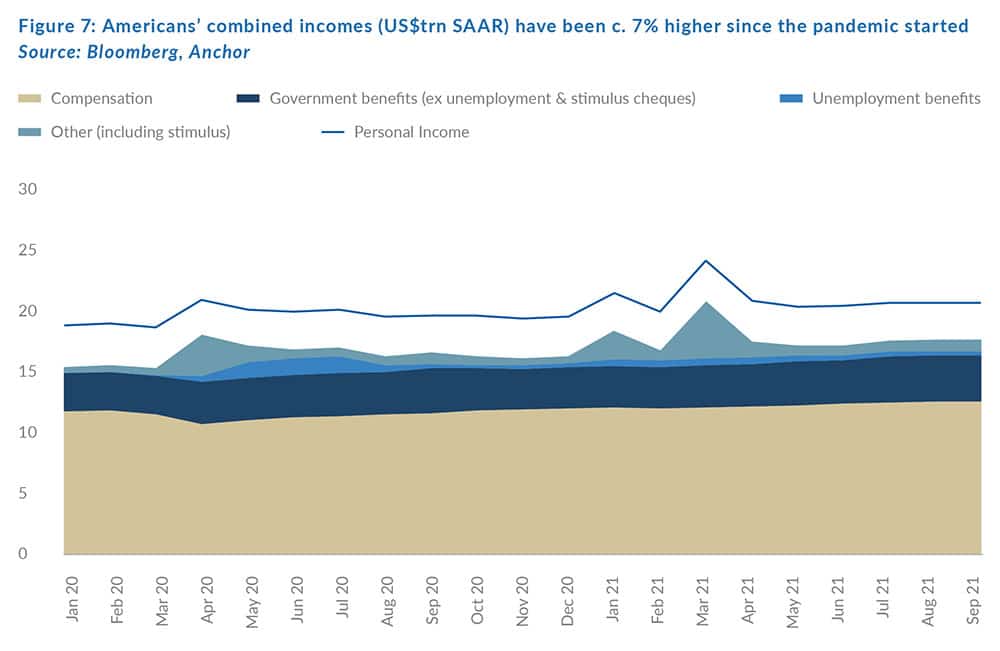
Fortunately, the impact on aggregate earnings was somewhat muted as governments stepped in to fill the income gap created by the pandemic. In fact, despite the job losses, the US saw the aggregate earnings of the population increase during the pandemic because of expanded unemployment benefits and other forms of stimulus, including c. US$800bn in cheques the government gave directly to it citizens to help get them through the pandemic.
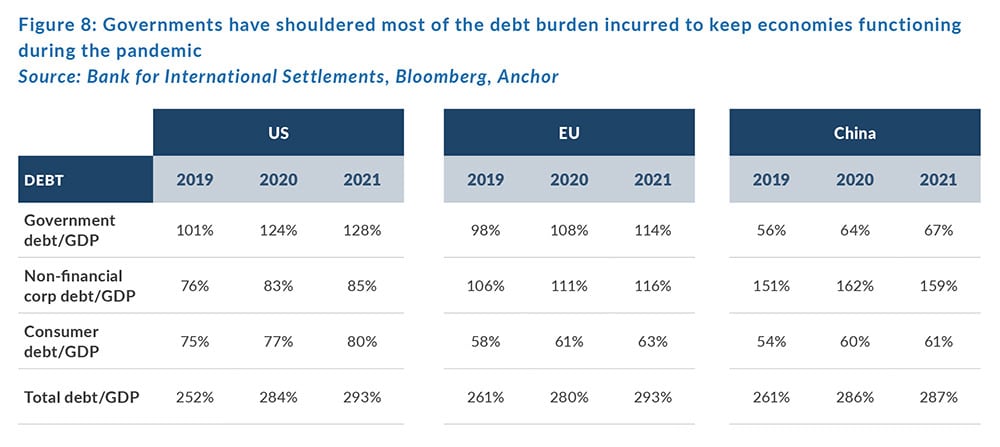
As a result of the generous intervention by governments, most of the increased debt burden fell on governments, which are significantly more indebted than they were pre-pandemic.
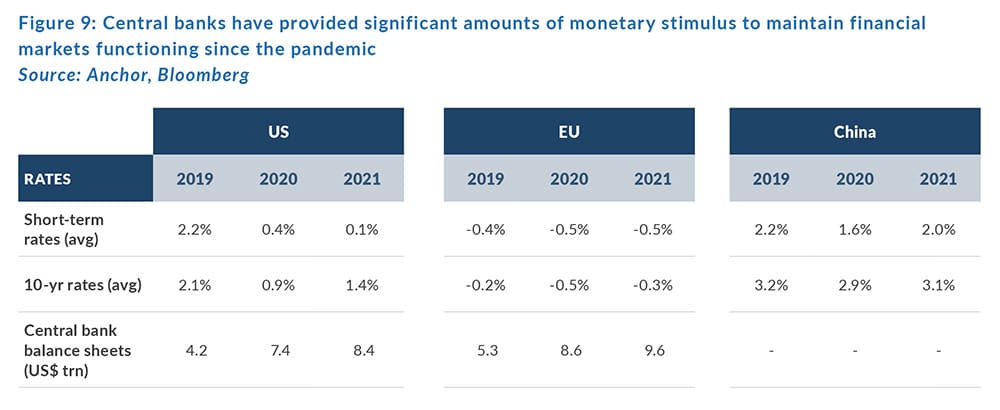
Central banks also played an important function in maintaining the integrity of the financial system as the pandemic hit, with the US, EU, and China all slashing interest rates. In addition, the US and the EU pumped significant liquidity into the financial system via quantitative easing (QE), with the Fed and the ECB having doubled the size of their balance sheets since the start of the pandemic, buying c. US$9trn worth of bonds, which have also kept yields and long-term funding rates suppressed.
The mobility restrictions, along with the stimulus provided by governments and central banks, have had an interesting impact on consumer behaviour. Consumption is the biggest driver of economic activity for the US, the EU, and China.
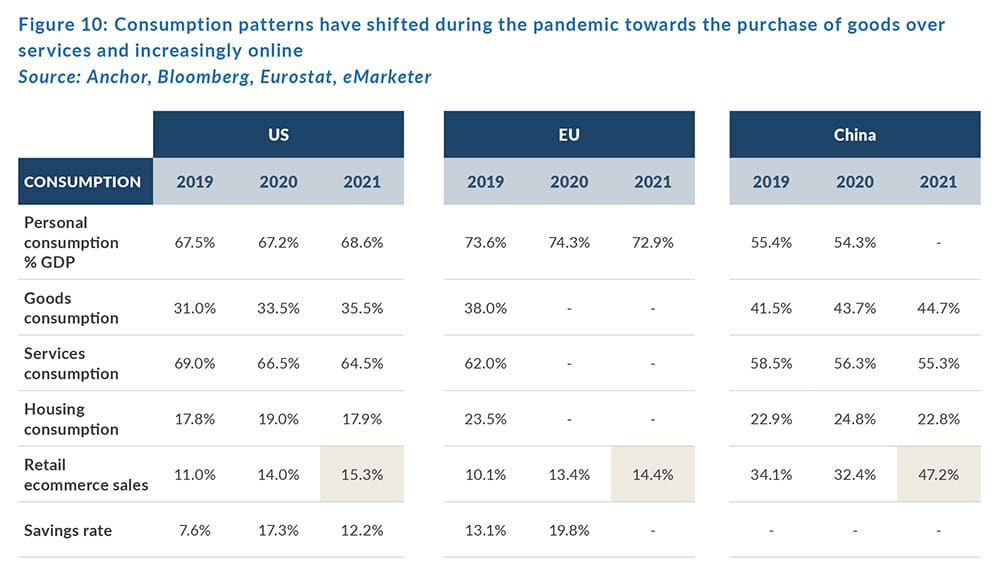
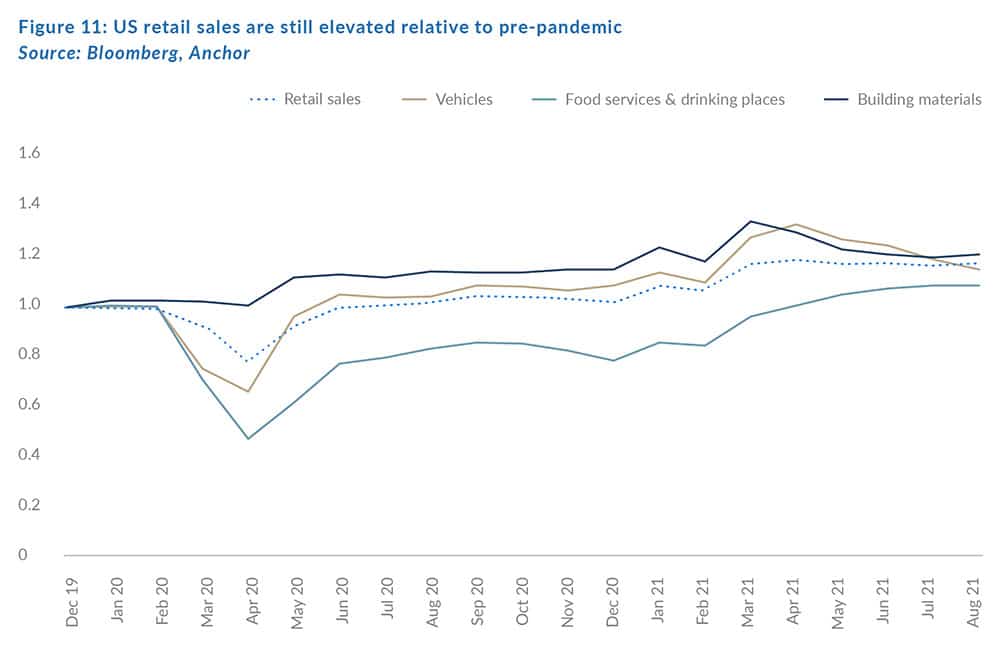
With large parts of the service industry (particularly travel and leisure) unavailable for consumers, consumption shifted towards the purchase of goods, with a particularly large spike in spending on cars and DIY. Conversely, spending on restaurants and bars has only surpassed pre-pandemic levels in the past few months.
The shift towards online spending was also a key theme of the pandemic, as customers were forced to embrace this method of consumption with physical stores often inaccessible. Forecasts from digital research specialist, eMarketer expect retail ecommerce sales penetration to remain meaningfully above pre-pandemic levels and even above 2020 levels. Retail sales data from the US Census Bureau though, are showing that the share of US retail sales happening online seems to be reverting towards its pre-pandemic trajectory.
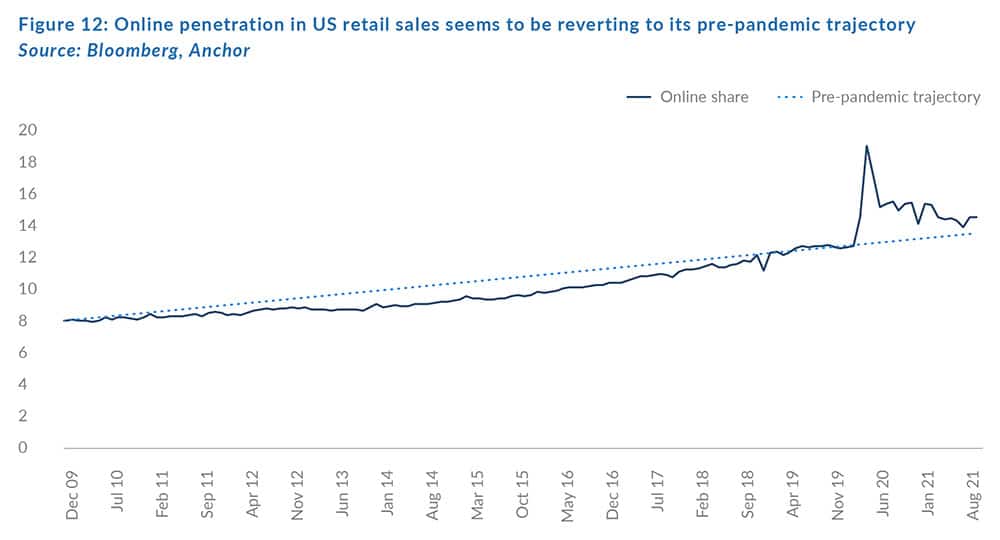
At this stage, it is perhaps still too early to opine conclusively on any structural shifts in consumer behaviour, with savings rates still elevated and the service industry (particularly travel and leisure) remaining far from fully operational. Initial indications though seem to suggest that, with the stop-start nature of the normalisation in mobility likely still playing out over the next couple of years, we are likely to see some level of reversion towards pre-pandemic patterns of consumer behaviour playing out over the next year or two.
The other major shift in behaviour during the pandemic was a shift towards working online, remotely or work-from-home (WFH). There is still much debate on how much WFM will continue once the pandemic has run its course, but indications are that WFH remains a meaningful phenomenon, even in those economies where mobility restrictions are easing.
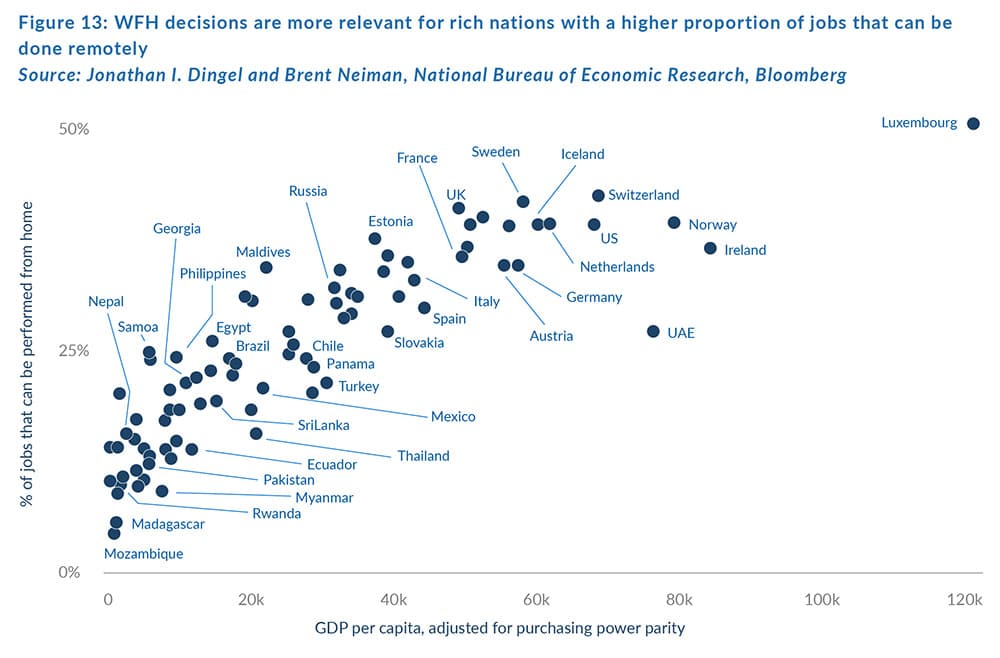
So, the phenomenon of WFH is applicable to more than 40% of US and EU workers. While mobility restrictions remain volatile, economists have come up with some creative ways to calculate the impact of WFH. In the US, building management company, Kastle, monitors the secure access data from 41,000 business across 2,600 offices in cities across the US to estimate the proportion of workers accessing offices relative to pre-pandemic levels. The data provide a sobering picture with WFH workers in major cities still only spending 20%-30% of their time in the office (apart from Dallas where the number is closer to 50%).
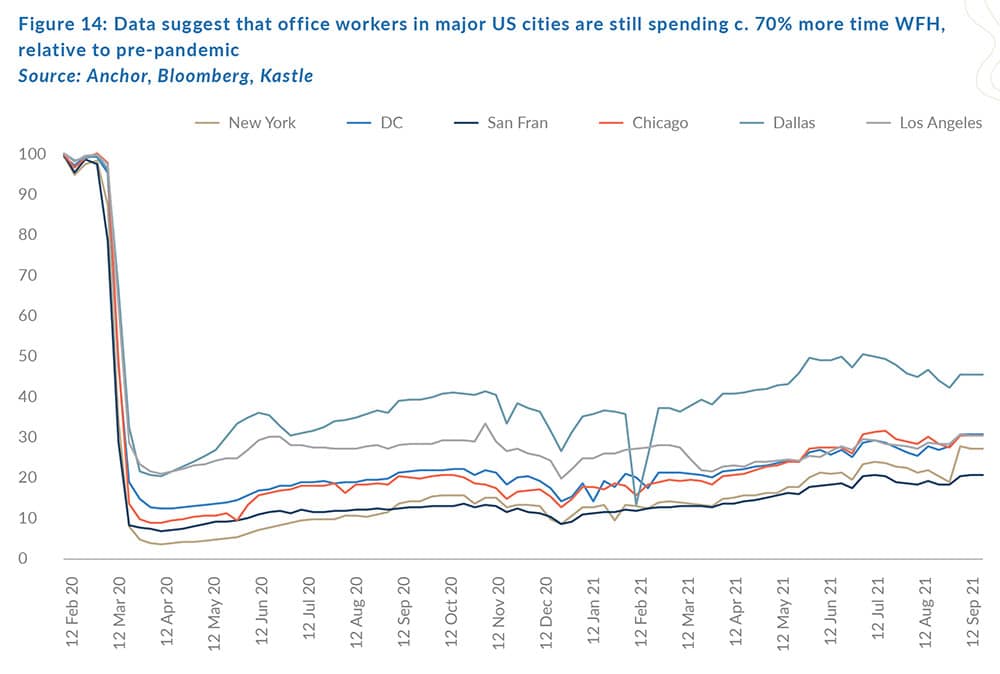
These data are at odds with Google mobility data, which suggest that mobility data related to workplaces reflect a level of between 20% and 30% below pre-pandemic levels in the US.
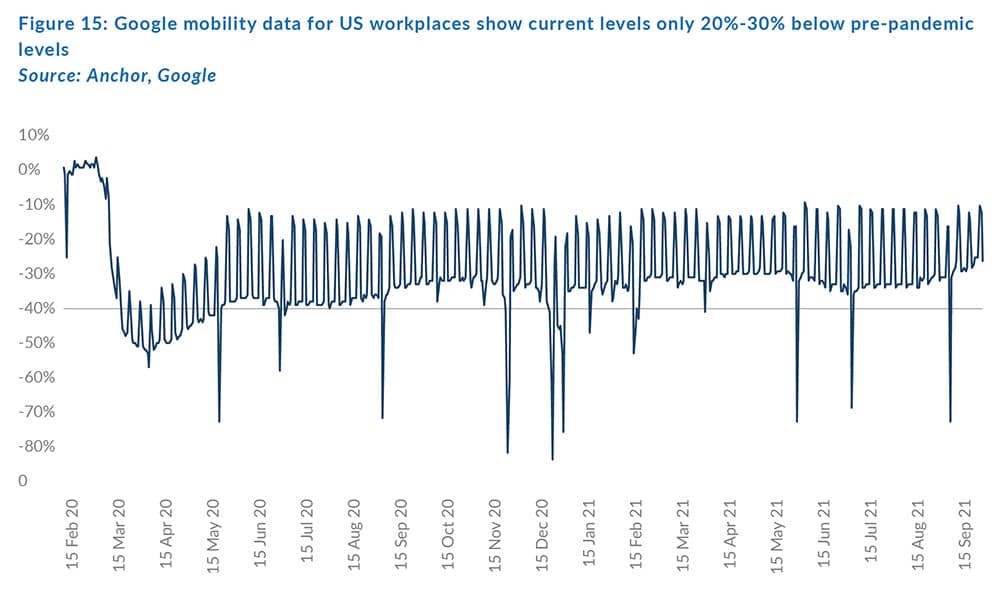
Perhaps the difference can be attributed primarily to the fact that Google data do not differentiate between the types of work, so it would include c. 60% of the employed population that does not have the option of WFH, suggesting that those able to WFH are doing so c. 40% of the time, which is much closer to the Kastle data.
Bloomberg have also used weekly sales data from sandwich chain, Pret A Manger Ltd., a popular lunch option with office workers, to assess the level of sandwich sales relative to pre-pandemic levels. This data, skewed towards the UK capital, suggest that there is still an elevated level of demand in London suburbs (presumably from those office workers still WFH). However, sales in key London office districts are significantly closer to pre-pandemic levels than the stats on office access in the US would suggest.
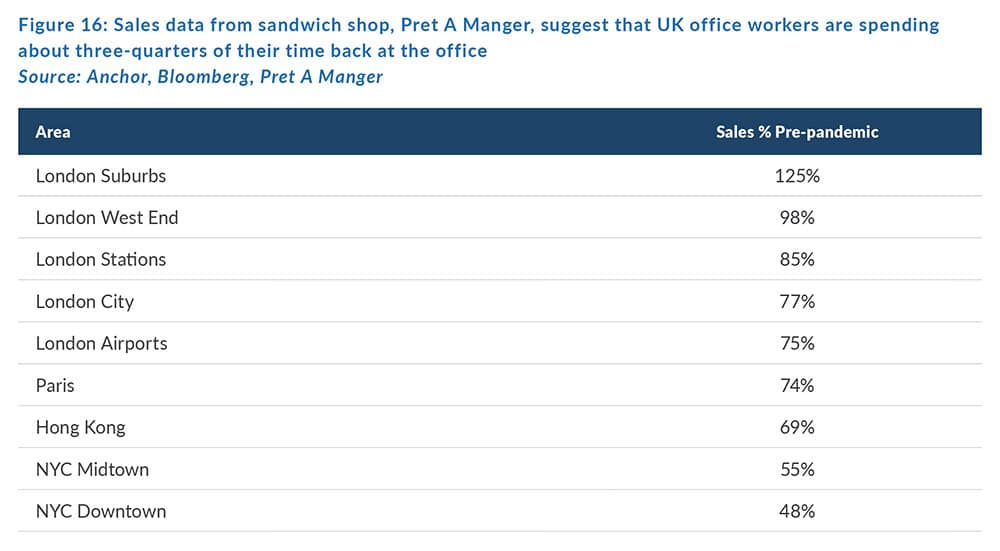
The UK has a higher vaccination rate than the US (67% of the population vs 56% for the US), so perhaps that is a factor in the apparently lower WFH rate. Again, it is probably too early to tell what the end game will be for office work, but it does seem that WFH will represent a larger share of office work going forward.
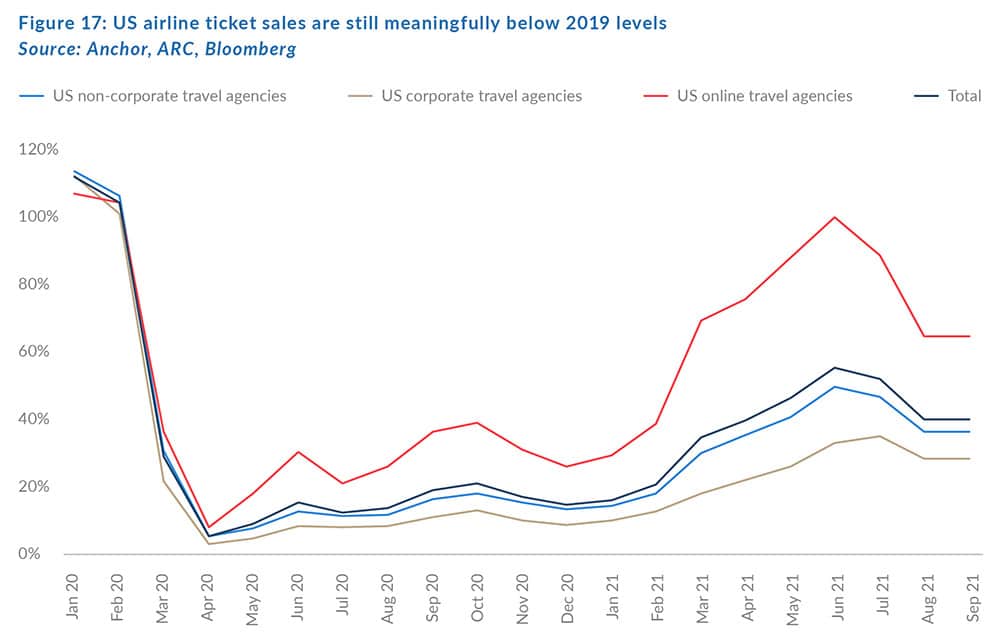
Travel is the final pandemic-impacted category we assess in this note. Global travel is still clearly heavily impacted by mobility restrictions, which will take some time to ease. However, domestic travel is starting to return in more vaccinated countries. Data from the Airline Reporting Company, which reports sales of airline tickets in the US, suggest that US airline ticket sales are currently running at about 40% of 2019 levels. Presumably these numbers are heavily impacted by the lack of international flights, but the other notable conclusions from the data are:
- How quickly ticket sales receded in August/September as the COVID-19 Delta variant infections spiked.
- How bookings by corporate travel agencies are the category lagging the most.
- How much faster online ticket sales recovered than those of travel agencies.
Conclusion
Economic activity in major economies is back above pre-pandemic levels, but the shape of that economic activity is still being impacted by mobility restrictions, including above-average retail sales, skewed towards a larger proportion of goods purchases than pre-pandemic and still partially funded by elevated savings levels, propped up by generous government support. Those able to WFH are still doing so significantly more often than pre-pandemic and travel is still well below pre-pandemic levels. It is still too early to assess how sticky these changes will be, but it seems likely that there is still going to be some level of reversion to pre-pandemic behaviours as mobility restrictions continue to abate over the course of the next year or so.


