In this research note we look at various ways of getting investment exposure to the price of oil. This note is purely for information purposes given the current state of flux in oil markets and it should not be construed as investment advice but rather as an informational overview of oil-sensitive investments.
The ETF industry has provided retail and institutional investors with a cheap and convenient way to invest in many asset classes that previously would have only been available to sophisticated institutional investors with the ability to trade complex derivatives. Unfortunately, some of these products are still backed by derivatives which creates an additional level of complexity for investors. ETFs tracking the price of oil are one of these instruments. In the first part of this note we discuss those ETFs that attempt to track the oil price and in the second section we focus on companies involved in the energy sector and some ETFs that track those companies.
ETFs tracking the oil price
Recently oil has come into the spotlight because of two issues: i) the unprecedented demand destruction due to movement restrictions related to the COVID-19 pandemic; and 2) the boost in supply as global oil producers, particularly Russia and Saudi Arabia, have been flooding the market in a tussle to gain market share. It is fairly common cause that the current, sub-$30 oil price (as at 20 April 2020) is not good news for any producers and, as such, it’s widely expected that supply cuts and normalising demand will result in the oil price climbing back to at least $35/bbl (for West Texas Intermediate [WTI] crude oil) in the not too distant future.
Unfortunately, the reality is that oil markets are already pricing-in this eventuality and derivative contracts, allowing investors to purchase oil in one-years’ time, are already expecting investors to be paying $35/bbl by then. Therefore, this information, which is broadly known, is already reflected in the pricing and investors will be unable to profit from it.
Figure 1: The current price for buying WTI crude oil in the future*
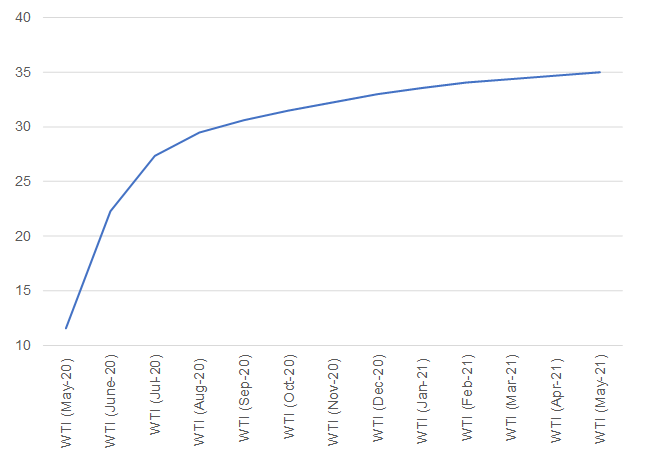
Source: Bloomberg, Anchor
*note that data are as at 20 April 2020.
That is not good news for investors who have this year poured about $5bn into the largest US oil ETFs (the US Oil Fund ETF).
Figure 2: US Oil Fund ETF*
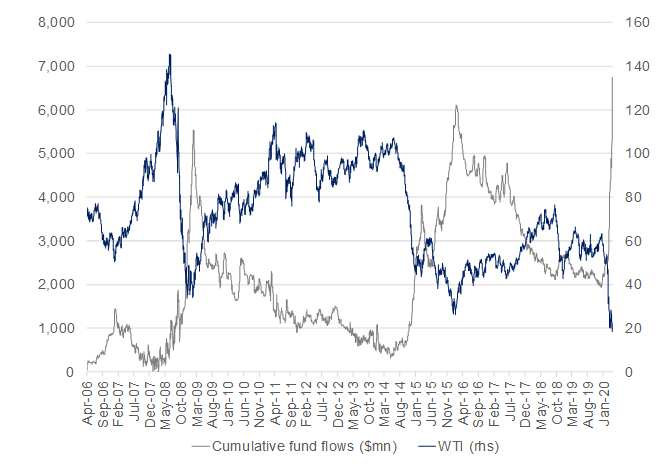
Source: Bloomberg, Anchor
*note that data are as at 20 April 2020.
Trading in oil
There are multiple different varieties of oil. In Figure 3 below, we give a snapshot of the pricing of a few of the US varieties (some priced as low as $1.86/bbl at the time of writing [20 April 2020]) with the relative price reflecting multiple factors including the quality and the cost of getting it from the oil wells to the refiners.
Figure 3: Example of prices for physical oil purchases in various North American oil-producing regions
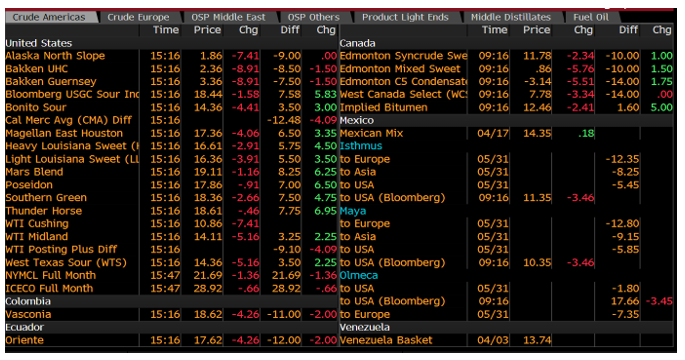
Source: Bloomberg
To simplify the above, we typically predominantly look at two indicators to decide what the “price of oil” actually is:
WTI: WTI is based on futures contracts representing the price of purchasing oil at Cushing, Oklahoma (the main transport hub and storage facility for oil in the US) at the beginning of the following month.
Brent: Brent is based on futures contracts which represents the price of purchasing oil at Sullom Voe Oil Terminal in the North Sea near Scotland at the beginning of the following month.
These futures contracts expire each month so, in order to create an historical price series for these two “oil prices”, we typically reference the contract which is due for delivery next month and as that approaches expiry we just switch into the next contract. That creates a smooth historical price series for oil and is what most of us imagine when we read about the oil price.
Unfortunately, the reality of switching from the currently expiring futures contract to the next one is far more complex in the real world and the biggest impact on the switch is the near-term demand for oil. Futures contracts represent an obligation in the real world to purchase physical oil. This means that if you are holding a contract that expires, you are obligated to buy oil at the value of that contract. In order to avoid receiving physical oil and rolling into the next contract, you need to find somebody to sell that expiring future to, and that person needs to have the ability to physically purchase and store that oil. The difference between the selling price of the expiring contract and the purchase price of the next contract is usually an indication of the cost of storage for the following month.
When supply exceeds demand (as is currently the case), the cost of storage tends to go up, particularly as storage capacity starts to run out. At other times, when there’s a unexpected drop in supply (often as a result of war in oil-producing regions, sanctions or explosions at processing facilities) the oil price for immediate delivery can exceed the price of oil for future delivery (this concept is referred to as backwardation). However, typically since there is a cost associated with storing oil, the price of oil for immediate delivery is usually lower than the price of oil for future delivery (this concept is referred to as contango).
Oil ETFs usually invest in the closest-to-deliver futures contract (generally the WTI futures contract for the biggest US ETFs). Because of the need of these ETFs to be constantly rolling into a new contract, which is usually more expensive than the current one, the ETFs incur a cost which tends to result in them underperforming the theoretical oil price series which just switches from one contract to the next with no cost.
This cost is also usually somewhat muted when the oil market is in balance, e.g. the theoretical WTI Index appreciated by 4.4% p.a. for the three years ending 31 December 2019 and the US Oil Fund ETF was up 3.0% p.a. over the same timeframe, with c. half of the difference as a result of fees and the other half related to the cost of rolling futures contracts. In extremely dislocated markets, such as the one we’re in at the moment, when oil demand is off by c. 30% and supply is down only around 10%, we run the very real risk of running out of storage and so the cost of storage spikes (currently [as at 20 April] the cost of storage implied by the futures is about $10/bbl per month!). In times like these, when investors are tempted to buy what looks like cheap oil in ETF format, the subsequent investment experience can be disappointing.
Figure 4 below shows a 15-year history of the US Oil Fund ETF. The chart has two components:
- Ratio ETF/WTI: This is the blue line representing the performance of the ETF relative to the performance of the theoretical WTI benchmark. When this line is sloping downwards, the ETF is underperforming the WTI benchmark (and vice versa).
- Calendar spread: This represents the cost of rolling from the expiring futures contract into the next futures contract.
Figure 4: ETF performance relative to WTI performance
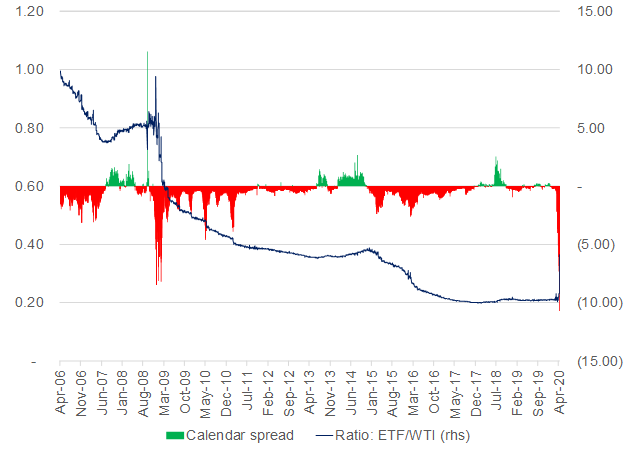
Source: Bloomberg, Anchor.
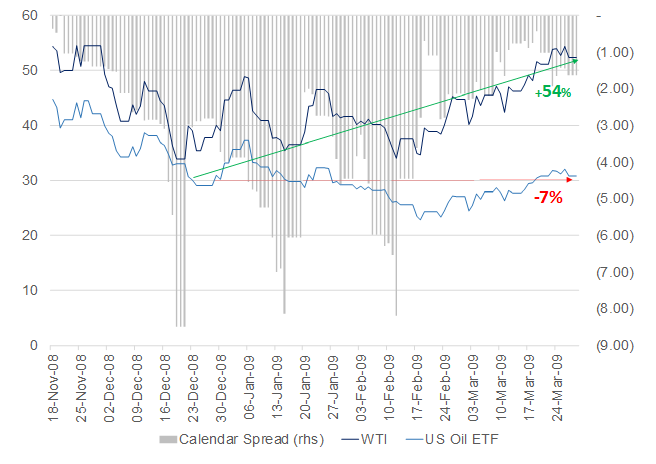
The last time storage was this constrained was around the global financial crisis (GFC) from late 2008 to early 2009 and looking at that experience can give some insight into the potential headwind to US Oil Fund ETF performance over the next few months as we again experience extreme capacity constraints:
- WTI dropped about 40% from $55/bbl to $33/bbl from mid-November 2008 to mid-December 2008.
- Calendar spreads peaked at c. $9 in mid-December as WTI troughed.
- WTI then bounced back by 54% to $52/bbl over the next three months and over the same period the US Oil ETF dropped by 7%.
- Ironically, this was also the last time investors poured $5 bn into the US Oil Fund ETF to try and take advantage of the “cheap oil” (see Figure 2 above).
Figure 5: US Oil Fund ETF underperformance during the GFC
Source: Bloomberg, Anchor.
Energy companies and the ETFs tracking them
There are also various ETFs which track the shares of companies involved in the energy industry and here we will focus on the following three ETFs (all listed in the US and tracking US-listed companies) in an attempt to unpack how sensitive they are to movements in the oil price:
- SPDR Energy Sector ETF (XLE): It includes 28 S&P 500 stocks, has $8.5bn of assets under management (AUM) and a TER of 0.13% p.a.
- Vanguard Energy ETF (VDE): It includes 131 stocks, has $2.5bn of AUM and a TER of 0.1% p.a.
- SPDR Oil & Gas E&P ETF (XOP): It includes 56 stocks, has $1.8bn of AUM, with a TER of 0.35% p.a.
Some of these energy companies are also involved in gas but, for the purposes of this note, we won’t try to differentiate those. Energy companies can be split into the following sub-industries, which tend to have varying sensitivity to the price of oil:
- Integrated Oil & Gas: These are typically the largest companies which have multiple divisions involved in exploration, storage, refining and marketing with multiple revenue streams that have a varying sensitivity to the oil price.
- Oil & Gas Storage and Transportation: These firms include those that own pipelines, storage facilities and ships.
- Oil & Gas Exploration and Production (E&P): These companies purchase oil fields and extract and sell the oil.
- Oil & Gas Refining and Marketing: These businesses purchase crude oil, refine it into petroleum and other end products and sell these end products.
- Oil & Gas Equipment and Services: These companies manufacture, service and operate equipment used in the extraction, transportation, and refining of oil & gas.
- Oil & Gas Drilling: These companies own and operate drilling equipment used in the E&P process.
In terms of displaying the sensitivity of the sub-industries to the movements in the price of oil, we have looked at about 130 of the companies in the VDE ETF and Figure 6 and 7 below shows the market cap weighted performance of those companies in those two periods:
Figure 6: The sensitivity of energy sub-industries to positive oil price movements – 17 June 2017 to 5 May 2018
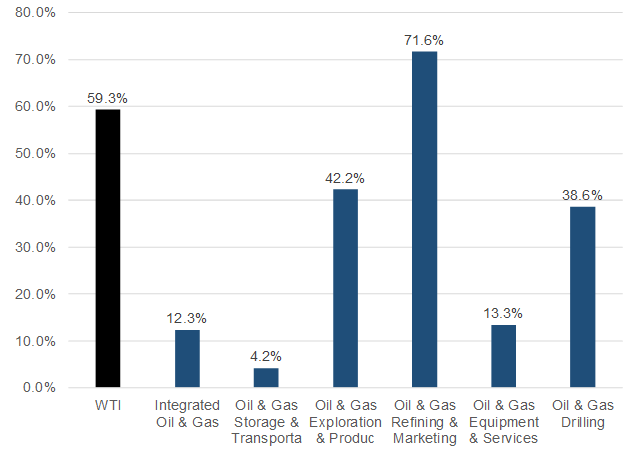
Source: Bloomberg, Anchor.
Figure 7: The sensitivity of energy sub-industries to negative oil price movements – 31 December 2019 to 17 April 2020
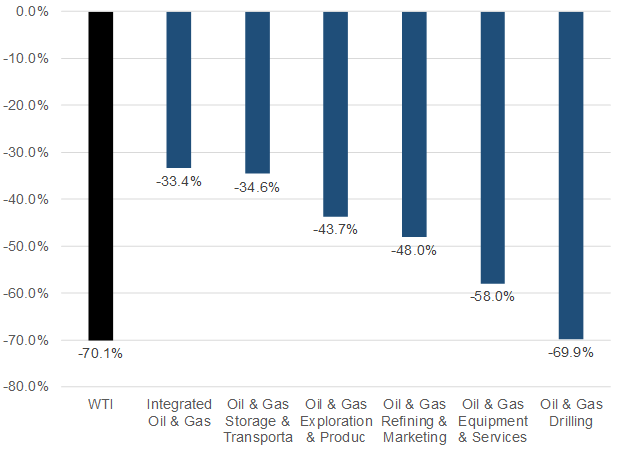
Source: Bloomberg, Anchor.
The integrated oil and gas companies with their diversified earnings streams tend to have the lowest sensitivity to the oil price, with the drilling and services companies being the most sensitive.
Oil and gas E&P companies tend to have the most stable sensitivity to the oil price, with similar sensitivity in both up and down markets, which makes sense given the direct relationship between their revenue and the oil price.
Companies within those sectors have varying sensitivities based on the quality of their operations, the strength of their balance sheet and how exposed they are to various parts of the cost curve. In Figure 8, we highlight a table which goes into further, high-level detail on the three-biggest companies in each of those sub-industries (with performance figures referencing the two periods discussed above):
Figure 8: The sensitivity of the biggest companies in the energy sub-industries to oil price movements
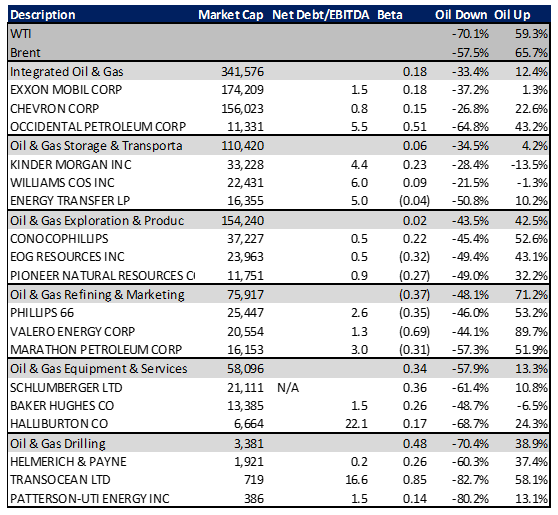
Source: Bloomberg, Anchor.
Getting back to the three ETFs we have used for this analysis, Figure 9 below gives more detail on the sectoral exposure of those ETFs:
Figure 9: ETF sub-industry exposure
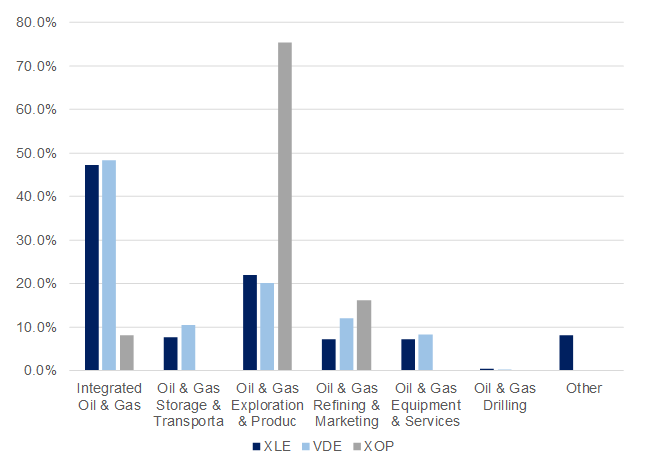
Source: Bloomberg, Anchor.
In terms of achieving moderate exposure to the movement in the price of oil from here, integrated oil companies are probably the best sector to focus on, while companies in the oil & gas E&P sector should have slightly higher sensitivity to the price of oil (both up and down).