The US market has been caught in a sell-off over the past few weeks, with the indices masking severe damage under the surface, particularly among growth and momentum names. For example, the Magnificent 7 Index has fallen by c. 17% since mid-February. The ostensible cause of the decline is the political and economic uncertainty caused by US President Donald Trump’s aggressive and haphazard actions concerning tariffs and, to a lesser extent, the Department of Government Efficiency (DOGE) – both of which equate to a form of austerity. Trump and US Treasury Secretary Scott Bessent have publicly stated their willingness to bear short-term pain in pursuit of their policy objectives, adding fuel to the fire.
Figure 1: Bloomberg Magnificent 7 Price Return Index
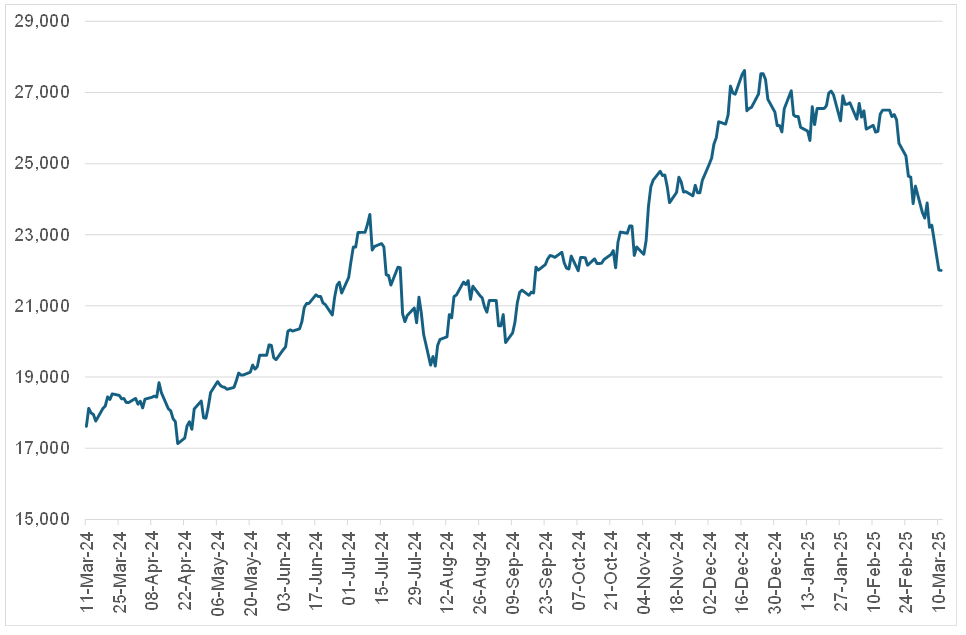
Source: Bloomberg, Anchor
Ironically, most growth shares would not be materially impacted by tariffs unless you assume they lead to a full-blown recession. To a large extent, this has been as much a story about investors unwinding their positions. The chart below shows that Goldman Sach’s hedge fund clients had their biggest two-week reduction in gross exposure in the past decade. Note that this chart was as of last Friday (7 March), i.e., excluding Monday’s (10 March) sell-off.
Figure 2: Prime book: Global equities
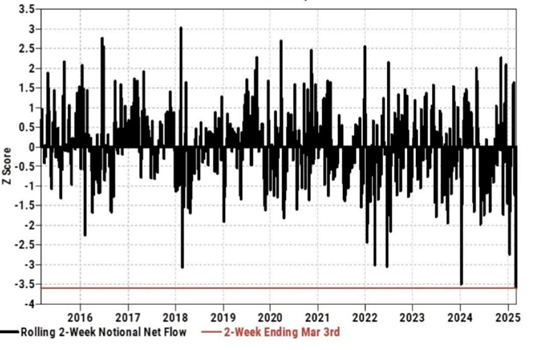
Source: Goldman Sachs
For now, the fears about tariffs leading to a recession have been more of an equity than a fixed-income phenomenon. Credit spreads (Figure 3 below) are not yet signalling stress but are spiking off very tight levels.
Figure 3: US corporate BAA 10-year spread
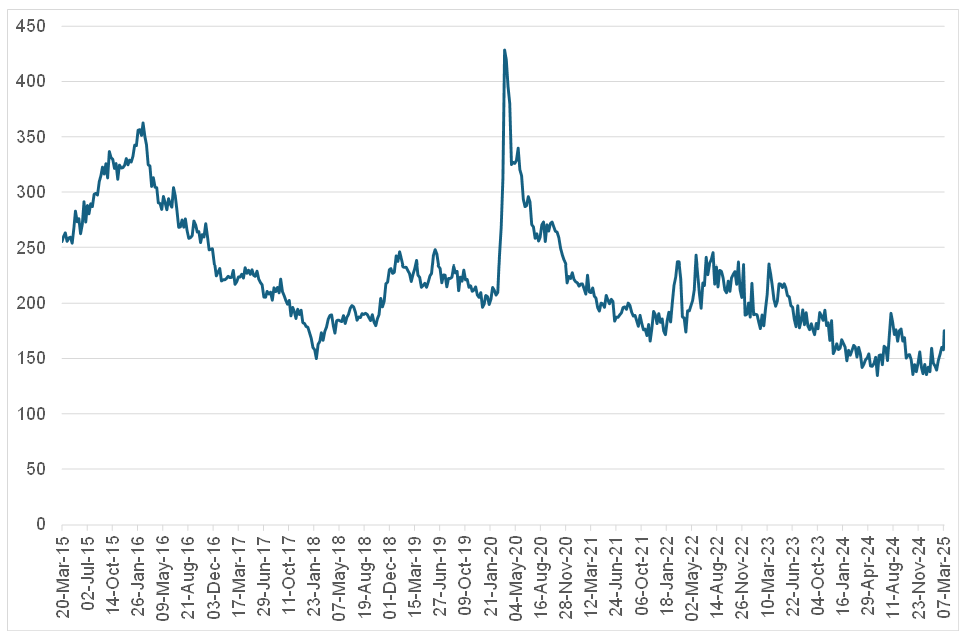
Source: Bloomberg, Anchor
Either way, investors are showing extreme fear, based on sources like the CNN Fear and Greed Index. The index measures prevailing emotions influencing the stock market by weighing seven key indicators, each reflecting different aspects of market sentiment. It operates on a scale from 0 to 100, with a score under 45 indicating fear, a score of 55 and above signifying greed, and one in between marked as neutral. Scores below 25 and above 75 are labelled Extreme Fear and Extreme Greed, respectively.
Figure 4: CNN Fear and Greed Index
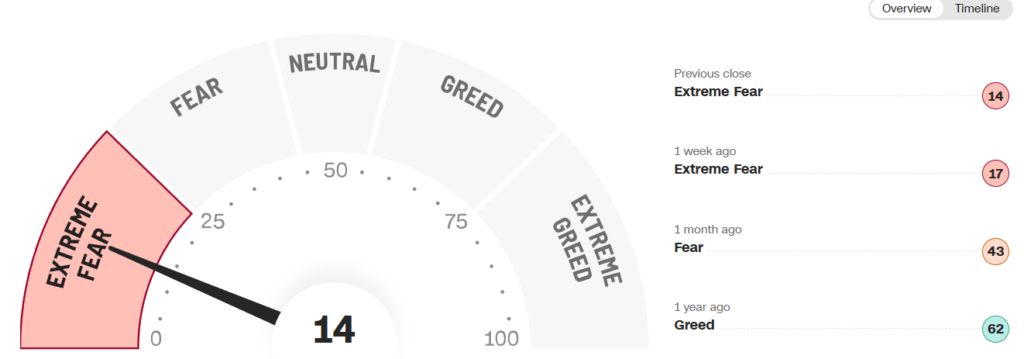
Source: CNN Business, Note last updated 11 March 2025 at 9:05 AM ET.
There are numerous potential paths from here, but some of the main ones are:
1. Recession
The US tips into recession due to a combination of fiscal retrenchment and reduced consumption from wealth effects (stocks down = people feel poorer and spend less). If this happens, it would be the biggest own goal in history and would severely hurt the Republicans’ chances in the November 2026 midterm elections. As a former hedge fund manager, Bessent should realise they are playing with fire. As a counterpoint, we note that the US economy is incredibly dynamic and resilient and did not experience a recession (as defined by the National Bureau of Economic Research [NBER]) after the joint stock and bond bear markets of 2022. The upper-income cohorts responsible for the bulk of consumption are even richer today than they were then.
Two factors that may be partially responsible for the recent economic softening were the strong dollar and high interest rates. Both have subsequently fallen sharply, which should provide a tailwind later (the converse is true for Europe). Nevertheless, if we assume a recession, major indices could be about halfway through their fall. It might be tempting to say, “I’ll just go to cash and then re-invest when it’s all over”, but the market never gives you the “all clear” signal and typically turns far quicker than you could imagine, even when the picture appears dire. Nobody on the planet has been able to do this successfully and repeatedly.
2. Policy wins
With the timing of the midterms in mind, Trump has front-loaded a lot of the bad stuff regarding his agenda. Now he needs a win. For example, one potential upside of reciprocal tariffs is a ‘grand bargain’ where everyone drops tariffs to zero, and everyone wins. Or he gains sufficient concessions from trade partners and declares ‘job done’. Other wins could come in the form of fast-tracked deregulation and tax cuts. These would all be positive for markets.
3. No recession
Given what we have said about the US economy, economic data and corporate earnings may turn out better than feared, even without a specific catalyst. In this case, the market can stop worrying and turn around. Timing is uncertain, though – the Citi Economic Surprise Index (chart below) may need to head lower before it can turn the corner again. The index represents the sum of the difference between official economic results and forecasts – a sum above zero indicates its economic performance generally beats market expectations. In contrast, below zero shows that economic conditions are worse than expected.
Figure 5: Citi Economic Surprise Index
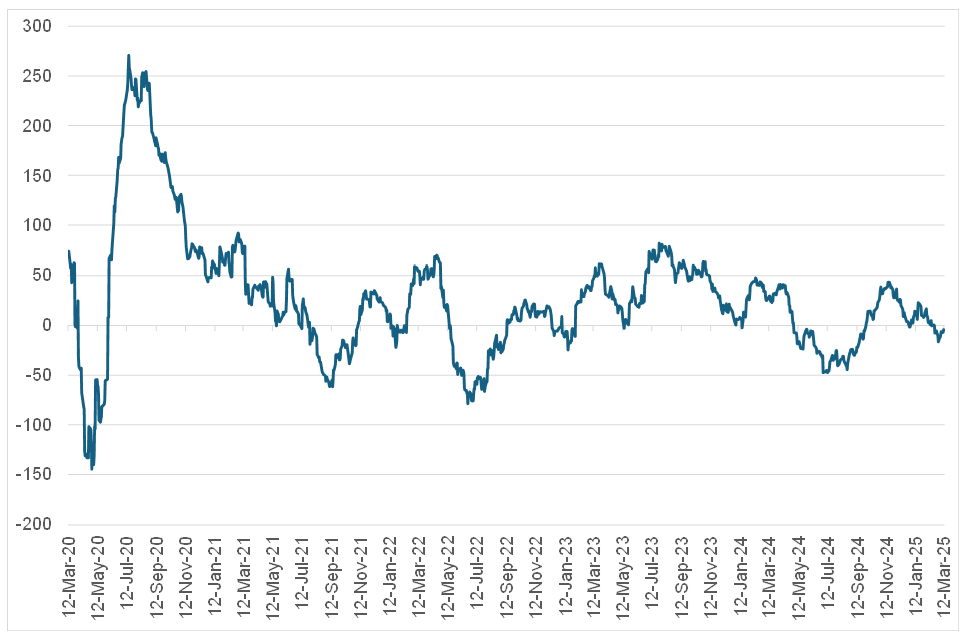
Source: Bloomberg, Anchor
We use Bloomberg consensus estimates and historic average P/E multiples to create an objective 12-month forward estimate of returns for a handful of major indices. We do not assume these are predictive, but they can provide useful information, particularly at extremes. The Nasdaq looks particularly compelling, while global equities appear to offer decent returns. We perform a similar exercise at the fund level, and the numbers are very attractive; in fact, they are the highest on record. None of this means that the market cannot or will not go lower, but the odds favour taking the other side of the fear trade.
Figure 6: Various major indices12-month forward estimate of returns
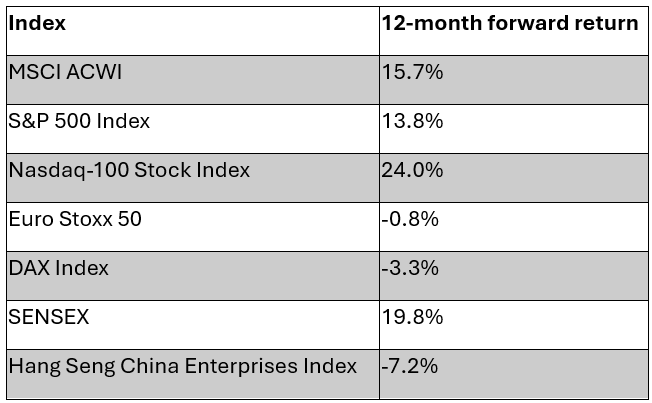
Source: Bloomberg, Anchor
We note that the Magnificent 7 Index has de-rated significantly; the group is now trading at roughly one standard deviation cheap vs its 5-year history. The group could de-rate further in a bear market, but it is difficult to argue for a repeat of 2022, an inflationary cycle in which the US Federal Reserve (Fed) rapidly raised rates. Whatever this is, it is not that.
Figure 7: Various major indices12-month forward estimate of returns
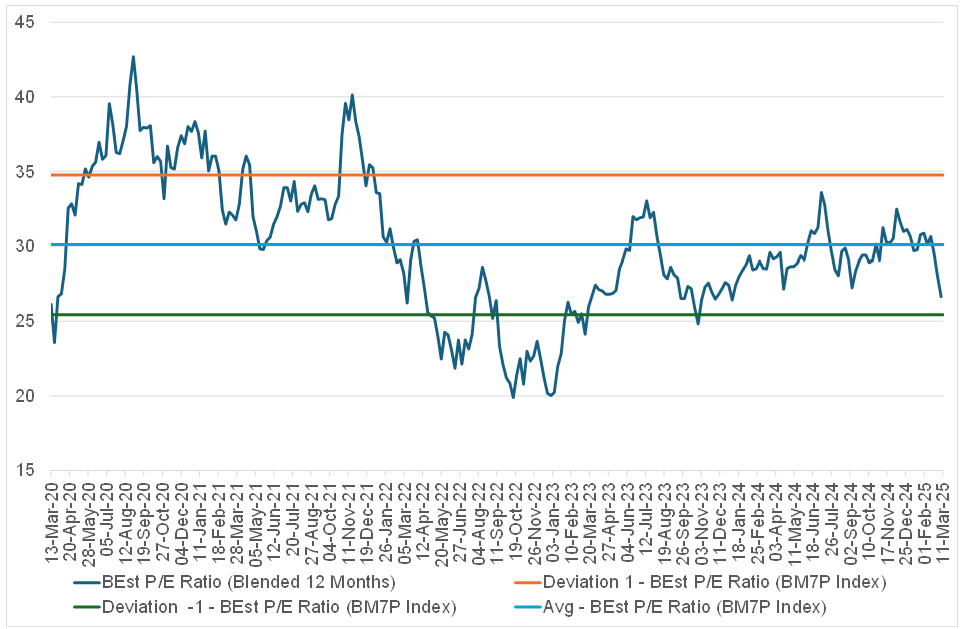
Source: Bloomberg, Anchor
There are very few sources of ‘edge’ in the market – everyone is smart, has access to the same information, and (almost) nobody can trade faster than everybody else. But one potential source of edge is to trade on the other side of people who are forced/non-economically driven sellers – either due to leverage, risk limits, or emotional stress (panic). You will never earn excess returns for doing something as easy and natural as panicking. Buffett did not say, “Be greedy when others are fearful” without reason.